What is PCR (Put Call Ratio)




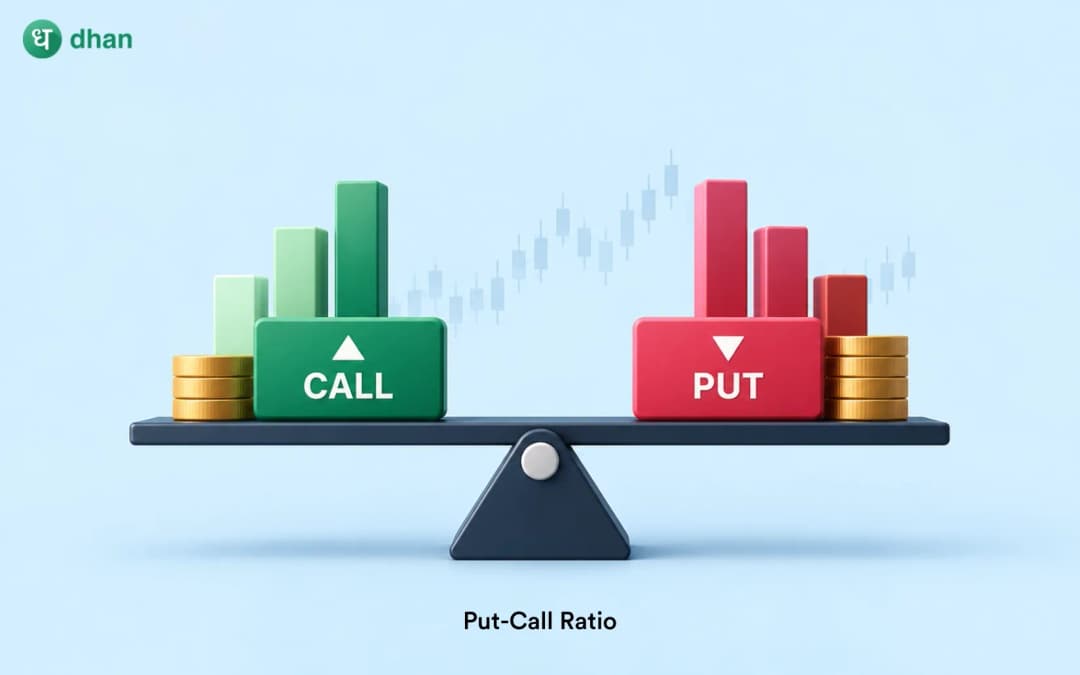




Key takeaways:
- PCR (Put-Call Ratio) compares put options with call options using open interest or trading volume.
- A PCR above 1 indicates higher put activity, while a PCR below 1 indicates higher call activity in the selected data.
- PCR can help traders study market sentiment and options positioning, but it cannot predict market direction on its own.
- Traders should analyse PCR alongside price action, strike-wise open interest, and India VIX before making trading decisions.
The stock market is driven by price action, trading activity, and market expectations. For options traders, understanding these factors can aid them in evaluating market conditions prior to making a trading decision. If you are new to options, start with option trading basics before using indicators like PCR.
The Put-Call Ratio (PCR) is one indicator that traders often follow. It compares put options to call options and helps traders understand how activity is spread throughout the options market.
But what does it really mean to have a high or low PCR? How is it measured and can it assist traders in spotting a potential reversal in the market? Let's understand the basics, with examples, calculations and practical ways to interpret this indicator.
What is PCR in the stock market?
PCR is the Put-Call Ratio. It is a measure in the derivatives market that compares the open interest or trading volume of put options to that of call options.
Traders often use PCR to measure market sentiment and get a feel for the relative activity of put and call options.
PCR combines the activity in these two types of contracts in one figure. While it aggregates activity from both contract types into a single metric, it cannot independently clarify the specific motivations of traders.
How is PCR calculated?
The Put-Call Ratio can be calculated using two methods: open interest and trading volume.
1. PCR based on open interest
Open interest (OI) is the total number of open option contracts that have not been closed, exercised or expired.
The formula is:
PCR (OI) = Total Put Open Interest ÷ Total Call Open Interest
For example, for a particular set of strikes and expiries, the Nifty options chain displays the following numbers:
- Total put open interest: 12,00,000 contracts
- Total call open interest: 10,00,000 contracts
PCR = 12,00,000 ÷ 10,00,000 = 1.20
The PCR is 1.20, meaning put open interest is 20% higher than call open interest in the selected data.
This is relatively more put-side open interest. This does not necessarily mean traders are expecting the market to fall, as open interest is made up of both buyers and sellers.
2. PCR based on trading volume
Volume-based PCR compares the number of put and call contracts traded over a given period of time.
The formula is:
PCR (Volume) = Total Put Trading Volume ÷ Total Call Trading Volume
Suppose 8,00,000 put contracts and 10,00,000 call contracts are traded during a session.
PCR = 8,00,000 ÷ 10,00,000 = 0.80
The volume-based PCR is 0.80. That means that, for that period, the put trading volume is 80% of the call trading volume.
Volume is the amount of activity during a specific period. Open interest is the total amount of contracts still open. It can differ quite a bit during the trading session.
What do high, low and neutral PCR values mean?
PCR values are often compared with 1 to understand whether put or call activity is higher.
These values describe the relationship between calls and puts. They should not be interpreted as fixed bullish or bearish signals.
A PCR above 1, for instance, might signal that there is more demand for downside protection, bearish bets, writing puts or a mix of strategies.
For example, a PCR less than 1 can be the result of buying calls, writing calls, or other options strategies.
Traders need to look at the type of PCR used, expiry chosen, distribution of open interest and the price movement of the underlying index to interpret the ratio.
How to interpret PCR in options trading
PCR becomes more useful when traders observe how it changes alongside other market indicators.
1. A rising PCR
A rising PCR means put activity is increasing in relation to call activity. This may happen as put volume increases, open interest increases, call activity decreases or some combination of these.
It’s the market context that counts. For example, if the Nifty is going up but open interest is building up at selected strikes, traders may explore if put writing is supporting the index.
But PCR alone cannot prove that put writers are to blame for the rise. You need to look at the price action and changes in open interest at each individual strike separately.
2. A falling PCR
A falling PCR means that put activity is falling relative to call activity.
This can mean more call activity, or less put activity. Its significance is a function of what is going on in the underlying market.
For example, if the Nifty is falling and open interest is increasing at higher strikes, traders might see whether fresh call writing is building resistance.
But the ratio cannot tell if the new positions are bearish, hedged or part of a multi-leg strategy.
3. An extremely high or low PCR
Some traders consider PCR a contrarian indicator when the market gets to very high or low readings.
The idea is that crowded positioning might leave the market open to a reversal should conditions change.
For example, a PCR close to the top of its recent range might lead traders to question whether downside expectations are becoming abnormally concentrated. Such a low reading could lead to a look at whether call side positioning has gotten out of hand.
There is no guarantee of a reversal in either case. Traders are advised to compare the reading to historical values for the same index and expiry scope instead of using a universal threshold.
How to use PCR in your trading analysis
PCR works best as part of a larger trading process. These steps can help you interpret it more carefully.
Step 1: Check the relevant option chain
First, you have to select the underlying index or stock you would like to analyse.
Traders can check call and put contracts, open interest and other options data available on the advanced option chain on Dhan.
Ensure that the PCR figure and the underlying option chain are of the same instrument and expiry.
Step 2: Identify whether PCR uses OI or volume
Interpretation should be based on open interest or trading volume, so check the reading.
Volume-based PCR shows trading activity in the selected period, while OI-based PCR helps you analyse outstanding positions.
A comparison of the two could provide some further context. For example, an increase in volume-based PCR might suggest increased put activity during the session, but no change in open positions.
Step 3: Examine changes at individual strike prices
An aggregate PCR does not show the concentration of options positions.
Review put and call open interest at relevant strikes. Also look to see if open interest is increasing or decreasing and if the underlying index is approaching or moving away from those strikes.
This allows you to look at potential support and resistance levels without assuming that a high OI means that a certain price level will hold.
Step 4: Compare PCR with price action and volatility
Check the trend of the underlying index, recent highs and lows, volume and India VIX.
India VIX is a measure of expected volatility in the options market. It can help you understand if a PCR change is happening in fairly stable conditions or in a time of greater uncertainty.
For example, an increasing PCR with falling price and rising volatility is a very different market scenario than an increasing PCR with a steady uptrend.
Step 5: Plan the trade and manage risk
After reviewing the available data, determine whether the trade opportunity fits your strategy.
Before placing an order, set your entry criteria, your exit price and loss tolerance. Also consider the option premium, liquidity and expiry and the effect of time decay.
Dhan offers options trading tools like an advanced option chain and chart-based analysis features that traders can use to review contracts and plan their trades.
There is no indicator that can eliminate market risk. PCR should be a tool to support your analysis, not a replacement for a trading plan.
What are the limitations of PCR?
Although PCR is useful for understanding options activity, it has several limitations.
- It cannot predict market direction on its own: A high or low reading does not guarantee that prices will rise or fall.
- It does not identify the buyer's or seller's intention: Every options contract has a buyer and a seller, and PCR cannot establish which side initiated a trade.
- It depends on the data used: PCR values can differ according to the underlying instrument, selected strikes, expiry dates and calculation method.
- It can change rapidly: Volume-based PCR may fluctuate sharply during volatile sessions and near expiry.
- It does not measure the full risk of a position: PCR does not directly account for option premiums, position size, potential losses or the structure of multi-leg strategies.
Options are complex financial instruments. Traders should be aware of their risks and not decide based on one indicator.
Conclusion
The Put-Call Ratio is a good way to compare put and call activity in the options market. It can help traders learn about positioning, notice changes in sentiment and identify cases that deserve a closer look.
But a PCR reading is only part of the picture. Knowing how it is calculated, a look at strike-level open interest combined with price action and volatility can provide a more balanced view of market conditions.
FAQs
What is a good PCR value in the stock market?
No PCR value is consistently good. A reading above or below 1 simply means that there is more or less put activity than call activity in the chosen data. View the reading in relation to its recent range and the market environment.
Is a high PCR bullish or bearish?
A high PCR means relatively higher put activity/open interest. Its directional reading, however, depends on whether the positions are considered indicative of buying, writing, hedging or other strategies. It should not be assumed to be automatically bullish or bearish.
What does a PCR below 1 mean?
A PCR of less than 1 means call volume/open interest is greater than put volume/open interest, depending on the calculation method. It measures relative activity and does not confirm a bullish trend in the market.
What is the difference between PCR based on OI and volume?
The OI-based PCR compares outstanding put and call contracts, whereas the volume-based PCR compares contracts traded over a given period. The first relates to existing positions and the second to trading activity in that period.
Can PCR predict a market reversal?
No. Some traders look for abnormally high or low PCR readings for potential contrarian plays, but the ratio cannot reliably predict a reversal. You should also look at price action, volatility and changes in open interest at that strike.