Understanding OI Profile on Dhan




Key takeaways:
- The OI profile displays strike-wise open interest directly on the chart alongside price.
- You can identify crucial support and resistance zones based on the OI concentration level.
- You can track changes in positioning over time without switching between tools.
To make this more visual and accessible, we have built ‘OI Profile’, a feature that brings open interest data directly onto the chart. Using it, you can see how positions are distributed across strikes without switching between tools.
What is OI Profile?
OI Profile is a feature on Dhan charts that displays strike-wise Open Interest as a bar graph alongside the price chart. It shows OI data for each option's expiry, using which you see where positions are concentrated.
The bars are in line with the price axis, which makes for easier interpretation of open interest levels with current price movement. The OI data is updated regularly, and you can track changes in positioning as the market moves.
What OI Profile actually solves
Analysing open interest involves going through multiple data points separately. The OI Profile is designed to bring this information into a single view.
Visualising key levels
Identifying support and resistance using OI requires scanning multiple strikes. With OI Profile, you can see areas of high open interest directly on the chart, helping you identify these zones more quickly.
Understanding position build-up
Tracking whether positions are being added or unwound usually involves continuous checking. The OI Profile allows you to view 15-minute build-up and day-wise changes, which provides more clarity on how the positions are evolving.
Connecting OI with price action
Open interest data is usually analysed separately from charts. By overlaying it on the chart, the OI Profile helps you view both together.
How the OI Profile works
The OI Profile functions as an indicator that can be applied directly to your chart. Once enabled, it displays strike-wise open interest alongside price.
To access this feature, follow the steps below:
- Open the instrument you want to analyse on Dhan Charts (tv.dhan.co).
- You can see three horizontal lines like a symbol on the top panel. Once your cursor hovers over it, you can see the tool's name. For this, it will display ‘OI Profile’. Refer to the figure below.
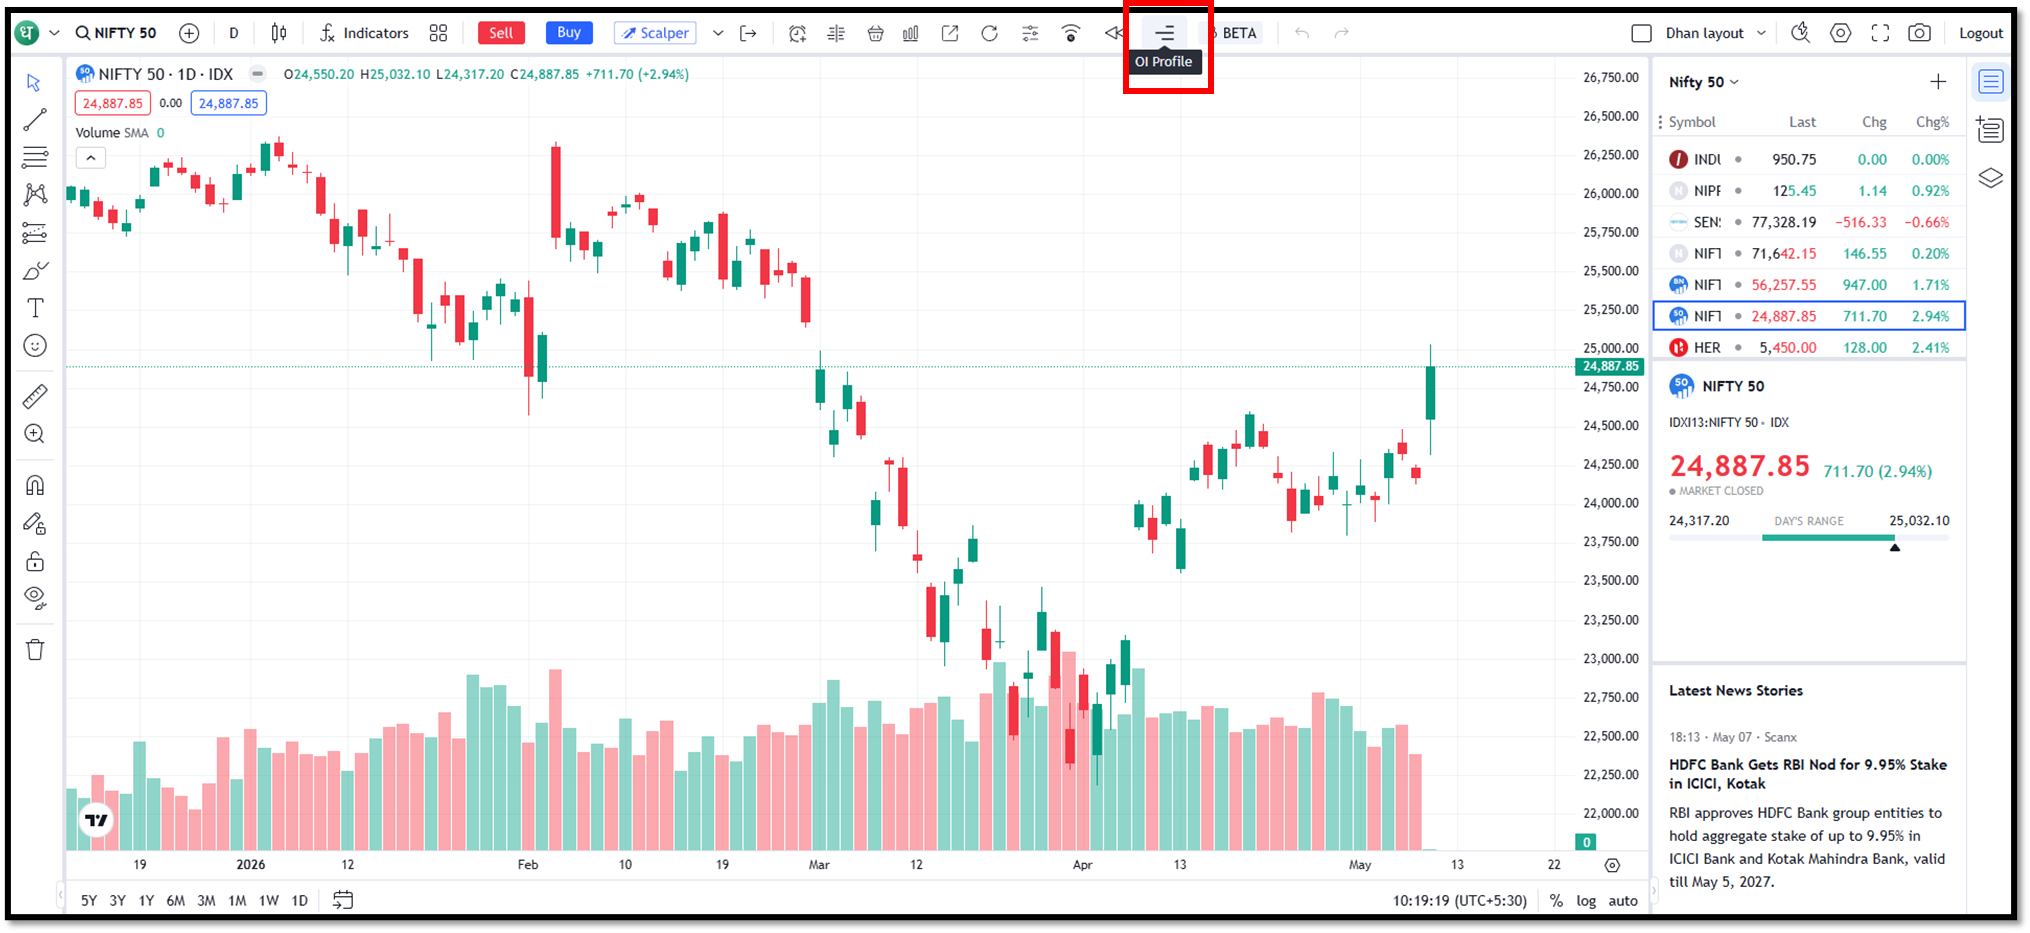
- Click on the ‘OI Profile’ tab. A new tab will open with the same instruments and the OI profile bar charts on the right side.
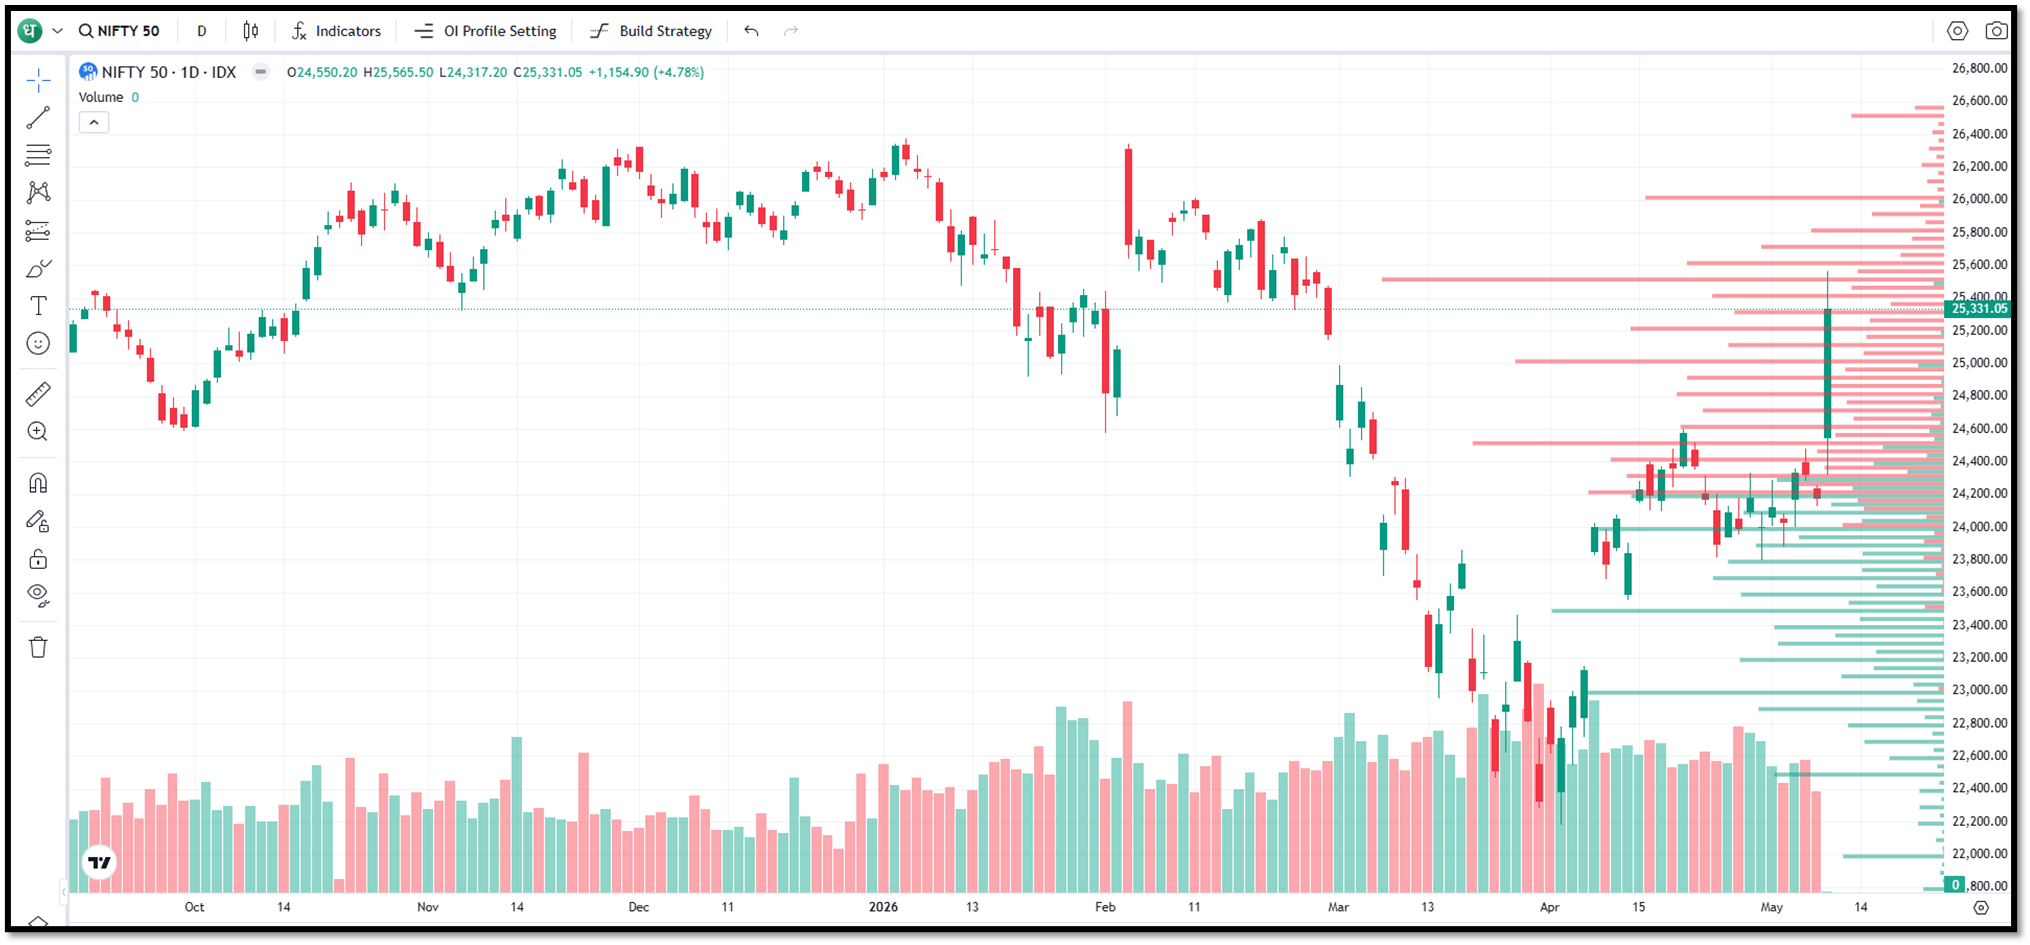
The data refreshes periodically, allowing you to observe how open interest changes in near real time.
Key benefits of OI Profile
The OI profile has the following key benefits.
- Displays strike-wise OI directly on the chart.
- Helps identify key support and resistance zones visually.
- Shows 15-minute and day-wise OI changes.
- Reduces the need to switch between the option chain and charts.
- Allows combining OI data with price action and indicators.
Use cases
Here are the use cases of the OI Profile feature.
Identifying key OI zones
You can use the OI Profile for viewing the concentration of open interest throughout the strike prices. You can use these levels as reference zones for planning an entry or exit.
Tracking changes in positioning
During the trading session, you may want to understand whether positions are being built or reduced at certain strikes. With OI Profile, you can observe these changes over time directly on the chart, without checking data separately.
Conclusion
The OI Profile displays strike-wise open interest on the chart as a visual overlay aligned with price. You can see visually where positions are concentrated and how they change over time, without switching between different tools.
The OI profile reduces the hassle of checking OI data in options chains by displaying it directly on the chart.