Implied Volatility vs. Historical Volatility






Key takeaways
- Historical volatility (HV) measures how much an asset's price has actually fluctuated over a specific period based on past market prices.
- Implied volatility (IV) reflects the volatility level implied by current option prices and represents the market's expectations about future price fluctuations.
- Comparing IV with HV can help options traders understand how current expectations differ from recent realised price movement, but neither measure by itself tells traders whether an option is cheap or expensive.
Volatility is one of the most important concepts in options trading. Two stocks can have similar prices but behave very differently. One may move only slightly from day to day, while another can swing sharply in either direction.
This difference in price movement is where volatility becomes relevant.
Traders generally encounter two types of volatility when analysing options: historical volatility (HV) and implied volatility (IV). Although both describe the degree of price movement, they are calculated differently and answer different questions.
Historical volatility looks backwards. It uses actual historical price movements to estimate how much the underlying asset has fluctuated.
Implied volatility looks forward from the perspective of the options market. It is derived from current option prices and reflects the level of future volatility that is consistent with those prices under an option-pricing model.
What is Historical Volatility?
Historical volatility measures the actual variability of an asset's price over a past period.
It is commonly calculated using historical returns. A trader may use daily closing prices over a particular number of trading sessions and calculate the standard deviation of those returns.
In simple terms, HV answers:
"How much has this asset actually been moving?"
Suppose a stock has moved within a relatively narrow range over the past few weeks. Its historical volatility may be comparatively low. If the same stock has experienced large daily price swings, its historical volatility will generally be higher.
A 10-day HV and a 60-day HV can produce different results as they examine different portions of the asset's price history.
What is Implied Volatility?
Implied volatility is the volatility level implied by the current market price of an option.
Unlike historical volatility, IV is not calculated directly from past price movements. Instead, traders and pricing systems can derive it by taking the observed option price and solving an option-pricing model for the volatility input that would produce that price.
IV answers a different question:
"What level of future volatility is being reflected in the current option price?"
If options are trading at prices consistent with higher expected volatility, their implied volatility will generally be higher. If options are trading at prices consistent with lower expected volatility, IV will generally be lower.
IV is particularly important because option buyers and sellers are trading contracts whose value depends partly on the potential for future price movement.
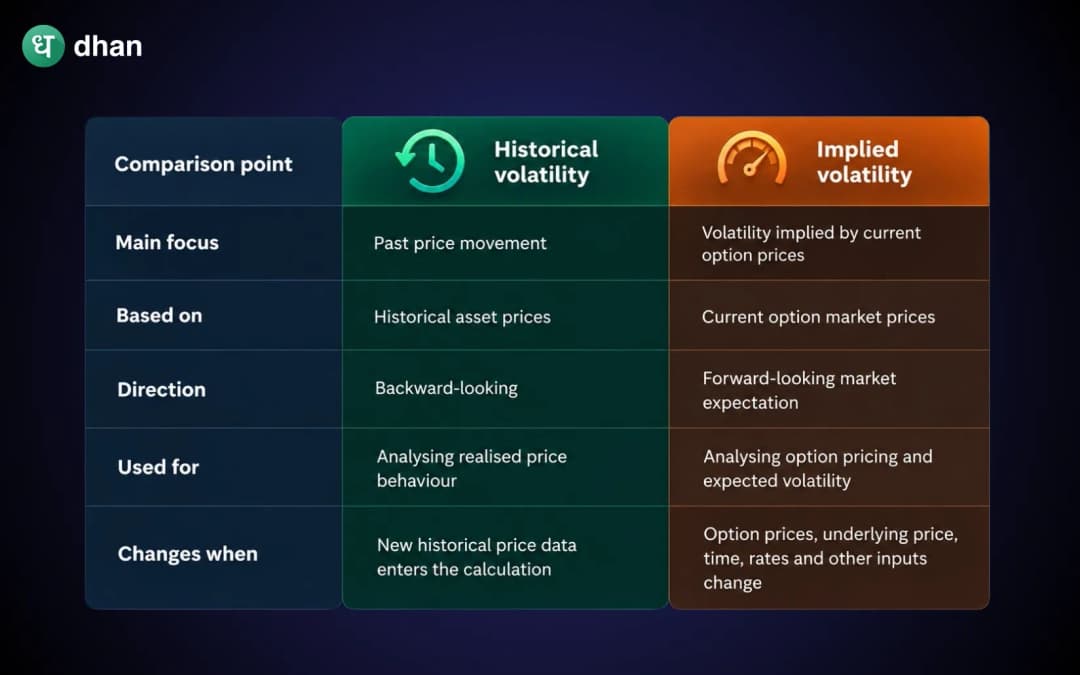
Implied Volatility vs. Historical Volatility
The key differences between implied volatility and historical volatility are given in the table below:
How is Historical Volatility calculated?
The exact calculation can vary depending on the methodology, but the general process involves the following steps.
- Collect the historical prices for a selected period. These prices are then used to calculate returns, such as daily percentage changes.
- The variability of those returns is measured using standard deviation.
For example, a trader who wants to see what the 20 day historical volatility looks like could calculate the daily returns on those 20 observations and use their dispersion to estimate the asset’s realised volatility.
A shorter period can respond more quickly to recent changes in market behaviour, while a longer period incorporates a broader historical sample.
How is Implied Volatility calculated?
For calculating the IV, an option-pricing model takes the following inputs:
- Underlying asset price
- Strike price
- Time to expiry
- Interest rate
- Option type
- Options market price
- Volatility
The market price of the option is observable. Volatility is then solved for within the model to determine the implied volatility consistent with that option price.
This is why IV is called "implied" volatility. It is not directly observed in the same way as the stock price. Instead, it is derived from the option's market price.
Different strikes and expiries can have different IVs. Therefore, traders should not assume that an underlying asset has one universal IV applicable to every option contract.
Why can IV and HV be different?
There is no requirement for implied volatility and historical volatility to be equal.
Imagine a stock that has experienced relatively calm price movement during the previous month. Its historical volatility may remain moderate. However, if the company is scheduled to announce earnings soon, traders may expect a larger price move around the event.
Option prices may therefore reflect higher implied volatility.
The reverse can also happen. Historical volatility may have been elevated because of a sharp market event, while current option prices imply a lower level of future volatility if traders expect conditions to become calmer.
This difference between past realised movement and current implied expectations is one reason traders compare the two measures.
Which one should traders use?
The two measures serve different purposes, so it is more useful to understand them together than to treat one as a replacement for the other. Traders usually assess historical volatility to analyse how the asset has behaved during certain conditions. They may check Implied volatility to analyse what volatility level is reflected in current option prices.
For an options trader, IV is particularly relevant because it directly relates to the pricing of the option contract. HV can provide historical context that helps put the current IV into perspective.
The comparison becomes more useful when combined with the option's strike, expiry, underlying trend, upcoming events and broader market conditions.
Conclusion
Implied volatility and historical volatility both describe volatility, but they look at it from different angles.
Historical volatility is based on actual past price movements. Implied volatility is derived from current option prices and represents the volatility level embedded in those prices.
When IV is significantly higher or lower than HV, it can provide an interesting clue about how current option pricing differs from recent realised movement. But that difference should not be interpreted as an automatic signal that an option is expensive, cheap, or likely to move in a particular direction.
FAQs
What is the main difference between IV and HV?
Historical volatility measures actual past price fluctuations, while implied volatility is derived from current option prices.
Is IV always higher than HV?
No. IV can be higher, lower or similar to historical volatility depending on market conditions, expectations and the period used to calculate HV.
Does low IV mean an option is cheap?
No. Low IV does not automatically mean an option is cheap. The options value depends on several factors, and IV should be considered alongside the contract's other characteristics.
What is IV crush?
IV crush refers to a sharp decline in implied volatility, often after a major anticipated event has passed.
Can IV and HV be used for stock trading?
They can provide context, but they are especially relevant to options. HV can describe the stock's historical price variability, while IV specifically comes from the pricing of its options.