Open Interest Indicator




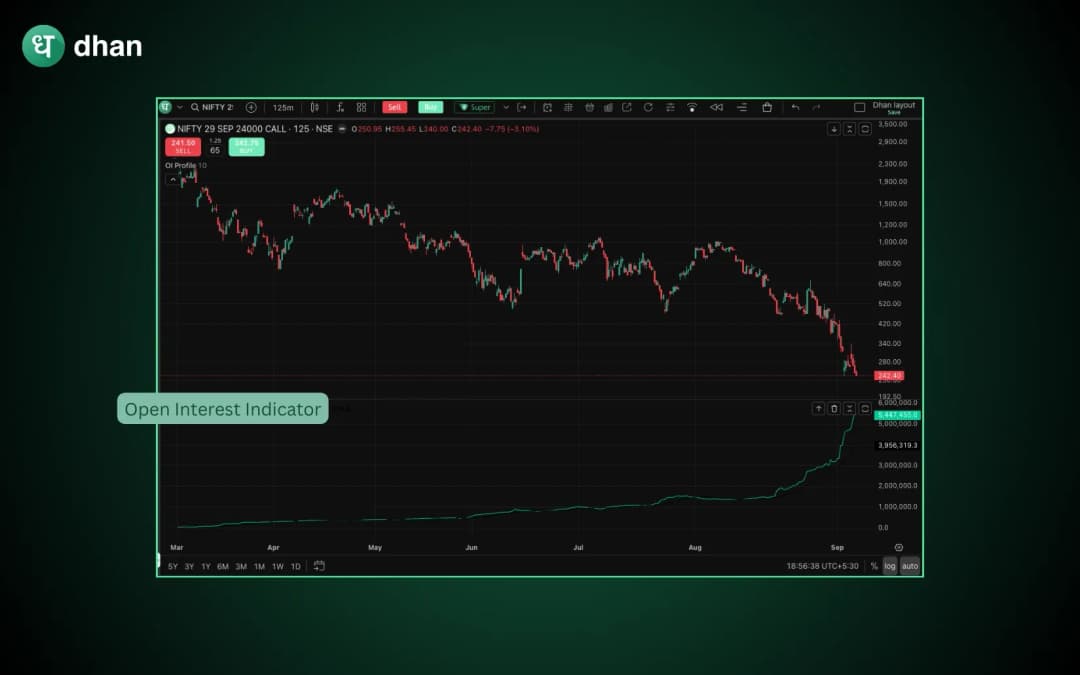


Key takeaways:
- OI represents contract count and not volume, as the volume measure represents the total number of transactions on a given day.
- Price and OI are indicative of the conviction that exists. A rise in price and OI signals that there is actual buying pressure. On the other hand, if the price rises while OI falls, it means that the rise is due to short covering with little supply remaining.
- OI in options helps show the areas of support and resistance, since high call OI creates resistance while high put OI creates support.
- Without considering the price and volume, OI has no meaning.
Veterans on the trading floor would say that 'price tells you what happened, but open interest tells you who's still in the fight'. It's a rather hyperbolic phrase, but there is truth in it. Price charts reveal the trend. Open interest reveals the conviction behind the price movement.
Have you ever looked at an options chain or futures contract and wondered exactly what 'OI' means? There's nothing unusual in this. Most retail traders overlook it in favour of pure price action, thus overlooking one of the most reliable tools that could give them an idea of whether the move in question has some kind of support or not.
This article will explain to you the nature of open interest, how it is calculated, and how you could apply it in your trades.
What is open interest?
The open interest indicator, or OI, is the amount of outstanding futures and options contracts that haven't yet been settled or exercised. It reflects the number of open positions on the market, and not the trading volume.
It could be visualised as a running total of open commitments. With each new buyer and new seller of the contract, OI increases by one. With each settled position, OI decreases by one. If a buyer simply transfers his position to another new buyer, OI remains the same.
This is where beginners usually make a mistake, so let’s reiterate: OI measures open positions, not activity.
Difference between OI and trading volume
Volume and OI are often considered the same thing. However, there are two separate metrics here that answer two different questions. Volume shows the number of contracts that were traded within one trading session. OI shows the number of contracts left by the end of the session.
A stock could have a huge trading volume but very little change in OI. It means that there are many open and closed positions within the same trading session without any change in the number of positions. Conversely, if OI increases with the simultaneous volume increase, it means that fresh money goes into the market.
Both numbers are meaningless by themselves. The interaction of OI, volume, and price reveals the full picture.
Calculation of open interest
The exchange calculates the OI by netting the newly created positions and the closed ones. Let's take ABC Ltd futures, for example. Let's assume that ABC Ltd futures begin the day with OI of 10,000 contracts.
During the day, 2,000 new contracts are opened (a new buyer and a new seller), and 500 existing positions are closed. As a result, by the end of the day, OI will be equal to 11,500 contracts. The number changes daily, and the OI is published after every trading session.
In case of options, the OI is calculated separately for every strike and every expiry date, for both calls and puts. It allows us to create the strike-wise OI charts in such tools as Option's Trader options chain.
Four combinations of price and OI every trader should know
Here we see the real value of open interest. OI itself is just a number, but the combination of price movement and OI gives us the signal whether the trend has fuel or not.
Let's assume that ABC Ltd futures are trading at the price of ₹500. An increase in price, along with an increase in OI, usually reflects a long position build-up new buyers are entering the market with conviction, and this rally has backing.
Conversely, if the price rises but the OI drops, it is a short-covering those who bet against the stock are leaving the market, pushing the price upwards, but there are no new buyers in play.
The reverse situation is important as well. If the price falls and OI increases, it is the short position build-up new sellers are entering the market, predicting the price fall, and this move is backed. If the price falls and OI drops it is long unwinding the exiting of the existing buyers of the position.
Of course, none of these four combinations guarantees future moves. However, they give us the signal whether the crowd is getting bigger or smaller behind a move, and this is far more valuable information than the price candle only.
Options OI: Calls, puts, and PCR
In the options market, OI becomes especially interesting because it is calculated separately for every strike. High call OI at a specific strike means that many traders expect the price to remain under that strike since call writers profit when the option expires worthless. Heavy put OI means the opposite traders don't expect the price to fall under that strike.
This is where the PCR comes into play. Put-Call Ratio, or PCR, is a simple ratio of total put OI to total call OI for a given expiry date. A PCR higher than 1 is generally seen as bullish sentiment since there are more puts being written than calls. A PCR significantly lower than 1 means the opposite. The PCR is rarely used as a standalone indicator, but it gives a quick sentiment reading.
Applying OI to the support and resistance identification
One of the practical uses of options OI is the identification of the support and resistance zones before expiry. The strikes with the highest call OI tend to become the resistance points because call writers try to keep the price below that strike. And conversely, strikes with the highest put OI tend to become the support points.
This is not a fixed rule some important news event or excessive positioning could break through these levels easily. However, observing the build-up and unwind of the OI at specific strikes while approaching the expiry date gives traders the map of the zones that are likely to attract the price.
Where can you view open interest in India?
The National Stock Exchange releases open interest data for all futures and options contracts on a daily basis on its website, divided into symbol, strike, and expiry. The Multi Commodity Exchange also shares open interest details for derivatives on commodities such as gold and silver contracts.
Most online trading platforms also provide open interest data directly from the option chain itself, which is a lot more user-friendly than downloading reports every day.
In Options Trader's option chain, for example, open interest is provided in real-time along with price, change in OI, and Implied Volatility at each strike, allowing you to look for buildup patterns without having to switch between multiple tabs.
Common mistakes traders make while using open interest indicator
One common mistake that new traders make with open interest is taking a high open interest at a certain strike as an automatic ceiling/floor for price. This is not how open interest works open interest shows positioning but not a price guarantee.
Another common mistake with open interest is interpreting open interest changes in isolation and without considering price movement. Change in OI without knowing if it was accompanied by price movement is meaningless OI is a useful indicator only in conjunction with price.
Some traders also get confused between total open interest and the daily change in OI. Total OI is the position at a certain strike. Daily change in OI refers to the positions opened/closed that day. Both OI figures are meaningful, but in completely different ways.
Limitations of open interest as an individual indicator
Open interest acts as a confirming tool rather than a single indicator on which you can base your trades. Open interest does not show any direction on its own, and it does not reveal the reason why traders have taken those positions.
OI is also a lagging figure in the sense that it refers to positions that have already been taken, not ones that will be taken going forward. Combining OI with price, volume, and market context usually gives a better picture than relying on OI alone.
Conclusion
Open interest is the measurement of the number of live positions in the market, and when combined with price action, it indicates whether a price movement has conviction behind it or is likely to fail.
When used correctly, OI helps traders filter out noise and find real trends, find potential support and resistance levels using options, and avoid being trapped in a crowded trade. Open interest is a great tool, just like any other, when used as part of a larger toolkit rather than a single signal.
FAQs
1. What does high open interest indicate in trading?
It means that there are large positions taken at a particular strike or expiry that have not been settled yet. Generally, high OI suggests that there is strong positioning at a certain level but does not indicate direction.
2. Is high open interest bullish or bearish?
Neither on its own. High OI can be bullish if accompanied by rising price and bearish if accompanied by falling price.
3. What is the difference between open interest and volume?
While volume is the number of contracts traded during a period, open interest is the number of contracts that are open and have not been closed during the period. High volume with flat OI generally means that positions are being closed, not opened.
4. What is the use of open interest in options trading?
In the case of options, open interest is recorded separately for each strike and expiry. The strike-wise open interest is used to measure possible support/resistance levels and the Put/Call Ratio, a simple measure of market sentiment.
5. Does open interest change every day?
Yes. Open interest gets calculated afresh after each trading session, where new contracts get added while old ones are either closed or exercised.