



ADX Indicator







The average Directional Index (ADX) was developed by J. Welles Wilder Jr. to determine the trend strength. The ADX indicator is widely used across stocks, commodities, and forex markets. In this article, we will try to understand what the ADX indicator is, how it is calculated, and how you can use it during actual trading.
What is the ADX indicator?
The ADX indicator is a trend strength indicator that measures how strong a trend is, regardless of its direction. It does not focus on the market direction but on the intensity of the trend. The indicators range from 0 to 100, with a reading above 25 indicating a strong trend.
There are two additional lines, +DI (positive directional indicator) and –DI (negative directional indicator), that can be plotted to enhance the analysis.
The indicator's graph is plotted on the same screen. You can also see two additional lines, the DMI (Directional Momentum Indicator), positive and negative, from which the ADX line is calculated. (See the figure below)
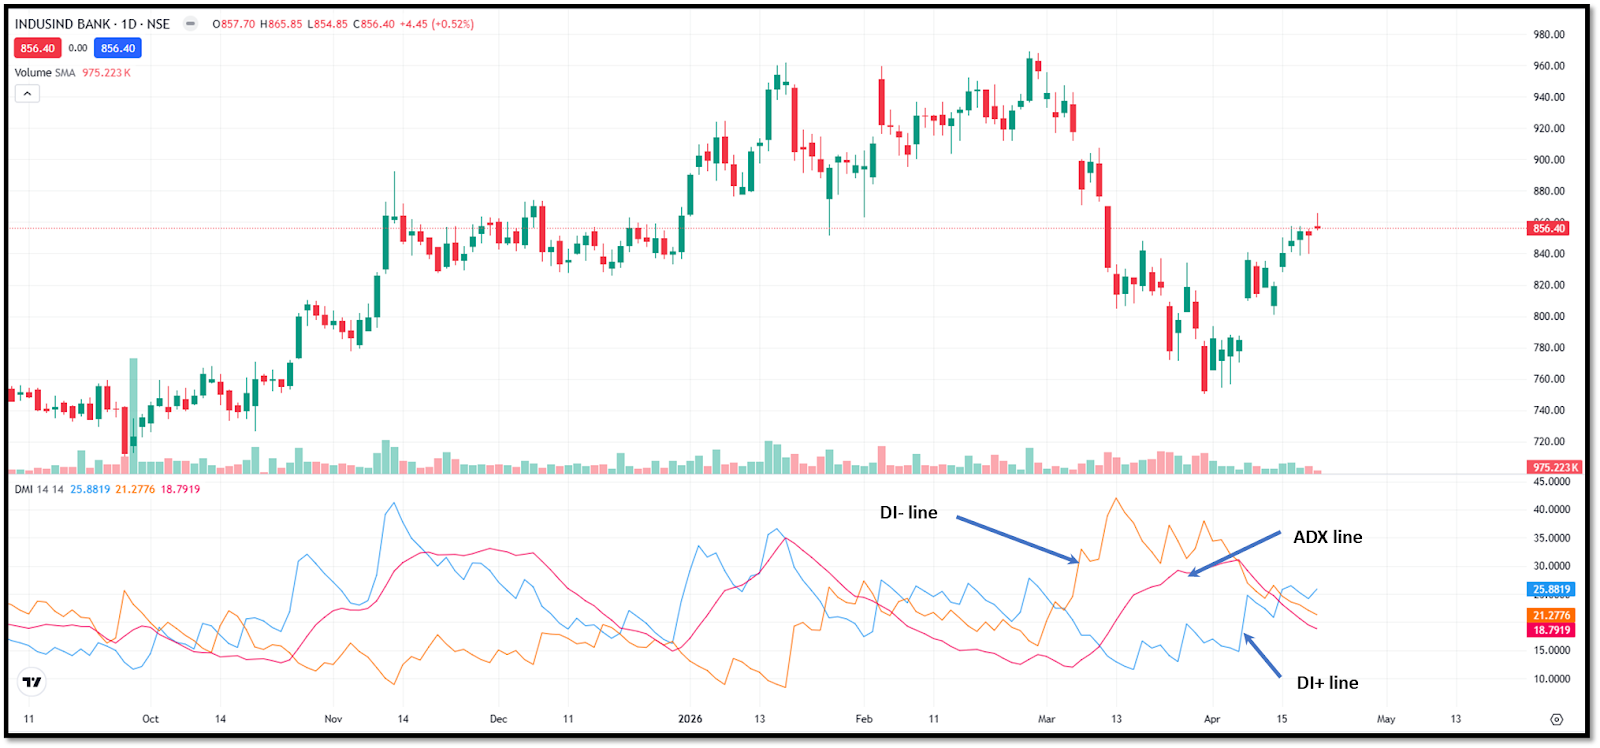
Sometimes, you will only see the ADX line plotted on the graph. To see the DMI lines with ADX, you can switch to the DMI indicator, where you can see all three lines plotted on the same graph.
Components of the ADX indicator
There are three components of the ADX indicator, as explained below:
ADX line
The ADX line represents the strength of the trend. It moves between 0 and 100. A rising ADX indicates that the trend is gaining strength, while a falling ADX signals weakening momentum.
Positive directional indicator (+di)
The +DI line measures upward movement in price. When this line is above the –DI line, it indicates bullish strength in the market.
Negative directional indicator (–di)
The –DI line measures downward movement. When it is above the +DI line, bearish pressure is dominant.
How the ADX indicator is calculated
Understanding the calculation of ADX is important for trusting the signals and knowing the logic behind it. The section below gives you the step-by-step calculations for ADX.
For calculating ADX, it needs three elements:
- True Range (TR)
- Directional Movement (+DM and –DM)
- Smoothed averages
Let's calculate each step by step.
Calculating True Range (TR)
The true range measures the volatility. True range not only considers the high and low of the candle but also considers the gaps as well.
True range is the maximum of the following values:
(High - Low) , (High - Previous close), (Low - previous close)
This ensures that sudden price jumps are included in volatility measurement.
Calculate directional movement (+DM and –DM)
Directional Movement determines whether the price is moving upward or downward.
+DM = Hightoday-HighPrevious
-DM = LowPrevious-LowToday
Now, you need to apply the logic to the above values:
If
+DM > -DM , then keep +DM and set -DM = 0
Similarly, if
+DM < -DM , then keep -DM and set +DM = 0
This is for considering only one directional movement.
Smooth the values
To reduce noise, these raw values are smoothed. Smoothed values are calculated over a standard period (usually 14).
Calculate directional indicators (+DI and –DI)
The smoothed DM values are converted into percentage form using below formula:
+DI = Smoothed +DMSmothed TR100
-DI = Smoothed -DMSmothed TR100
The calculated values are then plotted over the chart as +DI and -DI.
Calculate DX (Directional Index)
The Directional Index (DX) measures the difference between +DI and –DI. It represents the trend strength at a specific point.
DX = (+DI) - (-DI)(+DI) + (-DI) 100
Calculate ADX
The ADX is nothing but the average of the DX over a specific period (usually 14). The following formula is used for calculating ADX:
ADX = 1nDX
Where n is the number of periods.
In real trading, you don’t need to calculate ADX manually. Modern platforms like Dhan do the calculation in the background and plot the graph instantly.
Interpreting ADX values
ADX represents the strength behind the trend. Understanding the levels of ADX will help you make better trading decisions.
- Below 20: It indicates a weak or sideways market.
- 20 to 25: It suggests a potential trend is forming.
- 25 to 50: Represents a strong trend.
- Above 50: Indicates a very strong trend.
- Above 75: ADX rarely touches this line, but if it goes above, it may signal an overextended trend.
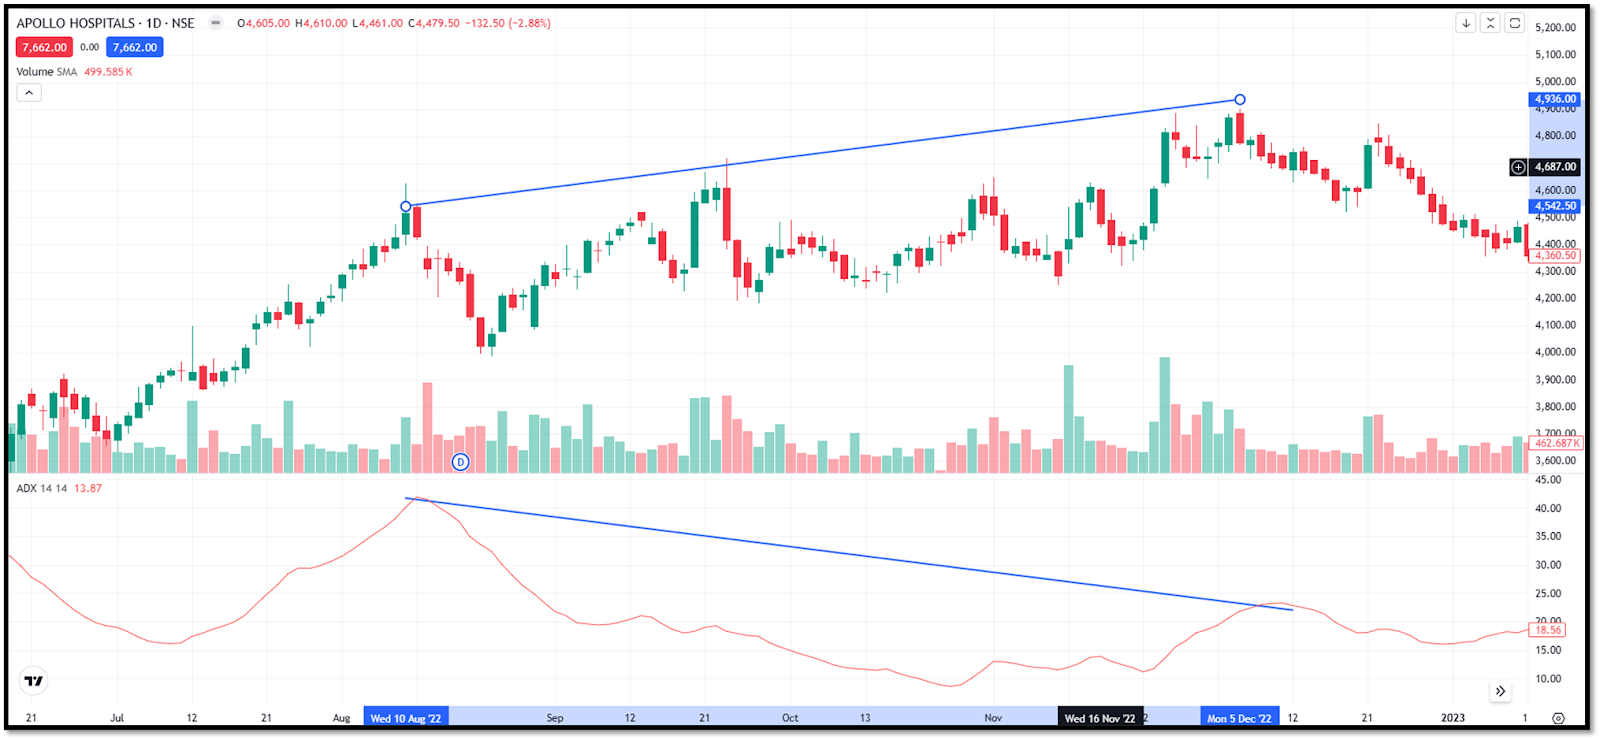
In the figure below, you can see a clear decline in the ADX value, indicating the trend is losing momentum, but the price can still rise as the uptrend remains intact.
ADX vs directional movement
ADX is calculated based on the Direction indicator (DI) lines, but it does not indicate the price direction. DI lines help identify the direction of the trend.
When +DI crosses above –DI, it signals a potential bullish trend. When –DI crosses above +DI, it indicates a bearish trend. If ADX is rising during these crossovers, the signal becomes stronger and more reliable.
How to use the ADX indicator in trading
You can draw multiple interpretations from ADX. Key interpretations of ADX are given below:
Identifying trending vs sideways markets
ADX can tell you the current market condition. If the ADX value is below 20, then the market is considered to be sideways. While the ADX value is above 25, it indicates a strong trend. So it will help you choose the strategies.
Confirming trend strength
Traders can confirm the strength behind a breakout or a trend using ADX. If a stock breaks resistance and ADX is rising above 25, it increases the probability of a successful move.
Entry strategy using ADX
Traders use DI crossover and ADX combined for entering the trade. Traders may enter a long position when +DI crosses above –DI when ADX is above 25. Similarly, a short position can be considered when –DI crosses above +DI with rising ADX.
Exit strategy using ADX
Using ADX, you can also exit trades. If ADX starts falling after a strong move, it may indicate that the trend is losing momentum. Traders can use this signal to lock in profits.
Advantages of the ADX indicator
ADX indicator offers several benefits. Some key benefits are listed below:
- ADX helps filter out weak trends and avoid unnecessary trades in sideways markets.
- It can be used across different asset classes and timeframes, making it versatile.
- It works well when combined with other indicators, improving overall trading accuracy.
Limitations of the ADX indicator
Despite its usefulness, ADX has certain limitations.
- ADX is a lagging indicator, meaning it reacts to price movements rather than predicting them.
- It does not indicate trend direction on its own, which can confuse beginners.
- In choppy markets, it may generate misleading signals.
Conclusion
The ADX is one of the most widely used indicators across different markets. ADX is used to determine the strength behind the price move. Although it does not tell the price direction, when used in combination with Direction Index (+DI and -DI), it can generate meaningful signals with price direction.
Traders also use ADX to avoid weak markets and confirm breakouts. But ADX should not be used in isolation. Combining ADX with other indicators and proper risk management is essential for consistent results.
FAQs
How to determine whether the trend is strong or not using ADX?
If the ADX value is above 25, then it is considered that the price has good strength. While values below 20 indicate weak or sideways markets.
Does ADX show trend direction?
No. ADX does not show trend direction, but you can use +DI and -DI crossover to determine the overall trend direction.
Is ADX suitable for intraday trading?
Yes, ADX can be used in intraday trading, but signals may be less reliable compared to higher timeframes.
What is the best setting for ADX?
The default period of 14 is commonly used and works well for most trading styles.
Can ADX be used alone?
It is not recommended to use ADX alone. It works best when combined with other indicators like RSI or moving averages.







