Loading...
Scanning the Markets...
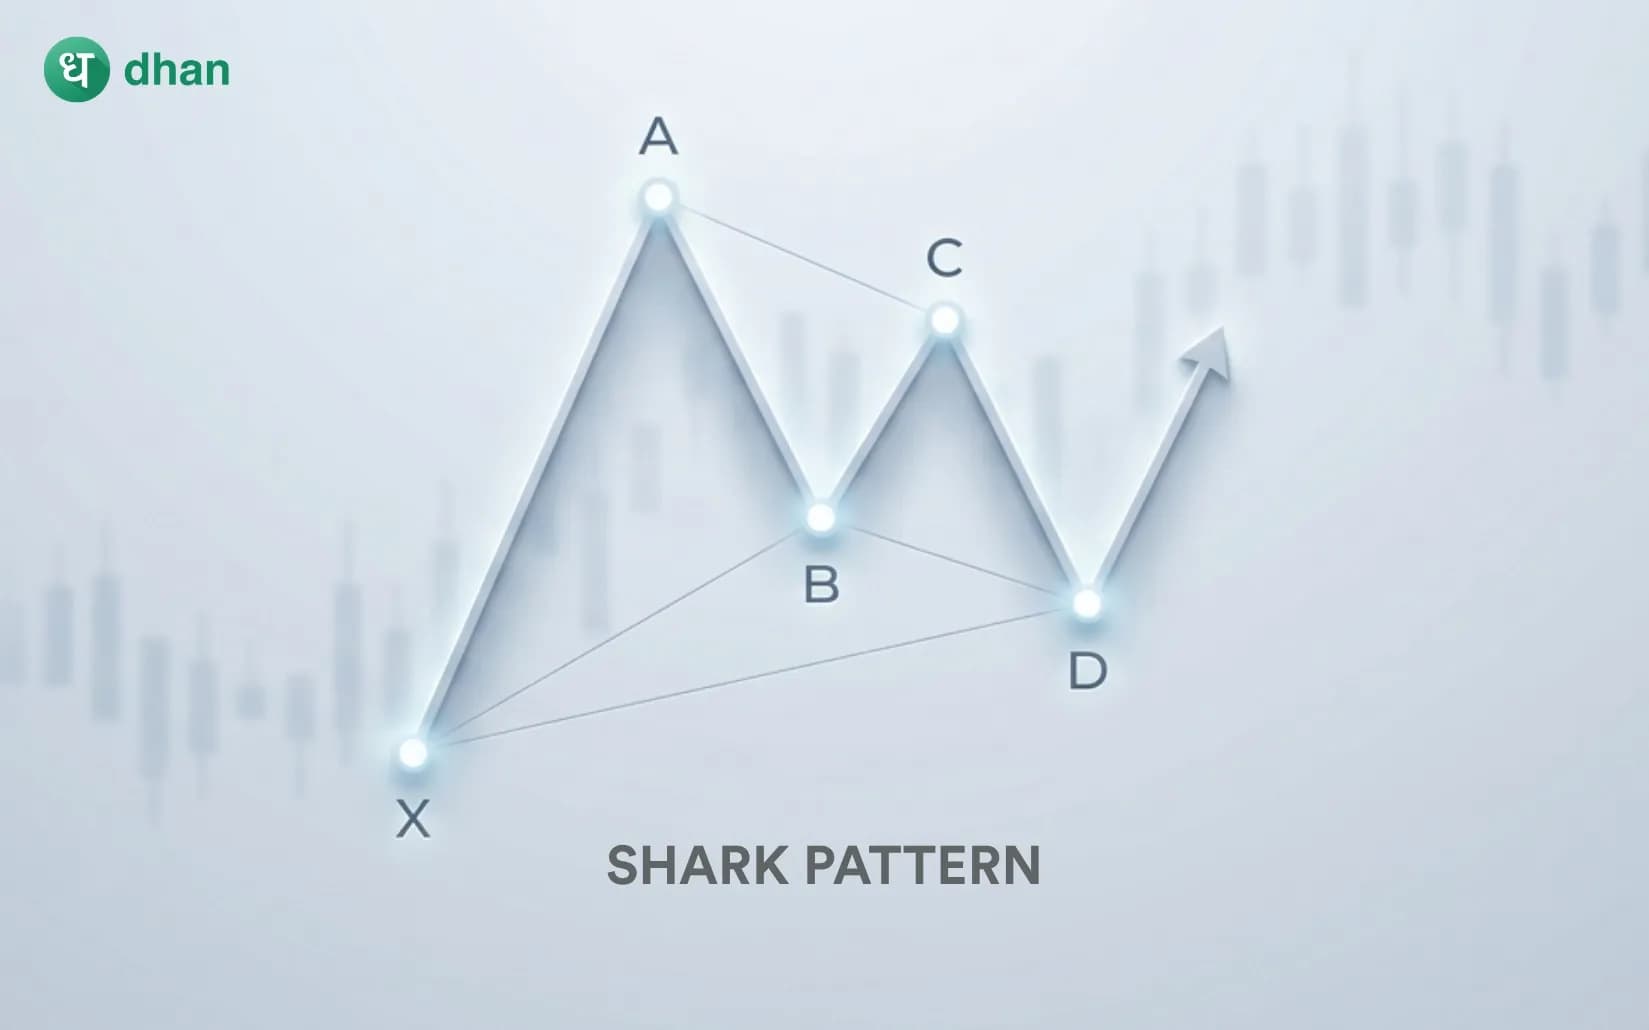
The Shark Pattern is a harmonic reversal chart pattern that signals potential bullish and bearish trend reversals.
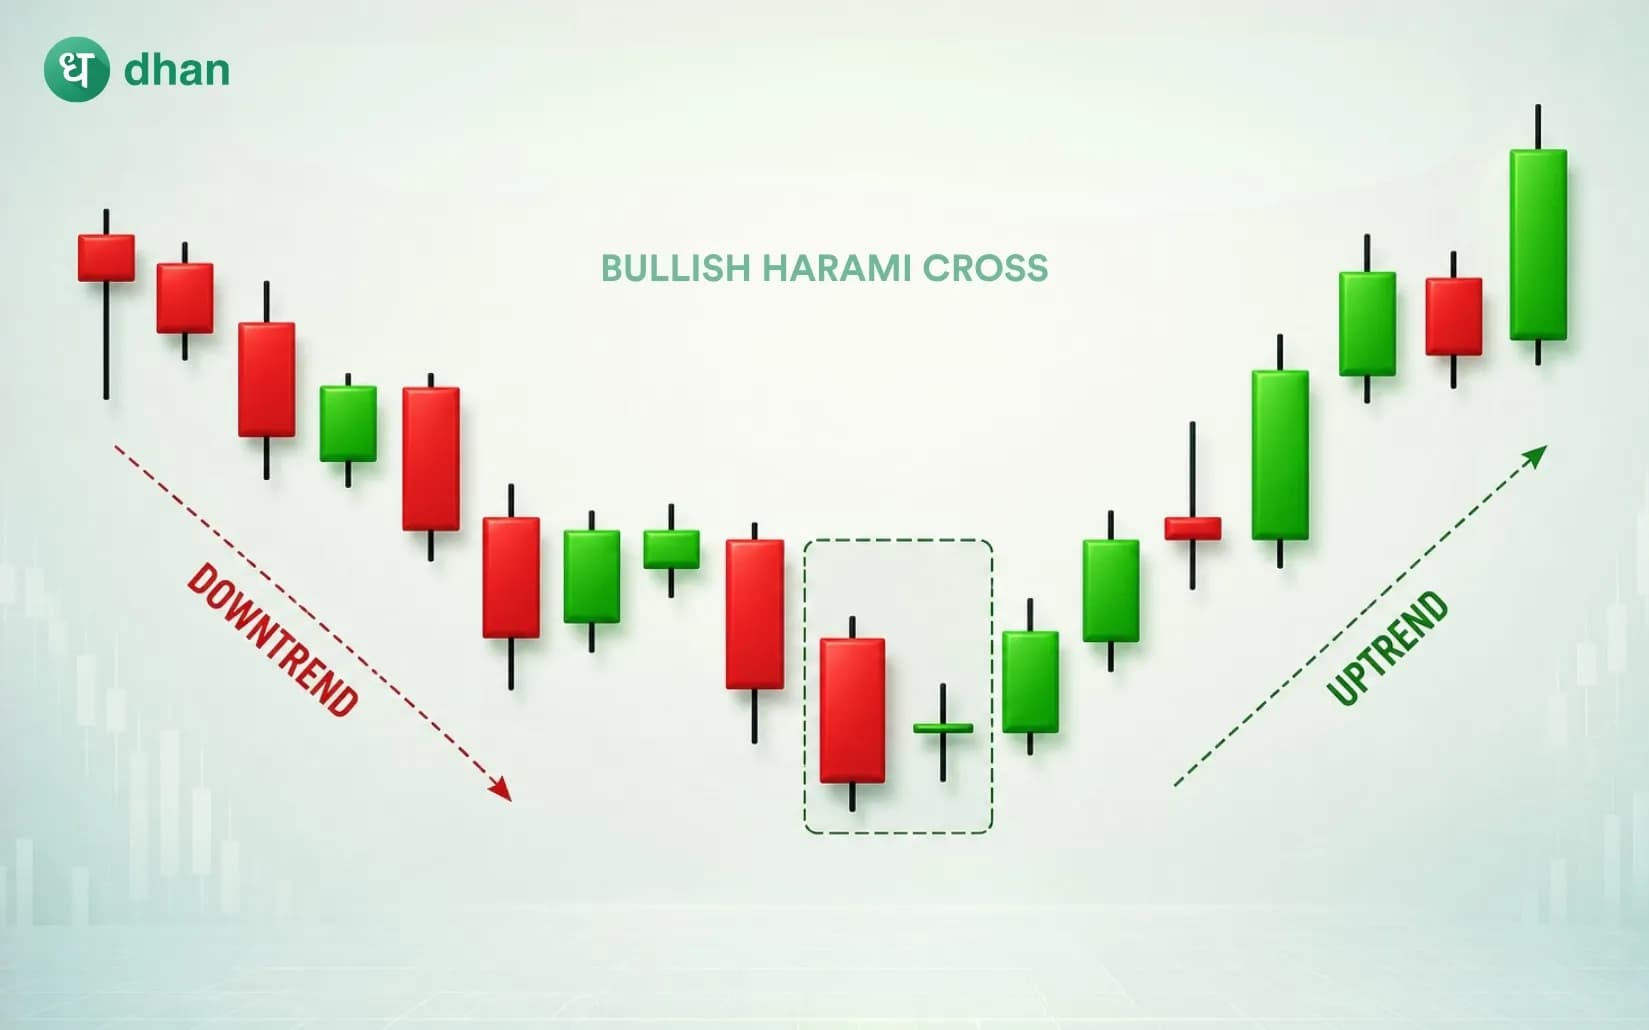
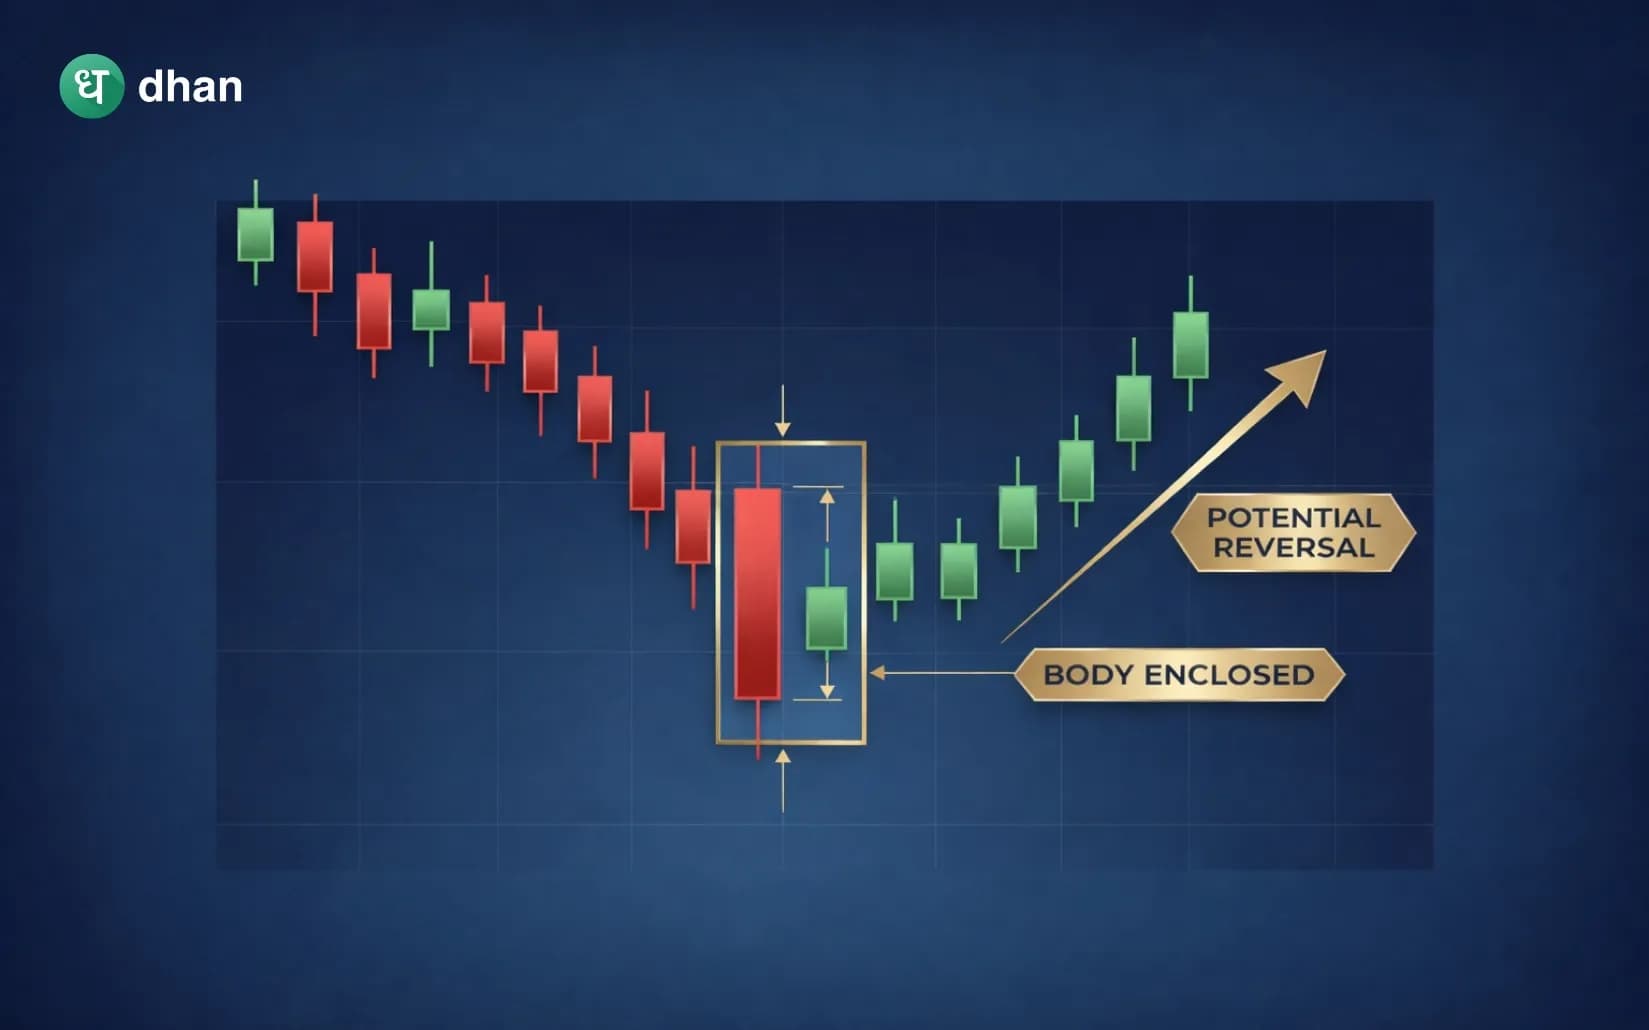
The Bullish Harami Cross is a bullish reversal candlestick pattern that appears after a sustained downtrend.