Bull Flag Pattern








Key takeaways
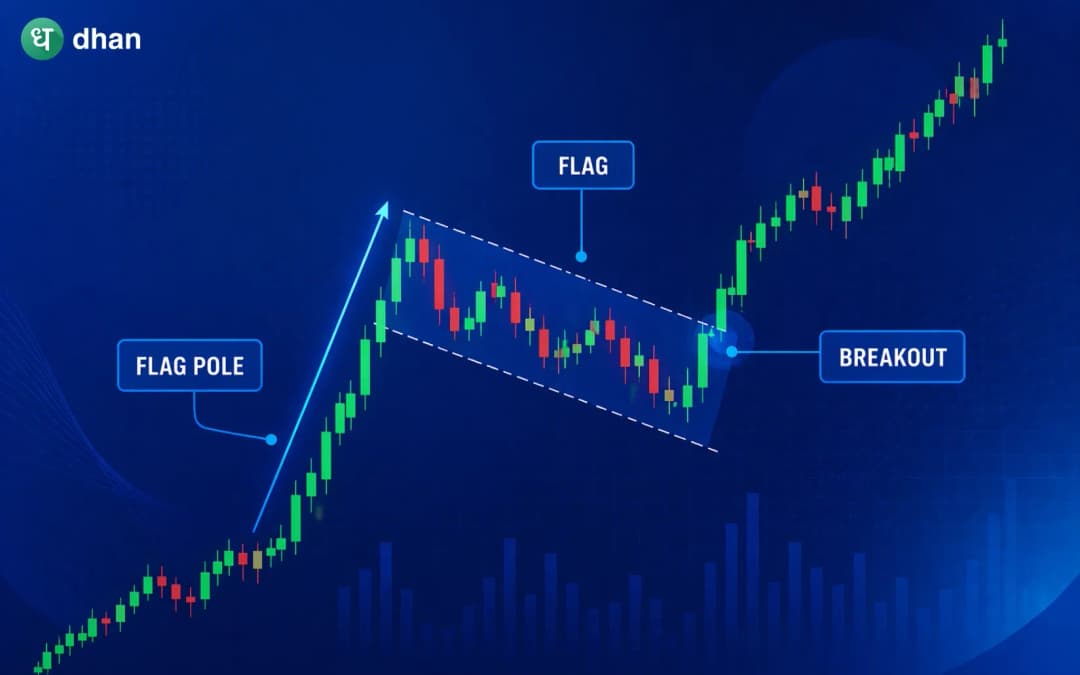
- The bull flag pattern is a bullish continuation chart pattern that forms after a strong upward price move.
- The structure of it is a sharp rally (flagpole) followed by a temporary consolidation sloping slightly downwards or sideways (flag).
- Traders usually use this pattern to identify possible breakout continuation opportunities.
- Volume behaviour can improve pattern interpretation, especially when volume rises during breakout confirmation.
Some chart patterns signal possible reversals. Others suggest the existing trend may simply be pausing before continuing. The bull flag belongs to the second category.
It is one of the more commonly discussed continuation patterns in technical analysis because its structure reflects strong buying momentum, temporary profit booking, consolidation, and then a potential continuation if buyers regain control.
The pattern is pretty easy to visualise for beginners. But that does not mean an easy execution. Many setups that look like bull flags fail because traders identify them too early, ignore context or enter positions before confirmation.
Understanding how the pattern forms, what it reflects psychologically, and how traders typically approach it can make a major difference.
What is a bull flag pattern?
A bull flag is a bullish continuation chart pattern that appears after a strong upward price movement.
It generally forms in two parts:
- A sharp upward move called the flagpole
- A short consolidation channel called the flag
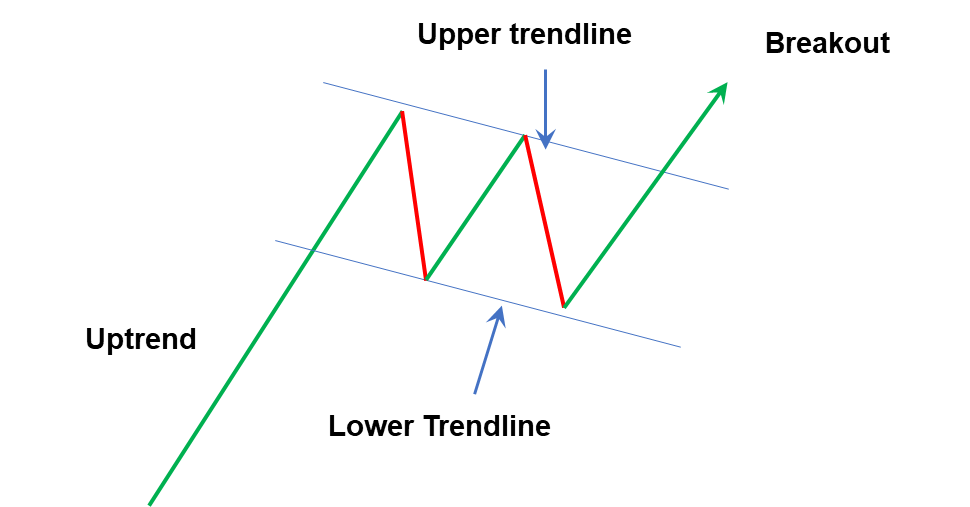
The consolidation phase usually slopes slightly downward or moves sideways against the prior uptrend. If price breaks above the upper boundary of the flag, traders may interpret that as a continuation signal. The key idea behind the pattern is simple:
The market rallies strongly, pauses temporarily, and may continue higher if bullish momentum returns.
Structure of the bull flag pattern
To identify the pattern, understanding its structure is crucial. The structure of the bull flag pole is given below:
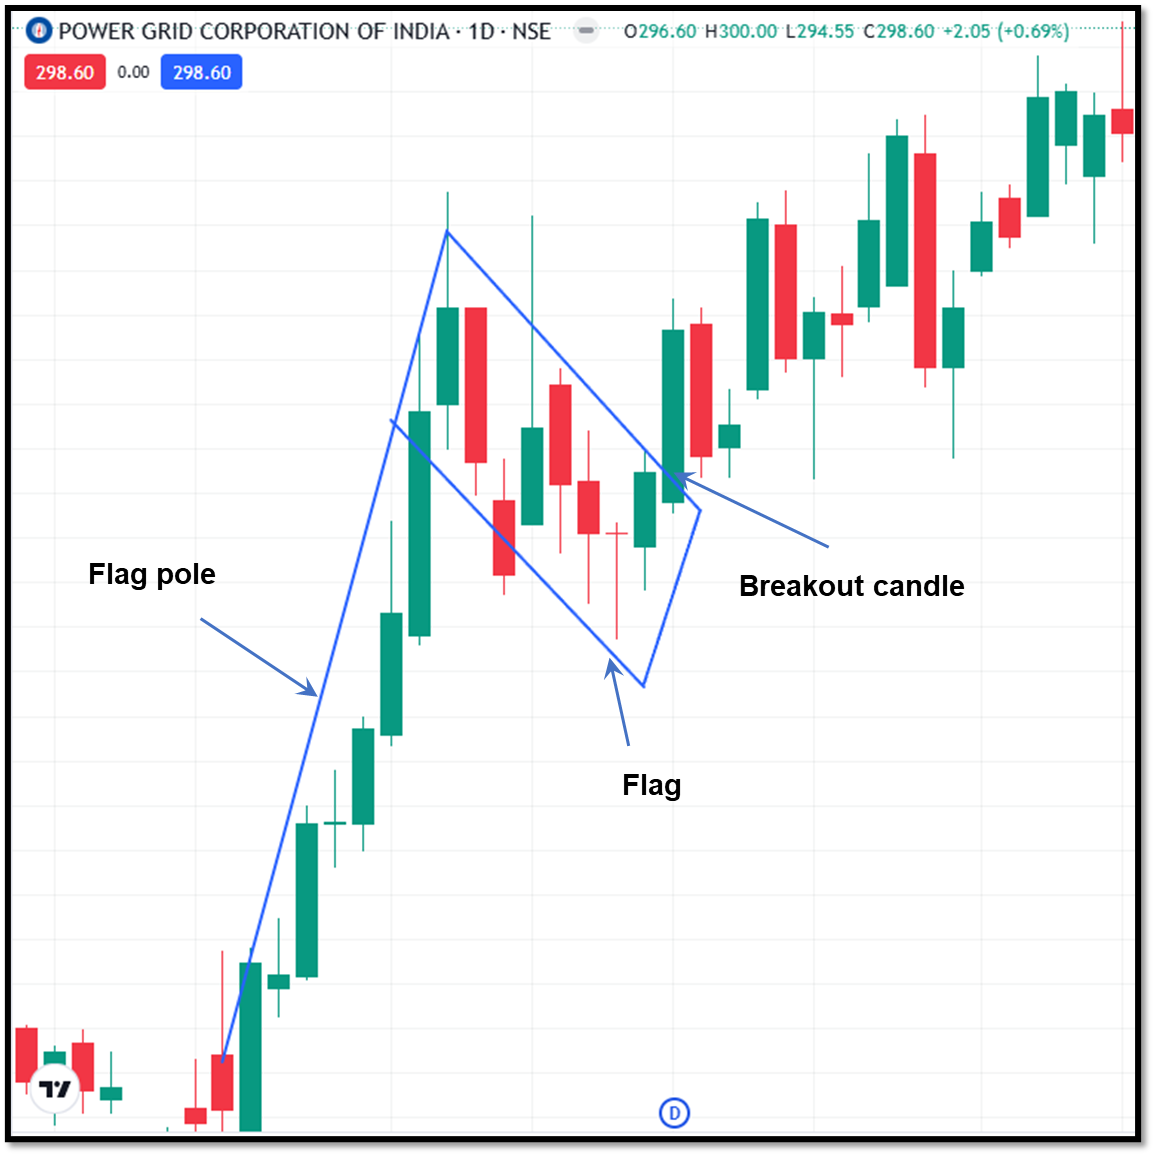
Flagpole
The flagpole is the first stage. This is a strong bullish move with clear momentum. The flagpole has the following characteristics:
- Large bullish candles
- Strong price acceleration
- Breakout movement
- Increased market participation
If the pole is not that strong, then the reliability of the pattern decreases.
Flag
After the strong rally, the price starts to move downwards or sideways. This creates the flag. The following characteristics are seen in the flag:
- Mild downward slope
- Sideways consolidation
- Smaller candles
- Reduced momentum
This phase usually represents a temporary pause before continuing in the upward direction. But the flag should remain relatively controlled. A steep decline can weaken the setup.
Breakout
If price moves above the upper boundary of the flag with confirmation, this is usually considered as traders may interpret that as continuation. This is the trigger many traders monitor.
Market psychology behind the bull flag
Just like the structure, the psychology behind the bull flag is also important.
During the formation of a flagpole, buyers are very aggressive, pushing the prices higher and higher. This might be due to breakout momentum, positive news, or strong bullish sentiments. During this phase, the demand overwhelms the supply.
Some traders start to book a profit after a sharp move. Therefore, buyers are reluctant to go higher. This period is characterised by a consolidation phase where neither the buyers nor the sellers are clearly dominating.
If the buyer returns with aggression and pushes the prices above resistance, then the continuation becomes possible. This suggests the pause was temporary rather than a reversal.
How to identify a bull flag pattern
The bull flag pattern shows certain characteristics during formation through which you can identify the pattern.
Prior uptrend
A bull flag is a bullish continuation pattern. It needs bullish momentum first. Hence, while identifying the pattern, look for:
- Sharp upward movement
- Strong breakout behavior
- Clear momentum candles
If the pattern appears without a strong bullish move, then the pattern is weak.
Controlled consolidation
The consolidation phase must be in a controlled manner. It should not be too sharp. The pause should be orderly. The consolidation phase has a slight downward slope or sideways movement. It forms smaller candles with lower volatility.
Messy or erratic price action reduces reliability.
Draw trendlines around the flag
During the consolidation, the price moves in a channel. Draw the lines connecting the upper resistance and lower supports. It helps define the breakout structure.
Wait for breakout confirmation
Sometimes false breakouts happen. A valid setup usually breaks above the upper trendline with a strong bullish candle. Also, you can see a volume increase.
How traders use the bull flag pattern
Traders use different approaches to trade using the bull flag pattern.
Entry
There are three entry points which traders consider.
- Breakout entry - In this approach, traders wait for the breakout and enter once confirmed. It gives confirmation for the move, hence it is less risky than aggressive entries.
- Pullback entry - traders wait for the pullback after the breakout and enter at the retest level. This approach offers a better risk-reward structure. But you may lose the opportunity if the retest doesn't happen.
- Aggressive early entry - In this approach, the traders enter near support within the flag. It carries a very high risk but also has higher reward potential.
Exit
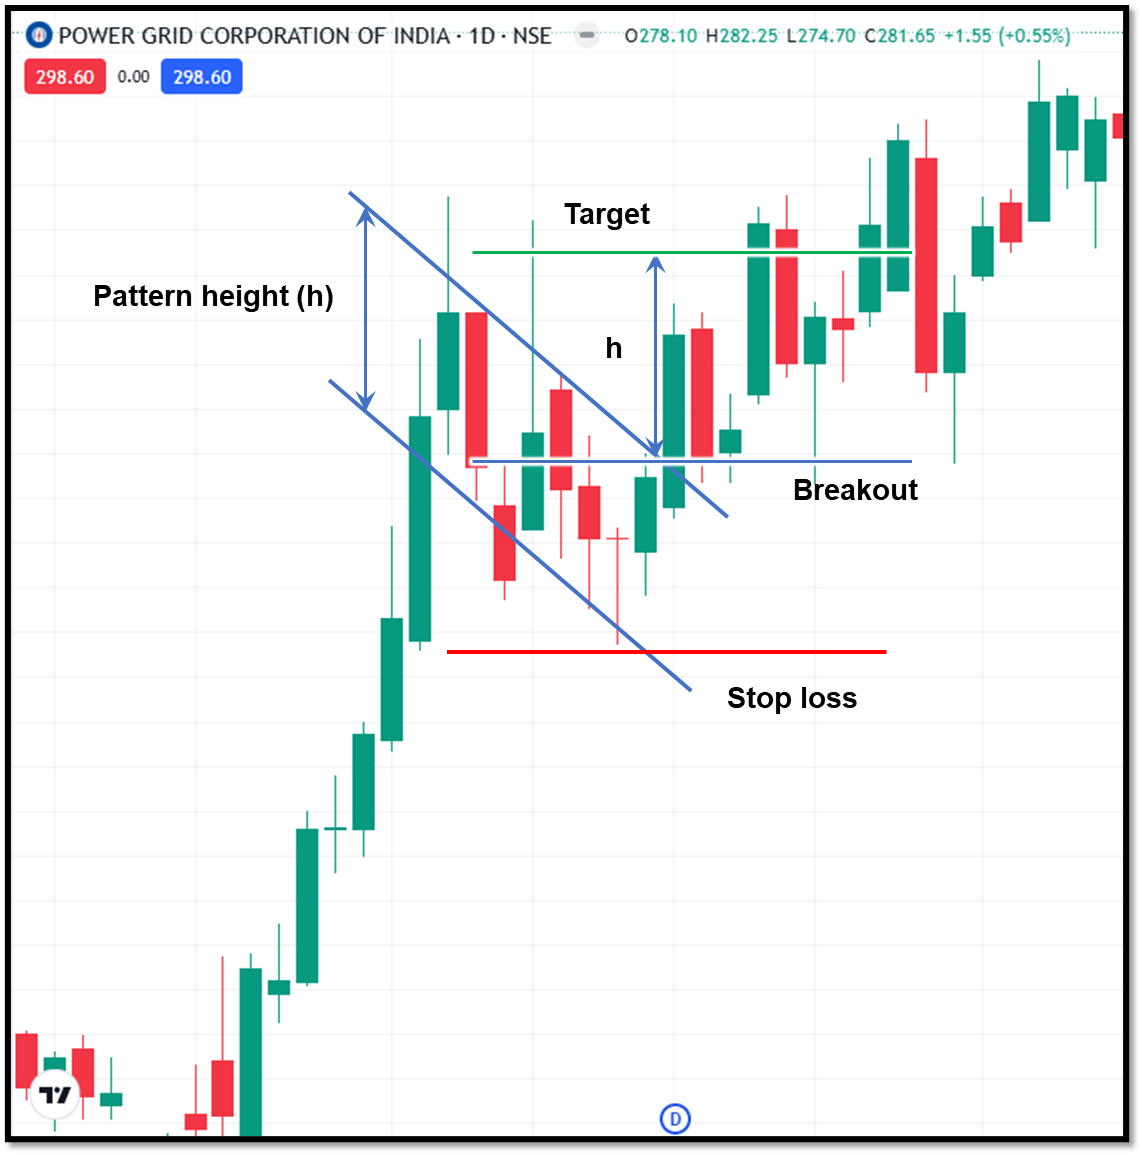
For target selection, traders use two common methods.
- Pattern projection - Measure the flagpole height and project it above the breakout level.
- Nearby resistance - Use the nearby resistance levels for setting the target.
Stoploss
Traders set the stop loss below the flag's lowest point. Choose the stop-loss level based on market volatility.
Advantages of the bull flag pattern
The bull flag pattern is one of the most trusted chart patterns. It has the following advantages:
- The pattern is relatively easy to identify once understood. Its flagpole-and-consolidation structure makes it beginner-friendly compared with more complex formations.
- Since it is a continuation setup, it aligns well with momentum and trend-following trading approaches. Many traders prefer trading with the prevailing trend rather than against it.
- The structure naturally creates logical entry, stop-loss, and target zones. This can improve discipline and trade organisation.
- Bull flag patterns can appear in stocks, forex, commodities, indices, and crypto markets. The underlying price psychology remains broadly similar.
- The setup can appear in intraday charts as well as swing trading timeframes. Reliability often depends more on context than on timeframe alone.
Limitations of the bull flag pattern
Although the pattern is widely trusted, it has some limitations as follows:
- The pattern can generate false breakouts. Price may briefly break resistance and reverse sharply. This is common in volatile conditions.
- Beginners usually get confused during identification. They force a pattern on every consolidation, which leads to misidentification.
- If the prior trend has a low strength, then the continuation expectations weaken.
- News and announcements can invalidate the setup quickly.
- The pattern needs patience as it develops over multiple sessions.
Conclusion
The bull flag pattern is a bullish continuation pattern which develops during a strong uptrend. The pattern reflects the market's logical behaviour: strong momentum, temporary consolidation, and potential continuation.
The ideal bull flag setup usually appears in a healthy uptrend and shows controlled consolidation. Also, the pattern confirms itself with strong breakouts. But the pattern should not be traded alone. Use other indicators and volume to confirm the breakouts. The pattern also generates many false breakouts.
FAQs
What is the difference between a bull flag and a bull pennant?
A bull flag and a bull pennant are almost identical. But there is one crucial difference that separates them: a bull flag forms a parallel consolidation channel, while a bull pennant forms a converging triangular structure.
Can beginners trade bull flag patterns?
Yes, but beginners must have basic market knowledge. They should confirm the breakout first and set the stop loss.
Can bull flags appear in intraday trading?
Yes, the bull flag pattern can appear in an intraday setup as well. Many times, traders have noticed them forming on 15-min and hourly charts. However, shorter timeframes may produce more false signals due to market noise.
Which indicators work well with the bull flag pattern?
Common supporting tools include volume analysis, moving averages, RSI, VWAP, trendlines, and support-resistance zones.
How long does a bull flag pattern usually last?
The consolidation phase can take anywhere from a few candles to several sessions. It depends on the timeframe being analysed. Extremely long consolidations may weaken the continuation setup.