Pivot Points







The market has changed over the last decade. Due to growing awareness and technological advancement, retail participation in the market has increased significantly. In such a situation, making a quick and informed decision is crucial. Hence, many intraday traders use Pivot Points for technical analysis.
In this guide, we will focus on what pivot points are and how traders actually use them in real trading scenarios.
What are Pivot Points?
Pivot points are technical indicators used to determine potential support and resistance levels. These levels are calculated based on the previous trading session’s high, low, and closing prices.
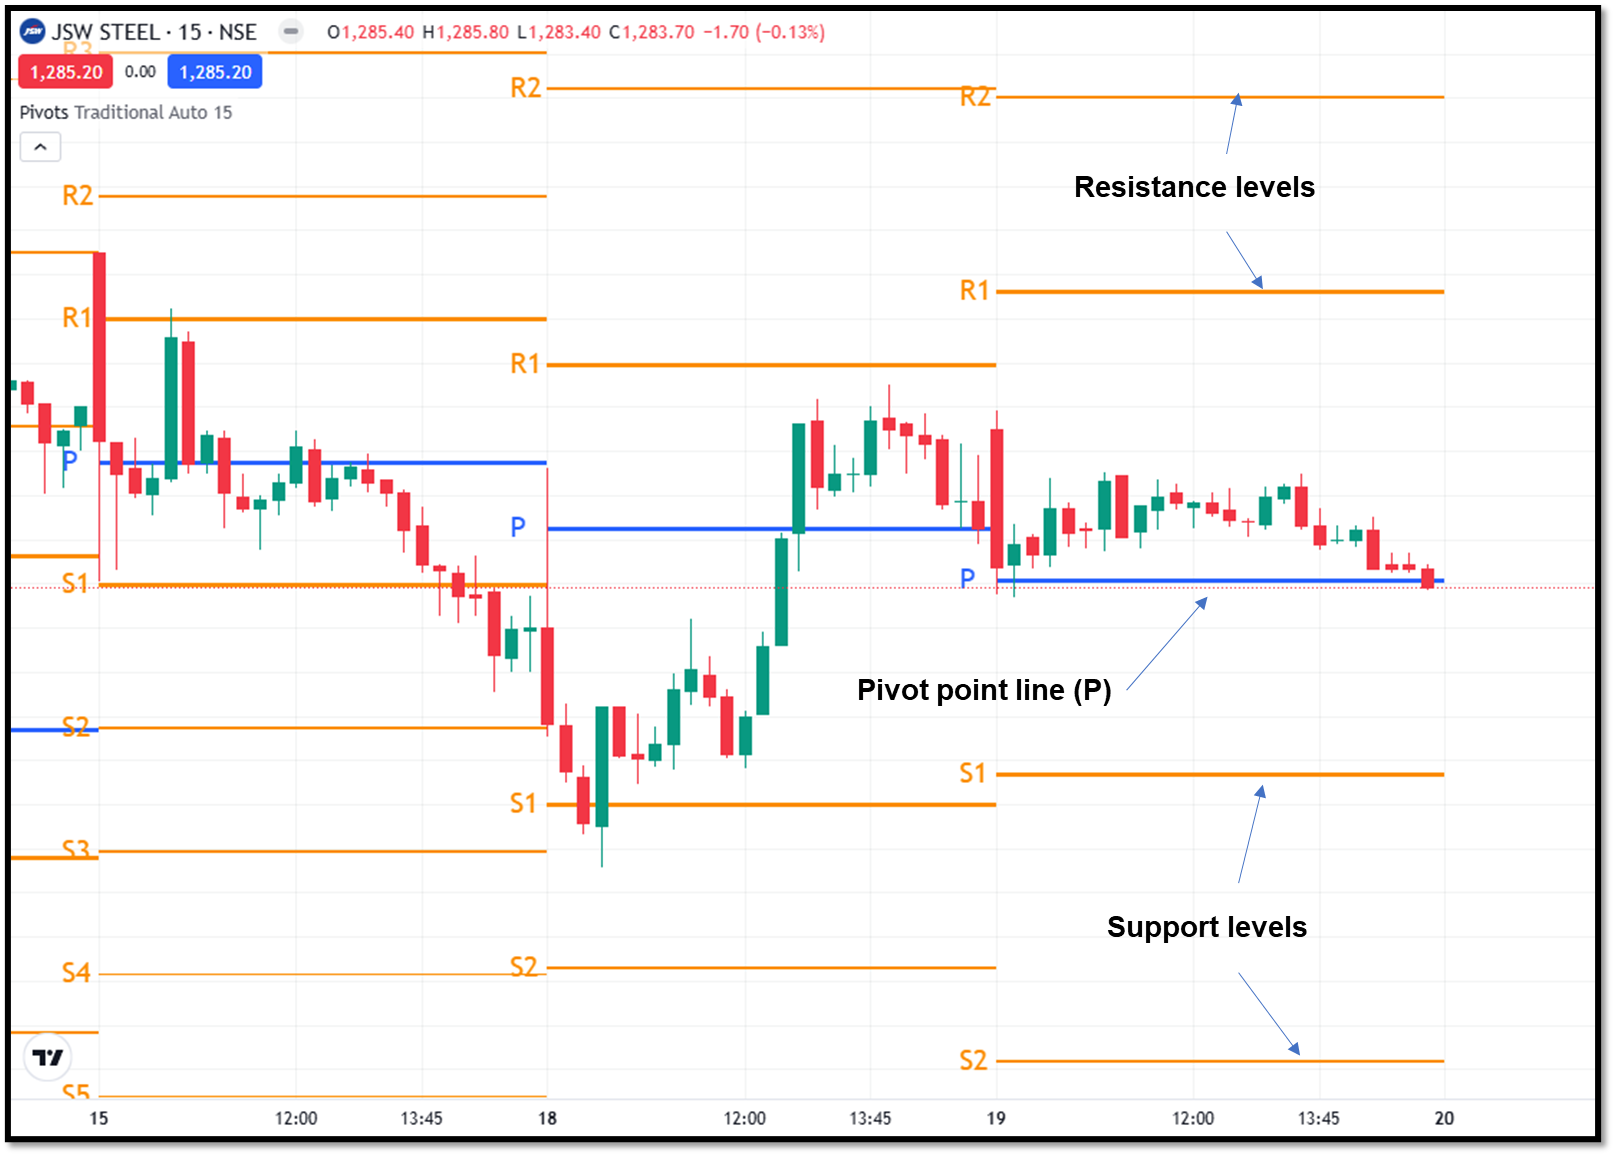
Pivot Points plots five lines on the chart, horizontally stacked one over the other. The centre line in
These five lines represent the pivot points line (P), while the two lines above the pivot points line represent resistance levels R1 and R2. The two lines below the pivot points line represent support levels S1 and S2. Traders use these lines to interpret the market movement.
For example, R1 and R2 are the resistance levels. Price might slow down near this level, reverse from it, or breakout.
How Pivot Points are Calculated?
To understand the indicator, you must first learn the basics. Understanding the calculations behind pivot points will help you understand the basics. The pivot points line is calculated using below formula:
Pivot Point (P) = High + Low + Close/3
From this pivot point value, the other four values will be derived. Their formulas are as follows:
Resistance 1 (R1) = (Px 2)-Low
Resistance 2 (R2) = P + (High-Low)
Support 1 (S1) = (Px2)-High
Suppoert 2 (S2) = P - (High-Low)
Where High, Low, and Close values are derived from the previous day.
While these formulas exist, most traders don’t calculate them manually. Modern trading platforms like Dhan automatically plot pivot points on charts, making them easy to use. The key Idea behind the above calculations is understanding how these levels behave in the real market.
Types of Pivot Points traders use
There are many types of Pivot points, each with slight variations in calculation and usage:
Standard Pivot Points
This is the most commonly used type. It is popular among beginners and widely supported on all charting platforms. The above-mentioned calculations are of standard pivot points.
Fibonacci Pivot Points
In this type of pivot point, the support and resistance levels are calculated by using Fibonacci ratios. It is useful in the trending market.
Camarilla Pivot Points
Camarilla pivot points are derived considering short-term price movements. It is popular among intraday traders and used for reversals identification on charts.
Woodie’s Pivot Points
It gives more weight to the closing price. Often used by traders who prioritise recent market sentiment.
How traders use Pivot Points
There are many interpretations and insights you can get from the pivot points. Traders use these interpretations in the following ways:
Identifying market trend using Pivot Point
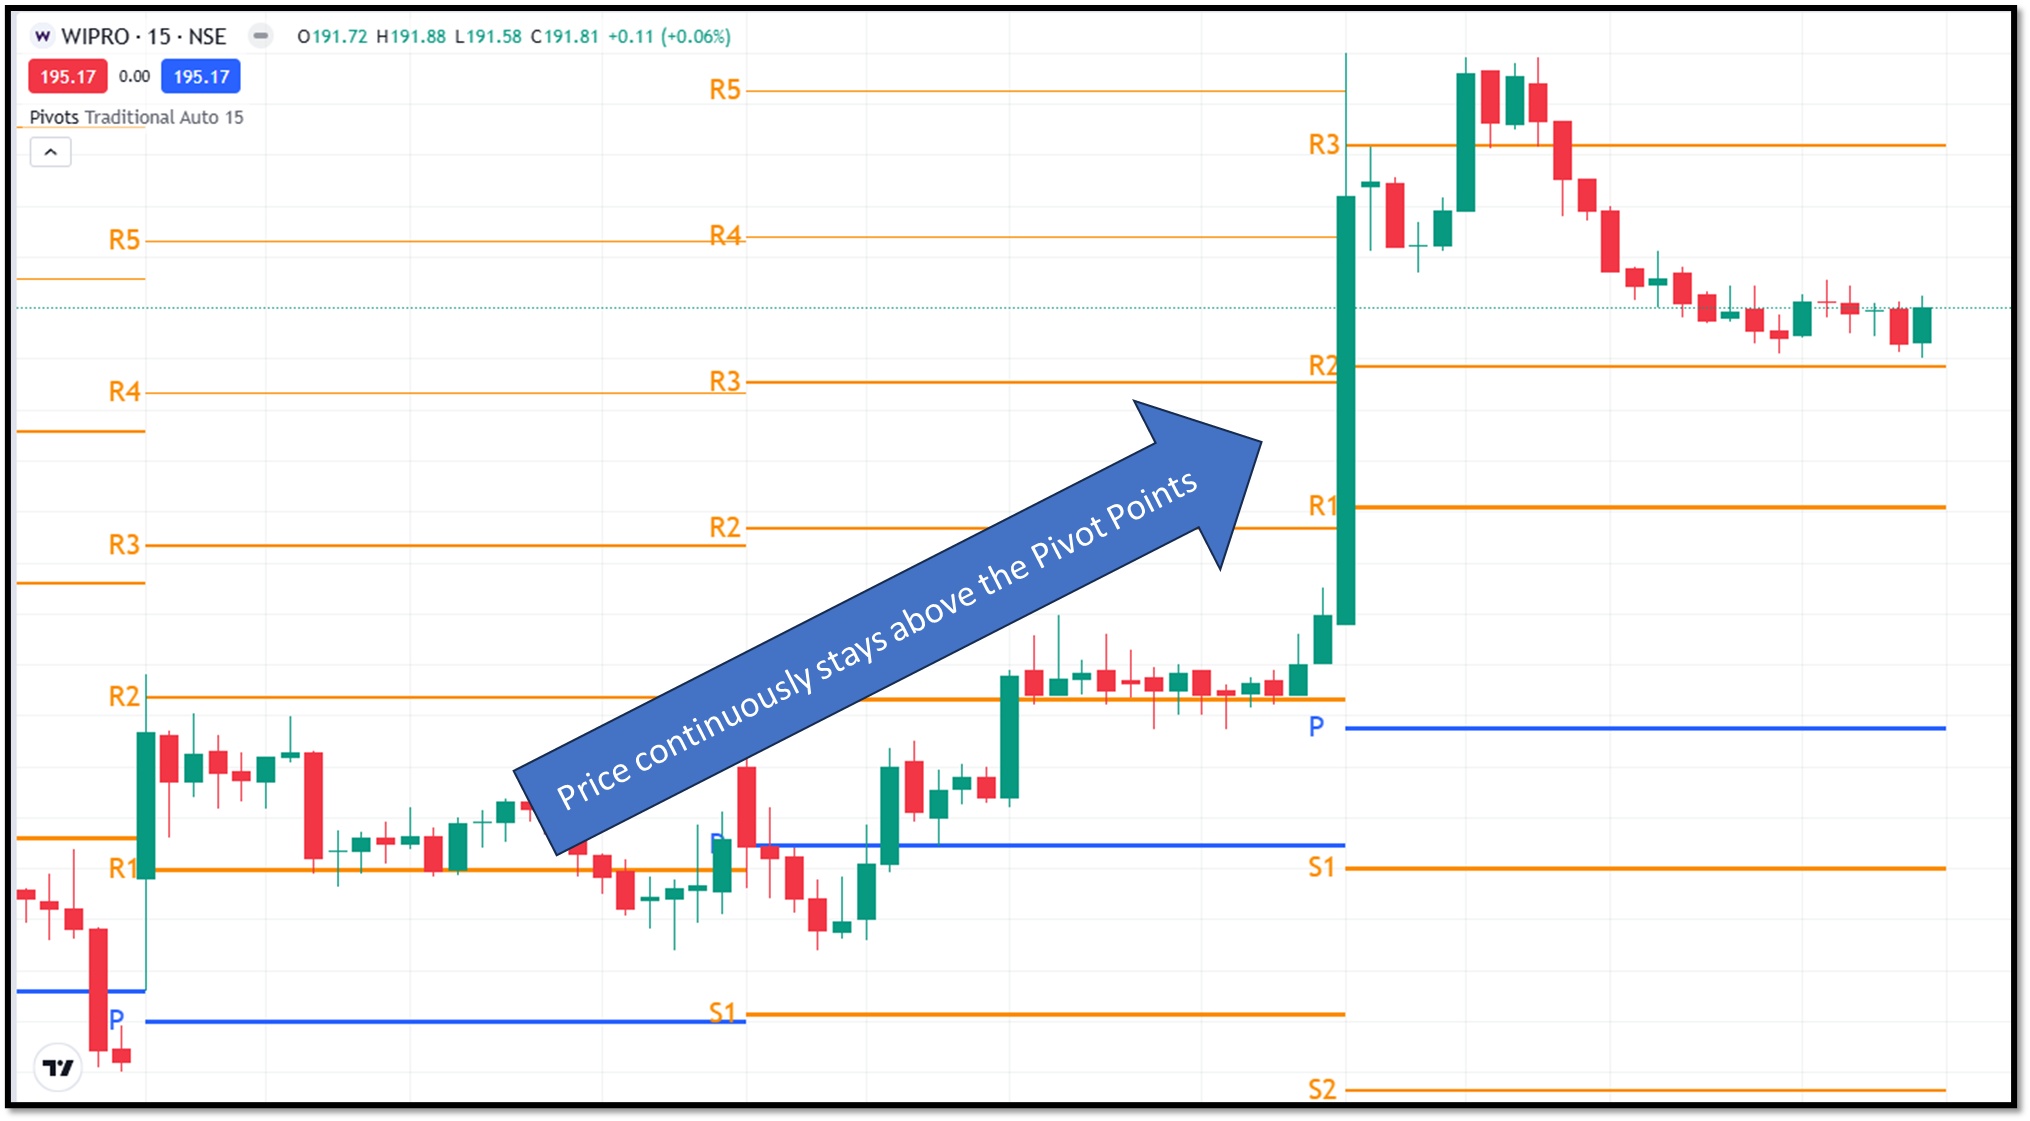
You can gauge market trends by looking at pivot points. There are two simple rules through which you can identify the ongoing trend by using pivot points:
- If the price is trading above the pivot point (P), the market is in an uptrend.
- If the price is trading below the pivot point (P), the market is in a downtrend.
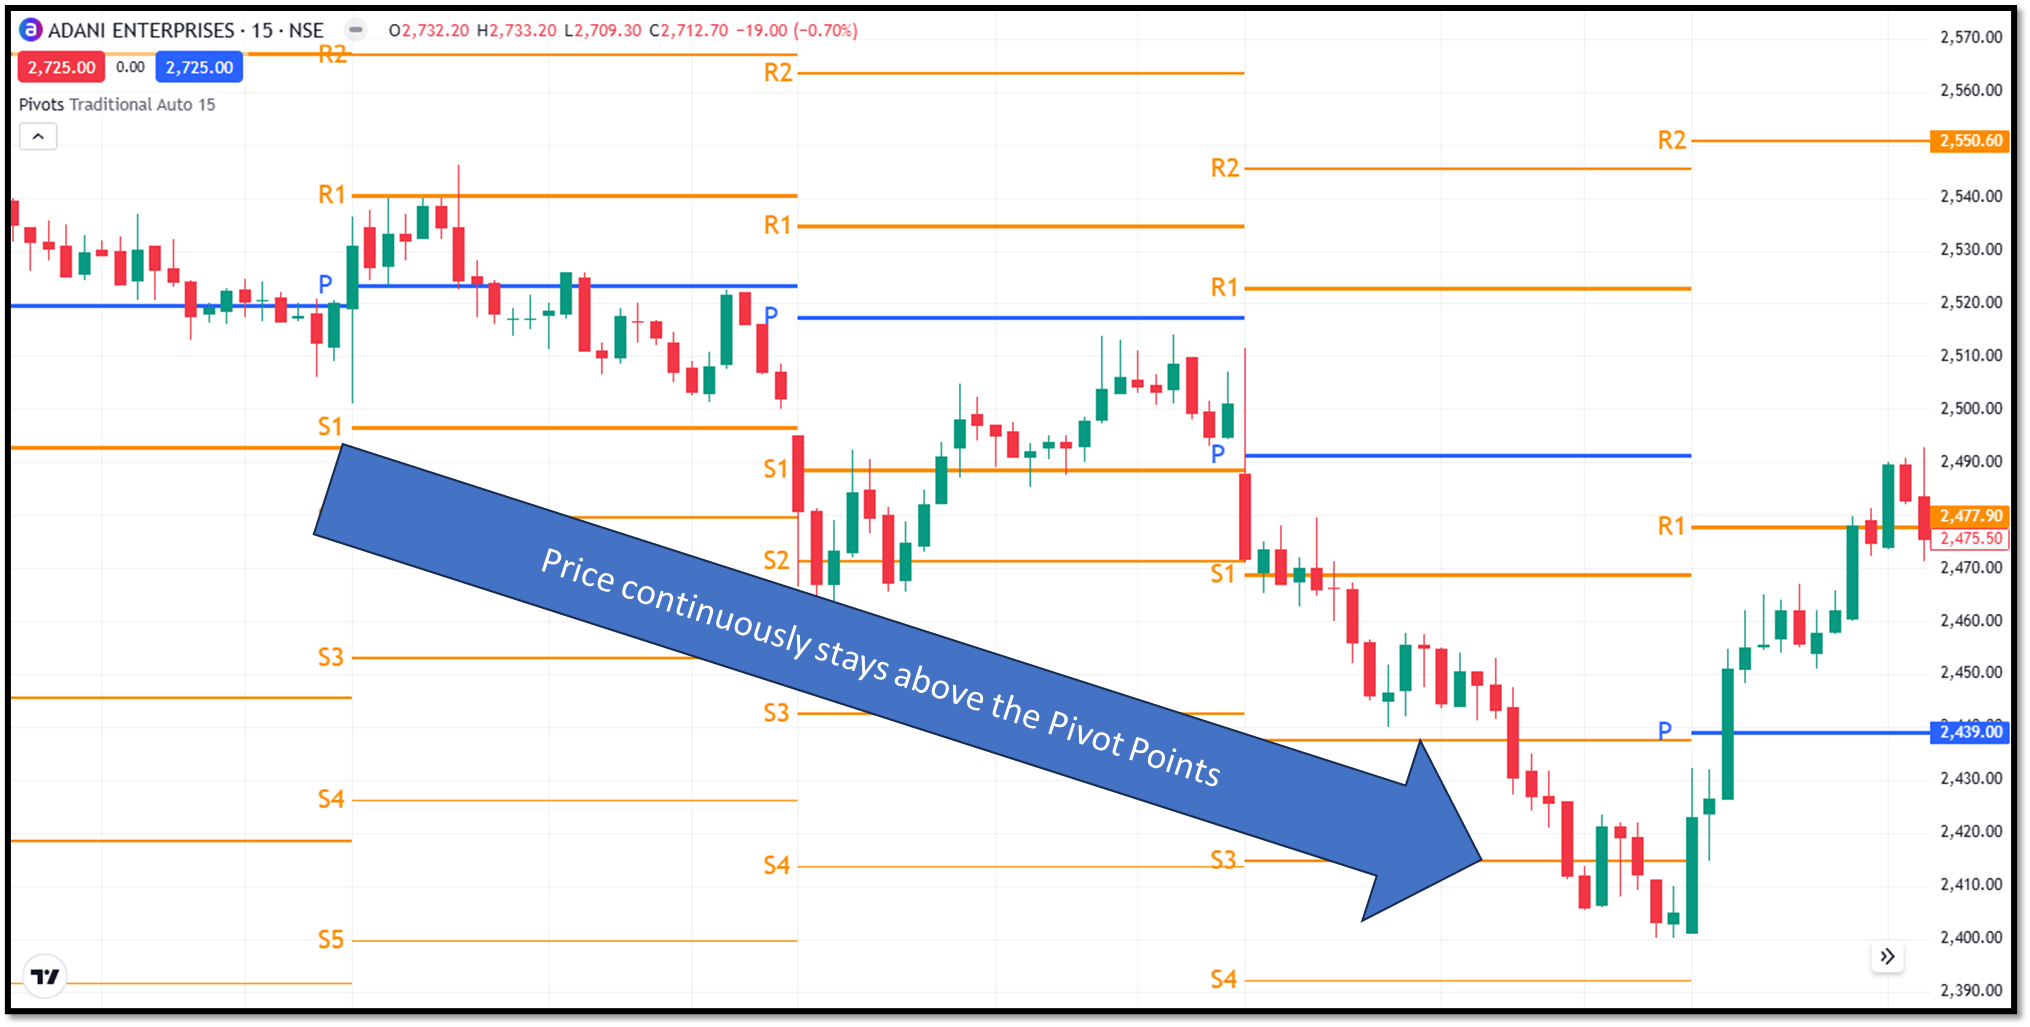
This simple rule helps traders decide whether to look for buying or selling opportunities during the day.
Using Pivot Points for entry
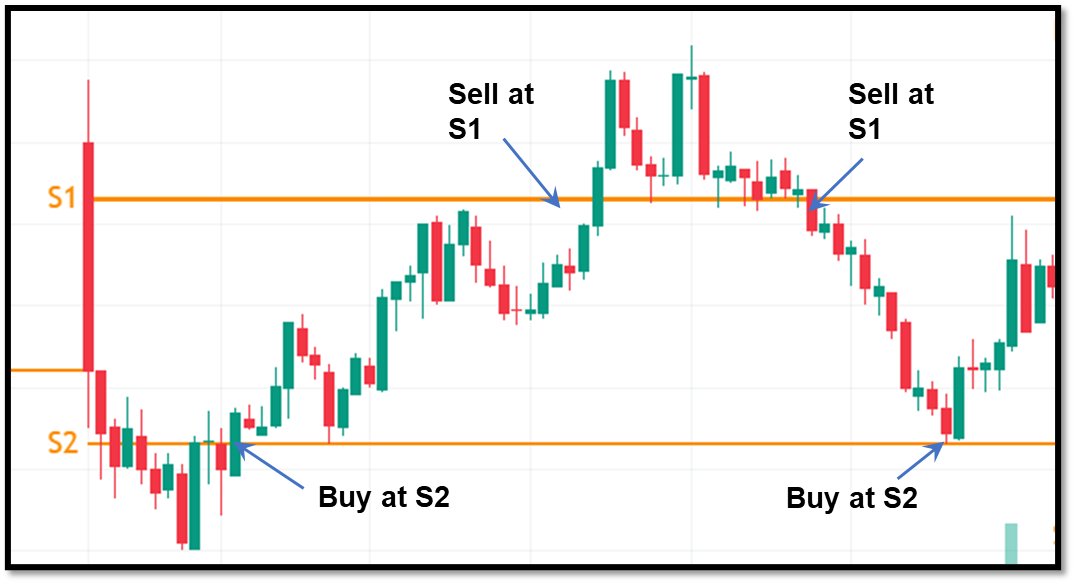
Many traders use support and resistance levels of pivot points for entries. They buy near support levels (S1, S2) and sell near resistance levels (R1, R2). But these entries are not solely dependent on the pivot point levels. Traders usually look for confirmation, such as bullish or bearish candlestick patterns, before entering a trade.
Setting stop loss & target using Pivot Point
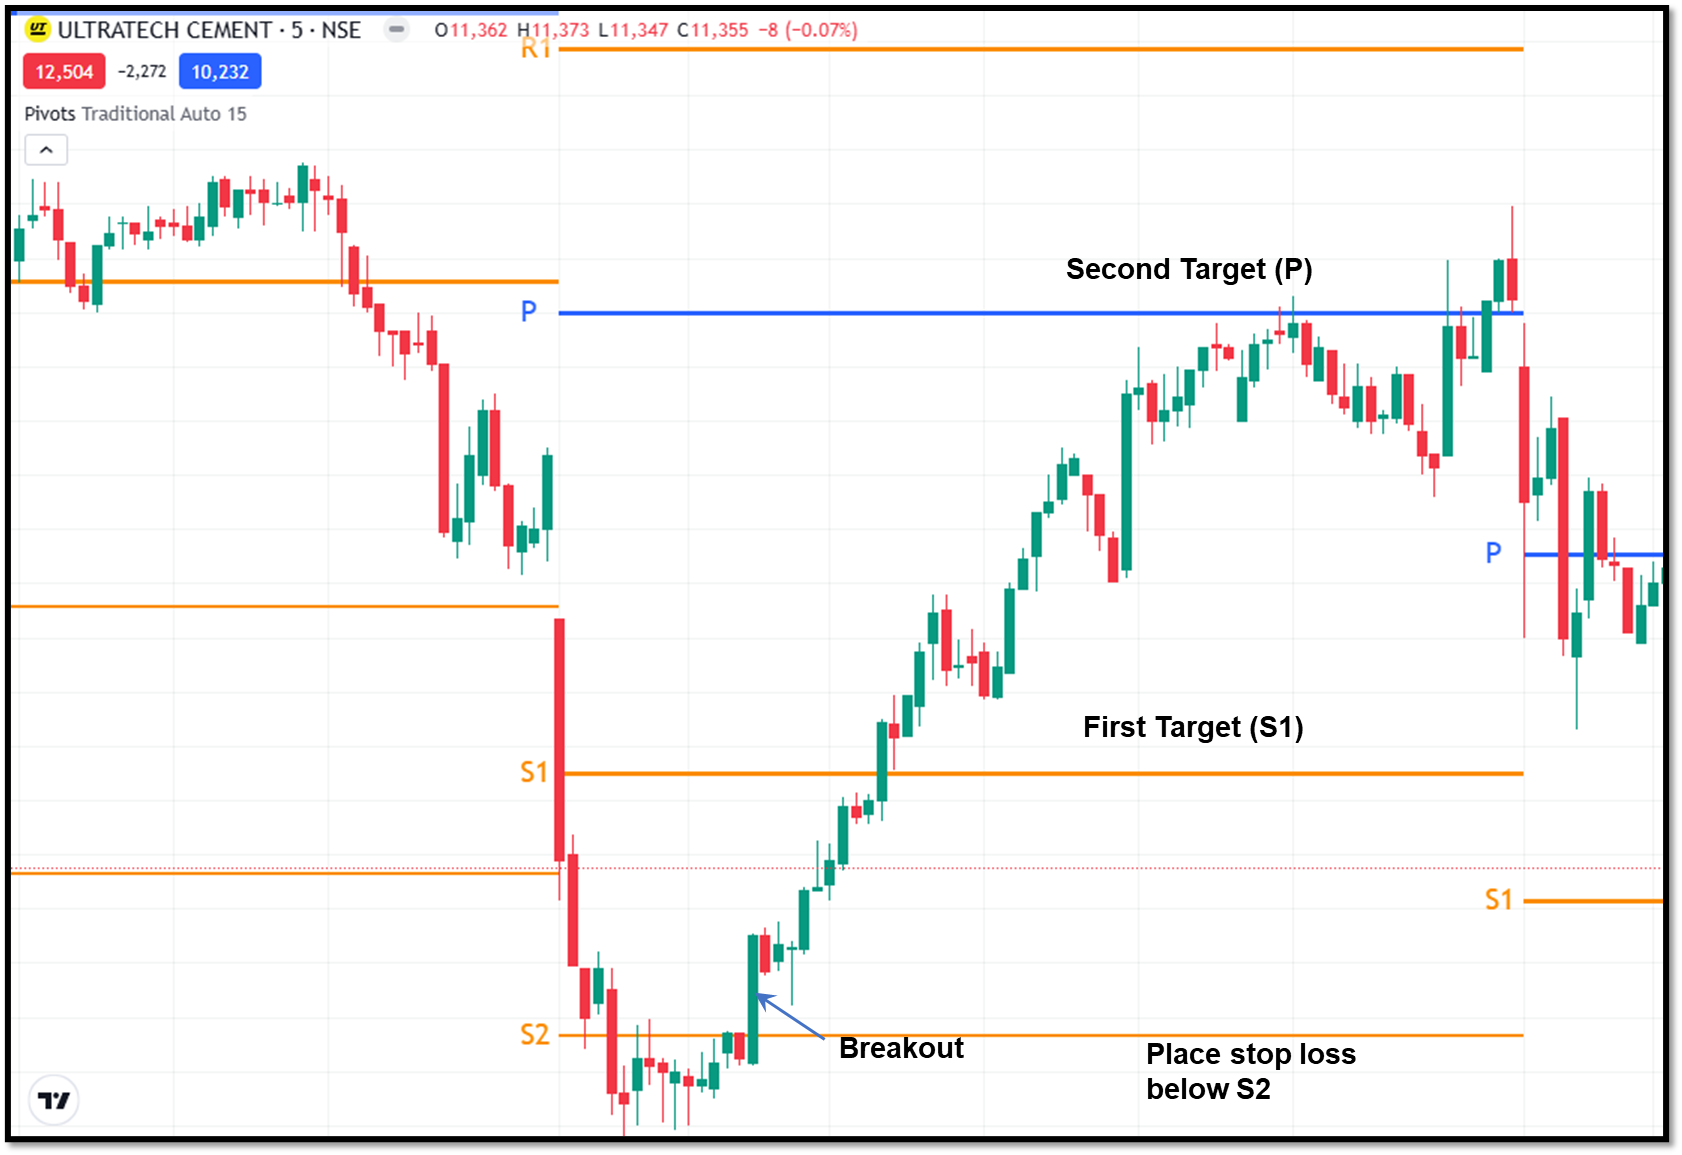
Pivot points help in defining clear risk management rules. Traders place stop-loss just below support for buy trades and just above resistance for sell trades. Target is for the next pivot level. For example, if you buy at S1, your target could be the pivot point or R1.
Breakout trading with Pivot Point
When the price breaks through a pivot level with strong momentum or volume, it often signals a continuation move. If the price breaks above R1 can be interpreted as potential upward momentum, while if it breaks below S1 then potential downward momentum. Traders enter in the direction of the breakout and aim for the next level (R2 or S2).
Range trading strategy
Prices typically fluctuate between support and resistance levels in sideways markets. Near support, traders place buy orders, and near resistance, they place sell orders. This strategy works best when the market lacks a strong trend and respects pivot levels consistently.
Best indicators to combine with Pivot Points
Traders usually don’t rely on a single indicator. They combine with other indicators to improve accuracy. You can use below indicators in combination with pivot points.
- RSI Indicator (Relative Strength Index) helps identify overbought or oversold conditions.
- Moving averages can confirm overall trend direction.
- VWAP indicator(Volume Weighted Average Price) is useful for intraday strength analysis.
- Volume Indicators can be used to validate breakouts and reversals.
Advantages and limitations of Pivot Points
The following are the advantages of the pivot points:
- Pivot points are very simple and easy to interpret. A beginner can easily learn and use pivot points.
- It provides clear support and resistance levels.
- It is specifically useful for intraday traders.
- Traders across the globe use it for analysis.
- Since pivot points are based on fixed calculations, they remove emotional bias and help traders make more objective decisions.
- They also save time, as traders don’t need to manually draw support and resistance levels on charts.
Limitations of the Pivot Points:
- The reliability of pivot points decreases in a highly volatile market.
- Sometimes it can produce false breakouts.
- Pivot points are not suitable for long-term investing.
- Pivot points are based on past price data, so they may not fully reflect sudden news-driven market movements.
- In strong trending markets, prices may ignore certain pivot levels, leading to missed opportunities or premature exits.
Conclusion
Pivot points are a powerful yet simple tool that can significantly improve trading decisions. They offer an organised method for determining important levels, comprehending market sentiment, and organising trades with clear risk and reward.
Pivot points shouldn't be used alone, though, just like any other trading tool. For consistent outcomes, pivot points must be combined with other indicators and appropriate risk management.
FAQs
Are pivot points accurate?
Traders usually rely on pivot points because they are widely followed by traders, which often leads to the price reacting at these levels. But, they are not foolproof and must be used with other confirmation indicators.
Which pivot point is best for beginners?
There are many types of pivot points, but for beginners, the standard pivot chart is easy to understand and more than sufficient for analysing the market.
Can pivot points be used for swing trading?
Pivot points are mainly designed for intraday trading, but some traders do use weekly or monthly pivot points for swing trading. However, they are generally less effective for longer timeframes compared to other indicators.
Can I use pivot points in all types of markets?
Yes, pivot points can be used in stocks, forex, commodities, and even crypto markets. Their effectiveness depends on liquidity and how actively traders in that market follow these levels.
Should I use pivot points alone?
No, relying only on pivot points can lead to poor trading decisions. It’s always better to combine them with other indicators and proper risk management.