Exponential Moving Average Indicator (EMA Indicator)




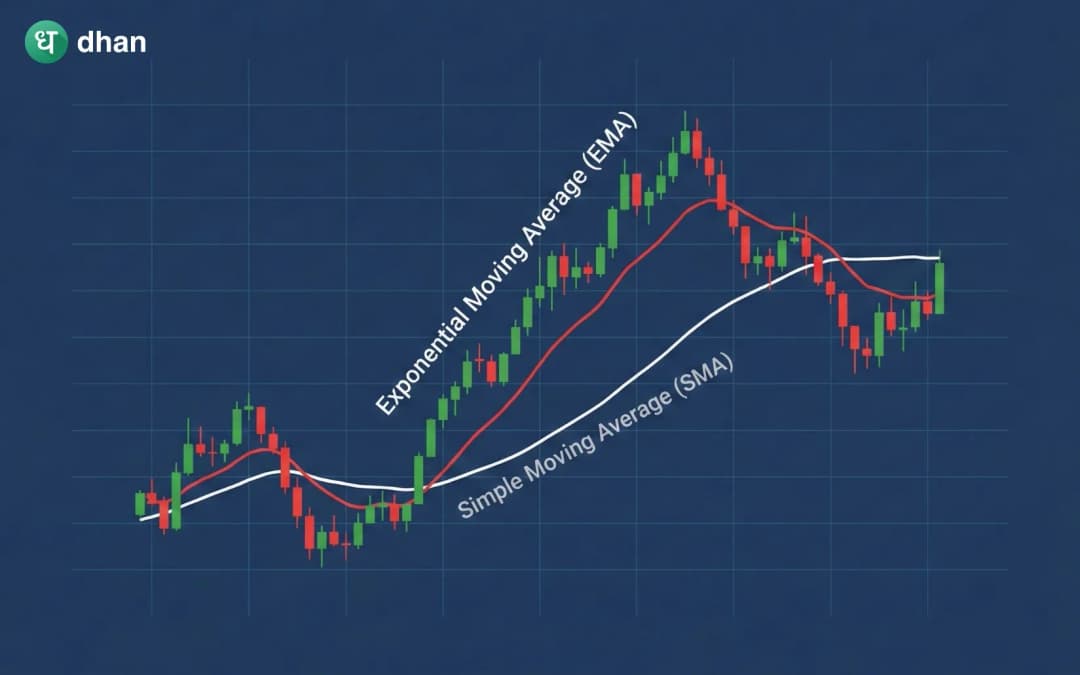




Prices of assets move up and down in a single trading session, which looks very noisy. To make sense of this movement, traders try to smooth price data with different tools like simple moving average (SMA), exponential moving average (EMA), weighted moving average, etc. Among these tools, EMA is one of the most commonly used by traders.
Here, we will cover the exponential moving average in detail.
What is an exponential moving average?
EMA is a tool that calculates the moving average of a financial security over a fixed period while giving more importance to recent price data. Due to this higher weighting of recent prices, EMA reacts quickly than SMA.
In trading, recent data matters most; hence, traders generally prefer EMA when the market is volatile or trending. EMA adjusts itself more quickly, so traders see the shift in momentum earlier. However, EMA does not predict the reversals, but it can track the trend.
How is EMA calculated?
EMA uses a smoothing factor that emphasises recent prices. This smoothing factor is denoted by α. Smoothing factor (α) is calculated with the following formula:
α = 2n+1
Where,
n = number of periods (for example, 20 for a 20 EMA)
Example,
Suppose n = 20
α = 220+1 = 2210.095
This means about 9.5% weightage is given to the most recent price.
EMA needs a starting price, which is generally the SMA of the first n period. In this example, it is 20.
Assume the SMA of the given asset is ₹100. Then
Initial EMA = ₹100
The EMA for the current period is calculated as:
EMAtoday = (Pricetoday × α) + (Initial EMA × (1−α))
Assume the asset is trading at ₹104. Then, the values for the calculation are as below:
- = 0.095
- Pricetoday = 104
- Initial EMA = 100
Let's calculate today's exponential moving average with the above formula.
EMAtoday =(1040.095) +(100(1-0.095)
=9.88 +(1000.905)
=9.88 +90.5 = 100.38
EMAtoday = 100.38
You can see that even though today's price is trading at ₹104, the EMA for today is ₹100.38, which reflects the trend without a sharp reaction.
In practice, trading platforms calculate EMA automatically. For example, on the Dhan trading platform, EMA values are calculated instantly on intraday and positional charts, allowing traders to focus on interpretation rather than manual calculation. Traders must understand that EMA is designed to be responsive, which is a strength and a weakness.
Difference between EMA and SMA
Although they are both moving averages, the EMA and SMA react to price changes in different ways. The following are some significant distinctions between SMA and EMA:
- Speed: EMA reacts to price changes more quickly than SMA.
- Lag: When compared to SMA, EMA minimises lag, particularly during powerful movements.
- Sensitivity: In sideways markets, the EMA can generate more false signals in addition to earlier signals.
While EMA is used for day trading, SMA is better for long-term trend confirmation.
Common EMA periods
For traders, different exponential moving average periods have different uses. Depending on the timeframe and trading style, traders employ these periods.
EMAs for the short term (5, 9, 12, 20)
During day trading, these EMA periods are utilised. They can be useful for entries and exits because they monitor brief bursts of momentum.
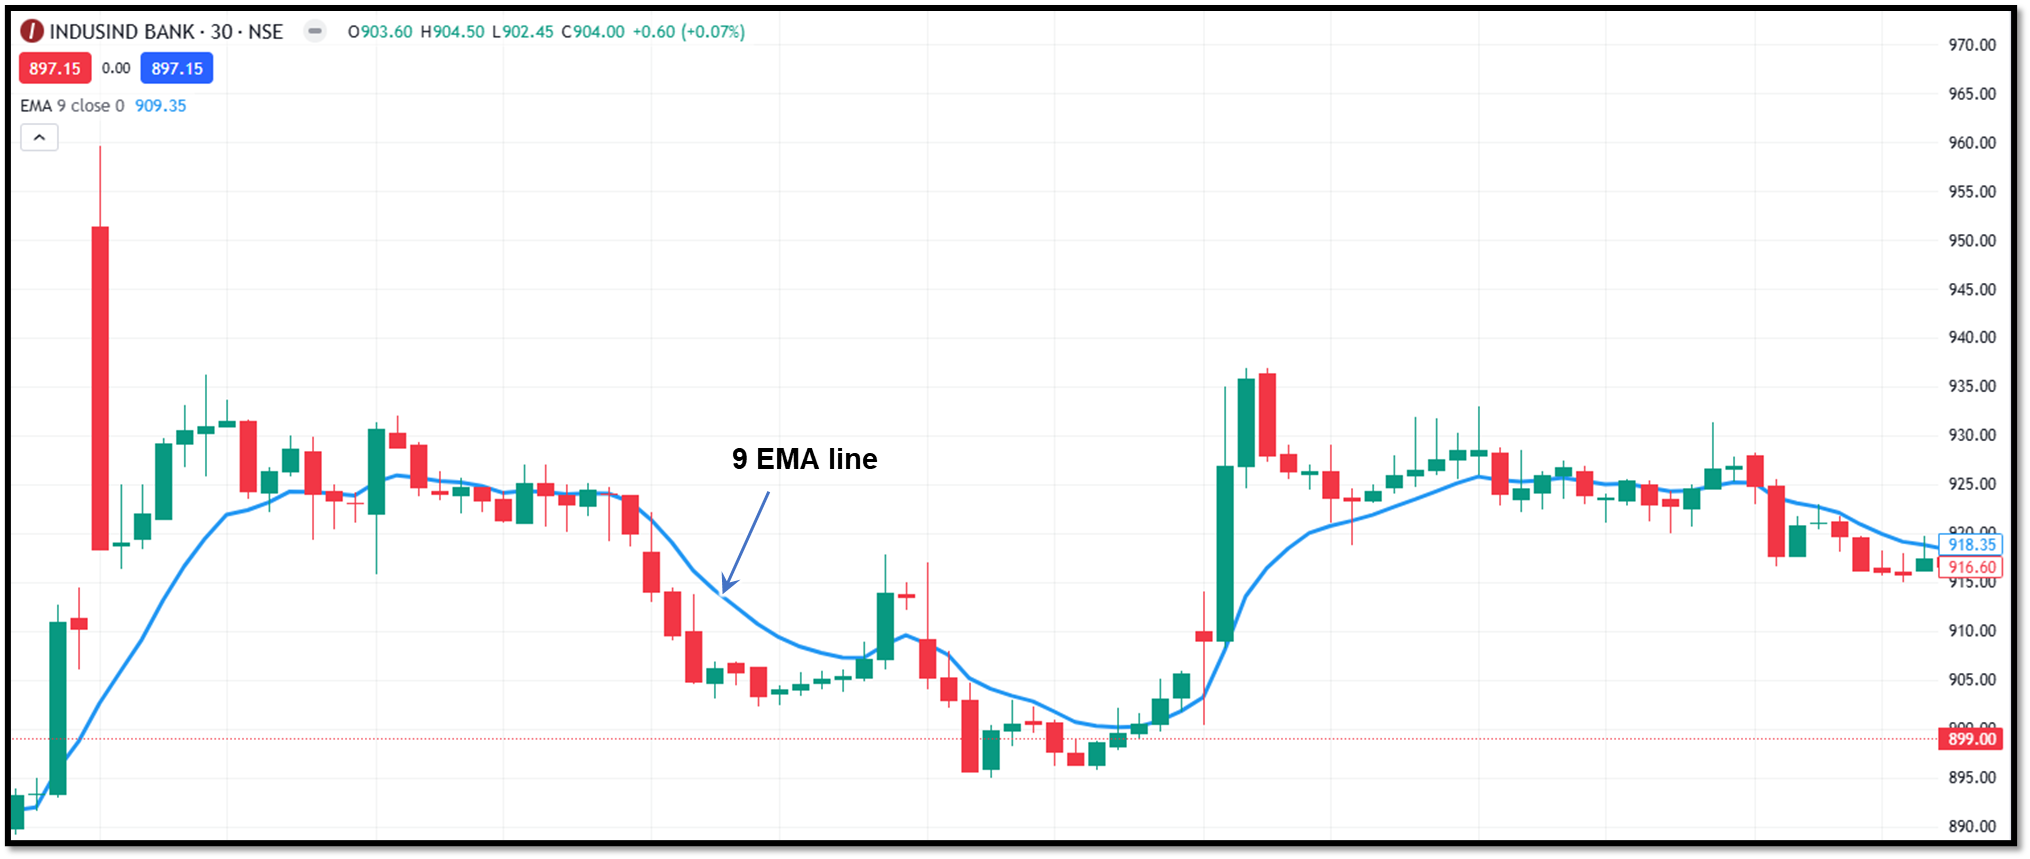
For example, traders can analyse an increase or decrease in momentum using the 5 Ema, 9 EMA and 20 EMA on a 5-minute chart.
EMAs for the medium term (21, 26, 50)
In swing trading, traders typically use medium-term EMAs. They verify the momentum and assist in spotting pullbacks within a trend. In this category, a 50EMA is frequently used to analyse trend strength using a day candle.
Different EMA periods serve different purposes for traders. Traders use these periods based on the timeframe and trading style.
Long-term EMAs (100, 200)
These EMAs are used to define the broader market direction. Investors and positional traders use the 200 EMA to check the long-term uptrend or downtrend. Price trading above the 200 EMA generally signals long-term strength; trading below it suggests weakness.
When EMA works well—and when it doesn’t
When there is a clear trend in the market, EMA works effectively. It helps traders to stay in the trade and avoid premature exits. But when the market is range-bound, the price crosses the EMA line repeatedly. This creates false entries and confusion.
Traders must understand the market structure and use other indications before starting the trade.
Advantages of EMA
Some advantages of exponential moving average are as follows:
Acts as dynamic support and resistance
In a trending market, generally prices respect the EMA line. During an uptrend, when there is a pullback, there are high chances that the price will reverse before crossing the EMA line. Similarly, while downtrend prices will tend to reverse before crossing the EMA line.
Faster response to price changes
As EMA gives more weightage to the recent price, it reacts quicker compared to SMA. Early trend recognition can improve entry timing and reduce lag.
Better for short-term and intraday trading
Because of its quicker response time, EMA works well on lower timeframes like 5-minute, 15-minute and hourly charts. Many intraday traders use EMA for day trading.
Disadvantages of EMA
The disadvantages of the exponential moving average are as follows.
Generates false signals in sideways markets
During a sideways market, the price crosses the EMA line multiple times. This leads to false signals and confusion.
Period selection can be subjective
EMA period selection largely depends upon the trader's view. Results may vary depending on the settings used by different traders.
Not reliable as a standalone tool
EMA cannot reveal information about market sentiment, volume, or volatility. Additional indicators are required for confirmation of the trend.
Final words
The exponential moving average is a powerful trend-following tool. As it adapts quickly to recent price changes, its responsiveness makes it useful for traders in fast markets. At the same time, that same responsiveness can create false signals if used in a sideways market.
EMA is more effective when combined with other trend confirmation tools. Traders need to be aware of its function because it will help them manage entries and exits, stay in line with the trend, and steer clear of rash decisions.
FAQs
Should EMA be used alone for trading decisions?
No. EMA gives only current trend direction; it is not a prediction tool. EMA should be combined with other confirmations, such as price action, volume, support-resistance levels, or momentum indicators like RSI.
Is EMA better than SMA for trading?
We cannot say that because both EMA and SMA are used during different market conditions and traders' perspectives. EMA is more suitable for short-term and intraday trading. SMA is slower and works better for long-term trend analysis.
Does EMA work in sideways markets?
No. EMA gives false signals during range-bound or sideways markets as the price crosses the EMA line frequently. EMA works best when the market is trending clearly.
Can EMA be used for long-term investing?
Yes. Long-term investors use 100 EMA or 200 EMA to see the broader trend. If the price stays above these EMAs, it usually indicates long-term strength.
How is EMA different from VWAP?
EMA depends upon time and focuses on trend direction, while VWAP is volume-based and reflects the average traded price during a session. EMA is more useful for trend-following, while VWAP is used for intraday bias and execution.