Commodity Channel Index (CCI): Definition, Usage, and Limitations





The Commodity Channel Index or CCI indicator is a technical indicator used in trading. It helps you understand if a commodity is trading higher or lower than its usual price range. It shows how far the current price is from its average, helping you understand whether a market might be overbought or oversold.
Though it was created for commodity trading, traders now use it for stocks, forex, and other assets too.
Experienced traders use multiple technical tools, like charts, indicators and oscillators, to understand demand, supply and sentiments in the market. If you’re new to technical analysis, learning CCI can give you a strong starting point without feeling overwhelmed.
In this article, we’ll break down how the CCI works and how you can use it effectively.
What is the Commodity Channel Index (CCI)?
The Commodity Channel Index (CCI) is a simple yet powerful momentum indicator used by traders to spot potential buying and selling points.
Think of it like this: Every asset has a typical price behaviour. The CCI checks how far the current price has moved away from that “normal” behaviour.
When the price is much higher than usual, the CCI indicator gives a high reading. When it's lower than usual, the reading goes down. This movement tells traders whether the market is potentially overbought (too expensive) or oversold (too cheap).
Instead of giving buy or sell advice directly, the CCI offers clues. It tells you how strong or weak a price trend is and whether the asset might be due for a reversal or a breakout.
To better understand how CCI reacts to price changes, take a look at the chart below.
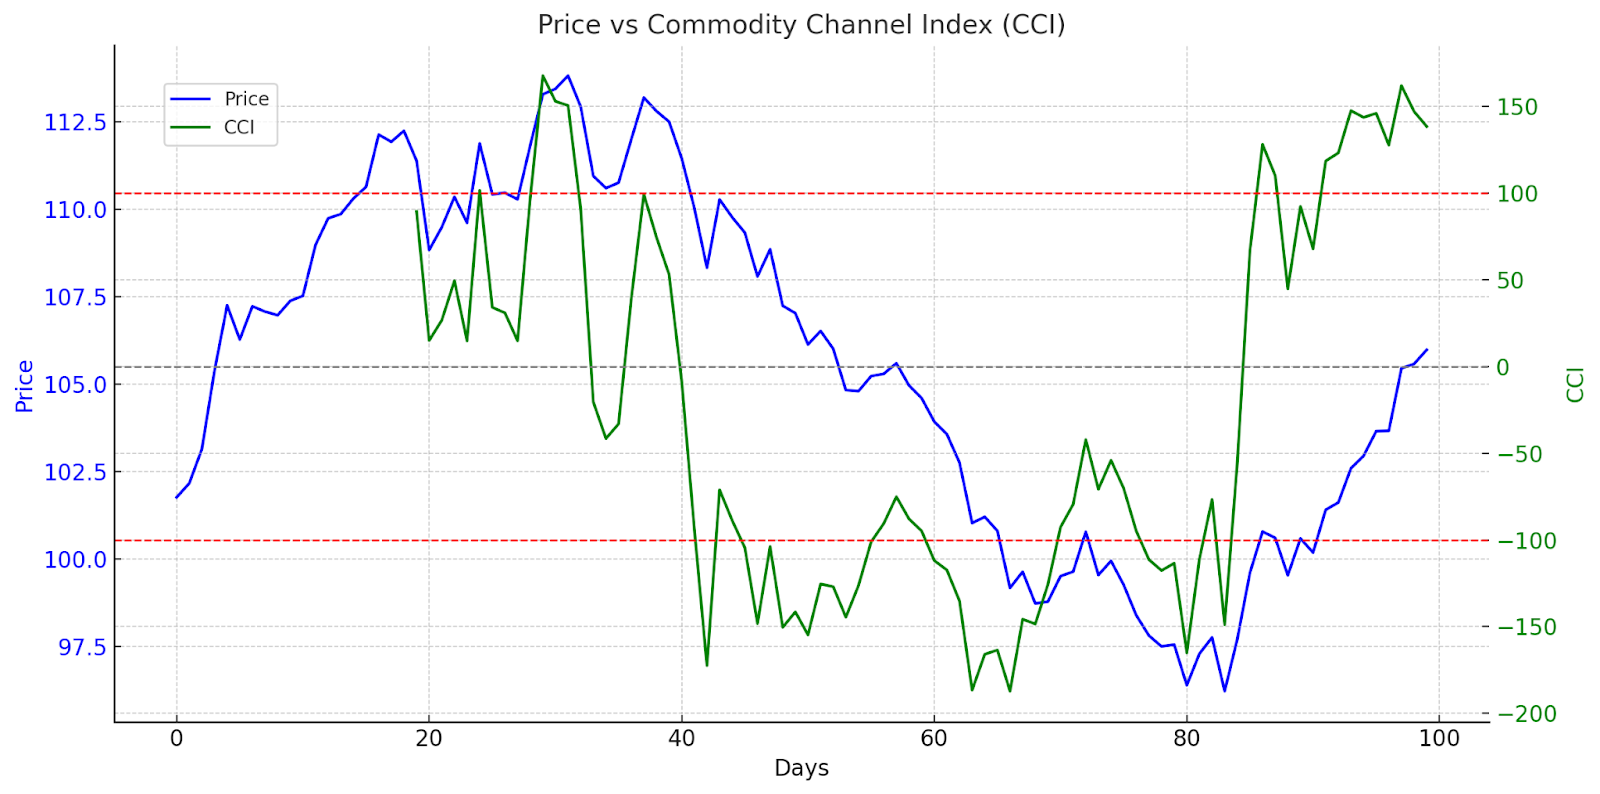
The graph shows how the CCI behaves in relation to price. The blue line is the price movement, and the green line is the CCI. The red dashed lines at +100 and -100 mark key CCI thresholds. These numbers act like boundaries:
- Above +100 might mean the asset is gaining momentum.
- Below -100 might show weakening pressure or possible recovery soon.
Traders use this tool with other indicators or chart patterns. It’s not magic, but it helps you time your trades more thoughtfully.
How is CCI calculated?
To calculate the CCI, we follow a few basic steps using price data from a chosen number of periods, like 14 or 20 days. The idea is to compare the current price to its recent average and see how far it has moved from that average.
CCI = (TP– SMA(TP)) / (0.15 x Mean Deviation)
Let’s break it down clearly.
Step 1: Find the typical price
Instead of using just the closing price, we take the average of the high, low, and close for each day.
The formula is: Typical Price (TP) = (High + Low + Close) ÷ 3
This gives a fair idea of where the price stands during the day.
Step 2: Calculate the Simple Moving Average (SMA) of the typical price
Now take the average of the Typical Prices from the last N days (e.g., 20 days). This becomes the "average price" that we will compare the current price to.
Step 3: Measure the mean deviation
Here we check how far each day's Typical Price is from the SMA (step 2). Then we take the average of all these differences.
This tells us how much the price normally moves around its average.
Step 4: Plug values into the CCI formula
Finally, use the following formula:
CCI = (TP– SMA(TP)) / (0.15 x Mean Deviation)
The number 0.015 is a constant that helps scale the values so most of them fall between +100 and -100.
Now, here is the quick summary table:
This whole process helps traders judge if the price is far from normal and whether a trend might be getting too strong or starting to reverse.
You don’t need to do these by hand. Most charting platforms like Dhan do it automatically. But knowing how it works helps you trust the indicator and use it better.
The most common setting for CCI is 20 periods. This means it looks at the last 20 candles (or days, if you’re using a daily chart). Some traders shorten the period to make the CCI react faster, while others use longer periods to smooth out the noise.
- A shorter period (like 14) will give quicker signals but might give more false alerts.
- A longer period (like 50 or 100) is slower but more stable.
It’s all about what fits your trading style. You can test different settings to see what works best for your market and time frame.
Interpreting CCI readings
Once you've calculated the CCI on your chart, the next step is to understand what those values actually tell you. The CCI doesn't give direct buy or sell signals. Instead, it shows whether the price is moving strongly in direction or losing strength.
Let’s break it into three key ideas.
1. Overbought and oversold zones
When the CCI value goes above +100, it usually means the price has risen more than normal. Traders call this an overbought situation. It doesn’t mean the price will slump right away, but it’s a warning that the asset might be too expensive at the moment.
When the CCI goes below -100, it shows the opposite. The price has dropped more than usual, and the asset may be oversold. This doesn’t guarantee a price bounce, but it tells traders to keep a close eye for signs of a possible move back up.
These two levels (+100 and -100) help spot extremes in price movements.
2. CCI as a momentum tool
The CCI doesn’t follow the trend like a moving average. It acts more like a momentum indicator, showing when prices are speeding up or slowing down.
If CCI is climbing, it means prices are moving up faster than usual. If it’s falling, the market is cooling off or heading lower.
When it crosses the zero line, it may suggest that a shift in direction is starting.
3. Typical ranges: +100 and -100
Most of the time, CCI moves between +100 and -100. This is its comfort zone. When it goes beyond these levels, it means the price is moving far away from the average and may not stay there for long.
If the CCI keeps rising above +100 and stays there for a while, it usually supports a strong trend. Same thing if it stays below -100. It shows the current price movement is backed by strong momentum.
But the moment it comes back into the normal range, it may suggest that the move is losing strength. This can help traders plan exits or prepare for pullbacks.
CCI indicator vs. other indicators
When you're trying to decide which technical tool to rely on, it helps to compare them side by side. The CCI is often placed next to popular indicators like RSI and MACD.
So how does it stack up?
The main purpose of CCI is to measure momentum compared to price, while RSI showcases overbought and oversold conditions. The typical range of CCI can be from +100 to -100, while for RSI it is from 0 to 100.
You can use CCI for spotting short-term momentum changes, while RSI is used to find reversal points of overbought or oversold conditions. You can use CCI for intraday as well as swing trading, and RSI for reversal trades as well as in range-bound markets.
There are also drawbacks that you should be aware of, such as CCI can give false signals in a sideways market, and RSI may lag during strong market trends.
So, when should you use CCI instead? You might choose CCI when you want to catch early momentum shifts that RSI or MACD might not show right away. It’s especially helpful if you trade actively or want quicker entries and exits.
However, in choppy or sideways markets, CCI may give signals that don’t lead to much. That’s where RSI or MACD might offer more stability.
In the end, no tool is perfect on its own. Many experienced traders combine CCI with either RSI or MACD to cross-check signals before making a move.
Commodity Channel Index trading strategies
The CCI can be a useful tool for both new and experienced traders. But using it the right way makes all the difference. Let’s look at a few simple, practical strategies you can try.
1. Entry and exit signals with CCI
Traders usually watch the CCI levels closely. If the CCI rises above +100, it may suggest that the price is going up with strong momentum. Some traders see this as a chance to enter a buy trade.
On the other side, if the CCI drops below -100, it may show that the price is falling with speed. This could be a sign to sell or go short, depending on the direction you're trading.
When the CCI moves back toward zero from these extreme levels, it often signals that the trend is losing strength. That’s when many traders decide to close their trade.
2. Watching for CCI Crossovers and Divergence
CCI Crossovers happen when the indicator crosses certain levels, like +100 or -100. These points often act like alarms. A crossover above +100 can be a sign to buy. A move below -100 can be a sign to sell.
Another thing to look out for is divergence. That’s when the price is making new highs or lows, but the CCI is not. For example, if the price goes higher but the CCI doesn’t follow, it may mean the trend is losing power. That’s a warning signal that a reversal could be near.
3. Mixing CCI with Other Indicators
The CCI works well when you use it with other tools. Many traders like to combine it with indicators such as RSI or MACD. Doing this gives extra confirmation.
Let’s say both the CCI and RSI are showing a strong buy signal. That gives you more confidence in your decision. On the other hand, if CCI says “buy” but MACD says “wait,” it’s better to hold off and wait for stronger confirmation.
You can also use trendlines, moving averages, or support and resistance zones to help filter your CCI signals.
4. Using CCI in Different Timeframes
If you’re a day trader, you might use the CCI on 5-minute or 15-minute charts. These give quicker signals but may also have more noise. So you have to be fast and focused.
If you’re into swing trading, you can apply CCI on daily or 4-hour charts. These signals take longer to appear but often show more reliable trends.
The settings you choose might change based on your style. Some traders prefer a 20-period CCI, while others experiment with 14 or 50 periods to match their speed.
Access TradingView charts live on Dhan for best charting and trading experience under one platform for free.
CCI Indicator best practices and limitations
The Commodity Channel Index (CCI) is very useful when you're trying to catch momentum shifts early. It often signals when a price is moving too far away from its average, which can help you spot possible trend changes.
But there are limitations also. Yes, the CCI is not perfect. One big issue is that it can give false signals when the market is moving sideways. During these quiet phases, it might show overbought or oversold readings without any real price movement happening. This can lead to bad entries or exits if you're not careful.
Another mistake is relying only on CCI. It was never designed to work alone. If you use it without looking at price structure or volume, you might act on a signal that has no real strength behind it.
So, here are a few tips for smarter use:
- Use support and resistance: Pair the CCI with basic chart analysis. If the CCI shows an overbought reading right at a resistance level, that makes the signal stronger.
- Try confirmation: Combine it with tools like RSI, MACD, or moving averages. This gives you an extra layer of validation before making a move.
- Adjust your settings: Don't always stick to the default. Try out different time periods to see which fits your trading style. Shorter periods will react faster, but may give more noise. Longer periods are smoother but slower to react.
- Backtest before trading live: Always test your setup using historical data. See how it would have performed in the past. This gives you a better idea of what to expect.
Conclusion
The Commodity Channel Index helps traders spot strong price moves and possible trend changes. It works well with other tools and is easy to understand with practice. If used wisely, it can improve timing for entries and exits. Test it first, then use it in your real trading plan.
FAQs about CCI
1. What markets or assets does CCI work best with?
CCI works well with stocks, forex, commodities, and crypto. It’s most useful in markets that show strong trends or clear momentum.
2. What is the best setting for CCI?
The standard setting is 20 periods. It works for most cases, but short-term traders often use 14, while long-term traders may prefer 50.
3. How reliable is CCI for trading?
CCI is helpful, but not always accurate on its own. It gives better signals when used with other tools like RSI or trendlines.