Check Stocks Delivered in Demat Accounts with Delivery Data Insights on ScanX





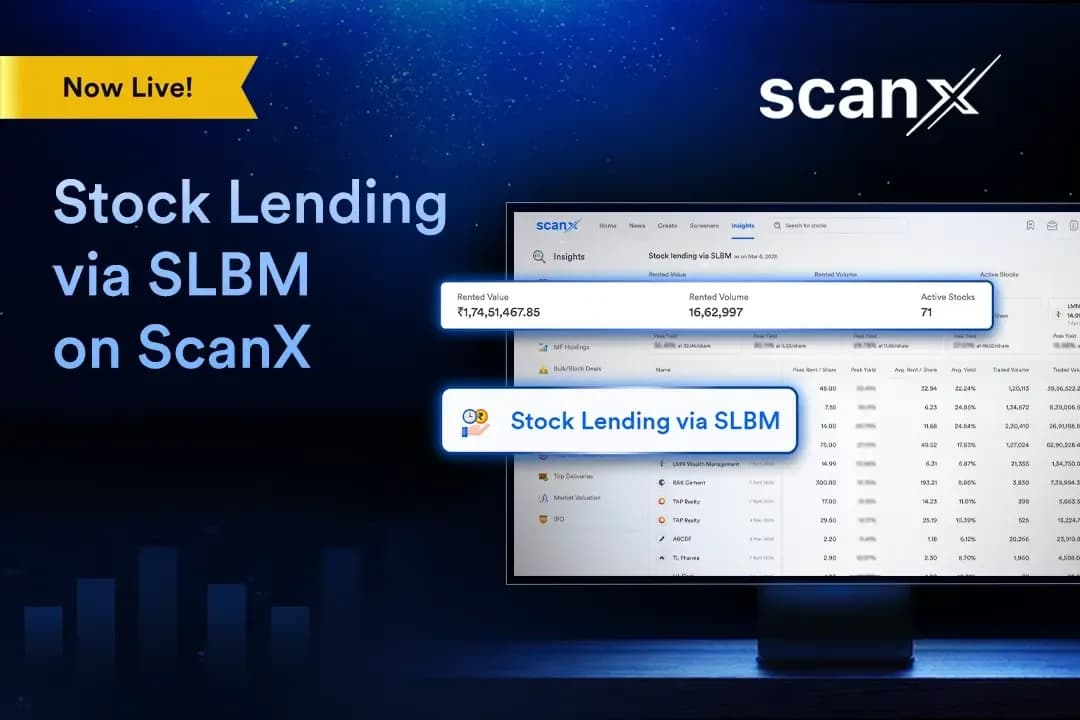
Key takeaways:
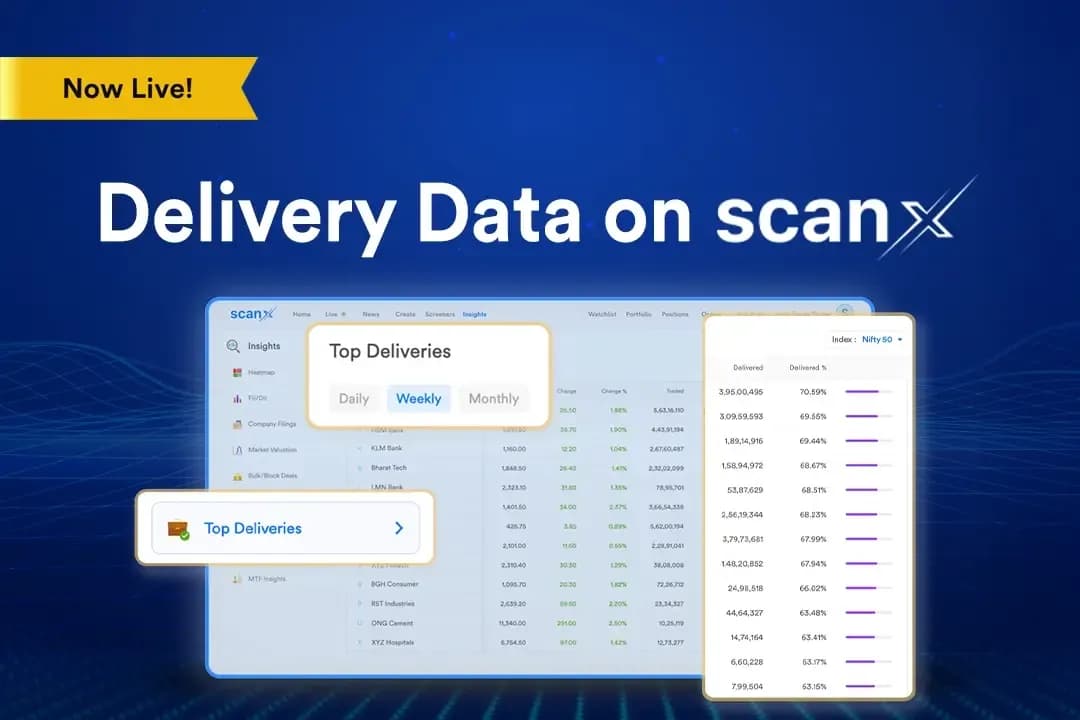
- Delivery Data Insights on ScanX provides the percentage of the total traded volume that is delivered in demat accounts and not squared off intraday.
- Data is available across daily, weekly, and monthly timeframes, enabling market participants to identify short-term fluctuations and long-term accumulation trends.
- The delivery data is aggregated across exchanges and can be filtered by index, allowing for separate analysis of large-cap, mid-cap, and small-cap universes.
- This feature is available within ScanX Insights on the ScanX platform, which is a part of the Dhan ecosystem.
A stock moves up sharply. Volume is also high. The chart looks strong. You enter the trade, and the next session, the trend reverses completely. The volume was real, but the conviction behind it was not. Most traders have been in this situation, where they see the volume and think that the move is real, only to discover later that the move was entirely driven by intraday participation with little to no accumulation behind it.
To address this gap, we offer Delivery Data Insights on ScanX. It provides access to exchange-level delivery data with volume insights, enabling you to identify whether the trading activity is driven by intraday participation or actual accumulation into demat accounts.
What is Delivery Data Insights on ScanX?
Delivery Data Insights is a feature within ScanX Insights that provides you with insights into the volume of a stock being delivered into demat accounts as actual holdings instead of being squared off intraday. This data is available across daily, weekly, and monthly time frames.
It helps market participants identify accumulation patterns, stronger momentum, potential trend continuation, or shifts in market participation across stocks and indices.
Why does Delivery Data Insights on ScanX matter?
The Delivery Data Insights shows whether trading activity is driven by intraday participation or actual accumulation into demat accounts. It helps in the following ways:
It filters out intraday noise and identifies true accumulation
Delivery data will help you determine if the rising volume is translating into actual holdings in demat accounts or not. If a stock has a high delivery percentage across multiple timeframes, it implies that the market participants are not only trading it, but they are holding it, which signals a true accumulation and not only an intraday move.
Tracking participation shifts
A sudden decline in delivery percentage with a high volume can indicate a shift from conviction-based buying to short-term speculation. Monitoring these changes can help you determine if a trend is gaining momentum or fading.
Spotting accumulation before the move
Rising delivery percentages alongside steady or growing volume often precede strong directional moves. Delivery data helps you identify this pattern early, before it becomes apparent to the broader market.
How to access Delivery Data Insights on ScanX?
Accessing Delivery Data Insights on ScanX takes just a few steps:
Step 1: Open the Dhan app or web trading platform and log in with your credentials, and navigate to the ScanX.
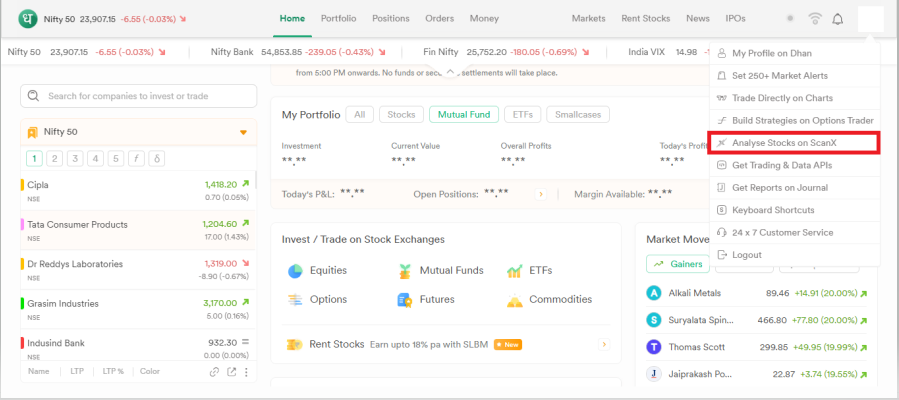
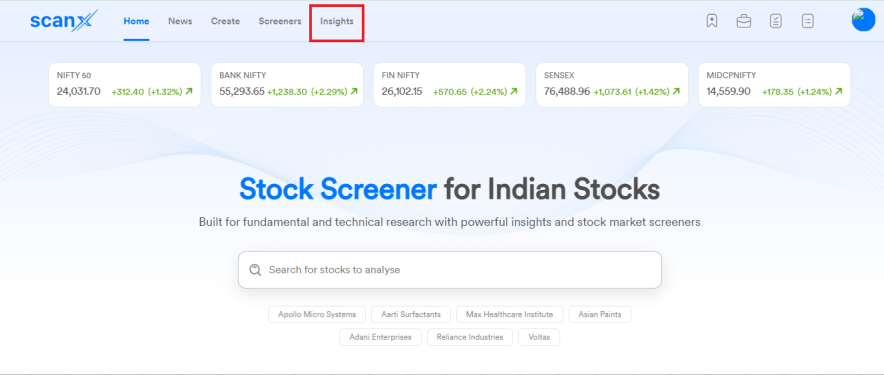
Step 2: Go to the Insights section within ScanX.
Step 3: Select Delivery Data Insights, which shows delivery trends across stocks and index-based segments.
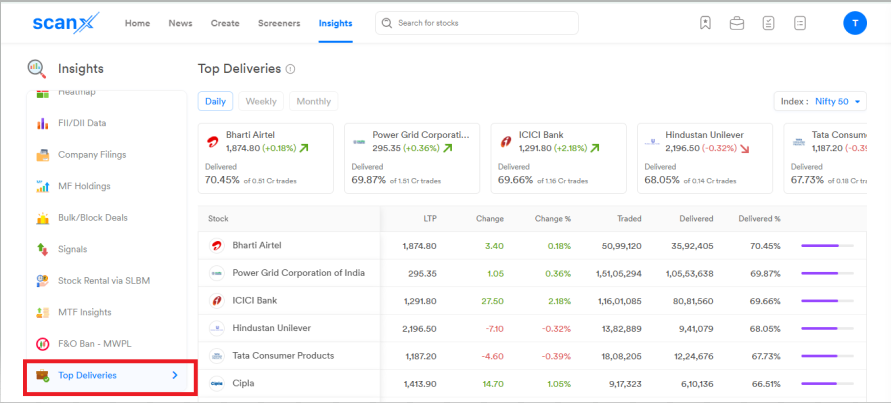
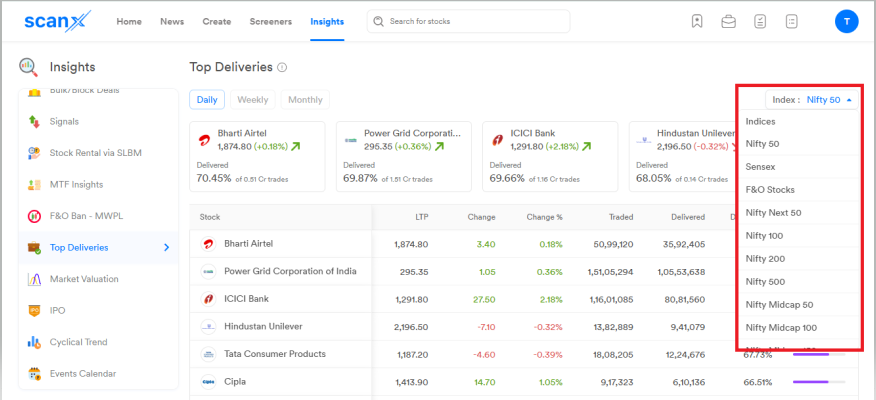
Step 4: Filter by index to narrow down the market cap universe you want to analyse, such as large-cap, mid-cap, or small-cap.
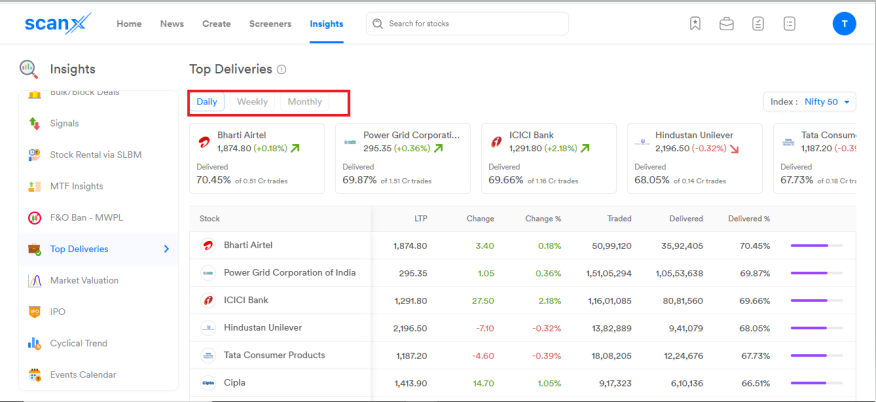
Step 5: Analyse delivery percentages across daily, weekly, and monthly timeframes to spot evolving market patterns.
Key benefits of Delivery Data Insights on ScanX
Some key benefits that Delivery data insights offers are:
- Delivery vs. intraday split: You can view exactly how much of a stock's volume is being held in demat accounts vs squared off.
- Multi-timeframe view: You can track delivery data across multiple timeframes, like daily, weekly, and monthly, all in one place to track both intraday shifts and evolving accumulation trends.
- Index-based filtering: You can filter out large-cap, mid-cap, and small-cap delivery trends to analyse a specific universe separately.
- Exchange-aggregated data: Delivery figures are collected at the exchange level, providing you with reliable and standardised data.
Use cases
Some practical use cases of Delivery Data Insights on ScanX are:
Validating a breakout before entering
A stock you have been tracking breaks out with high volume. Before entering the trade, you can check the delivery data on ScanX. If the delivery percentage is significantly above its recent average across the weekly timeframe, it signals the volume has conviction, and you can enter the trade with greater confidence.
Finding early buildup
You select a specific index, filter ScanX Insights, and sort the data by delivery percentage. You observe that a specific stock has had a steady rise in delivery percentage over the past three weeks, even though the price has not moved significantly. This indicates an early accumulation signal that the broader market is yet to notice.
Identifying distribution before a reversal
You have a stock in your portfolio that has been steadily increasing for weeks. On ScanX, through its delivery data, you can see that its volume is still high, but its delivery percentage has been declining in the last few sessions. This shift in participation is an indicator that intraday traders are driving the momentum, and the long-term holders are distributing.
Conclusion
Delivery Data Insights on ScanX offers you the delivery data that gives you insights into the real market participation across various timeframes. Instead of analysing trade volume in isolation, it shows you whether stocks are being accumulated or not.
Most importantly, it eliminates the uncertainties arising from high volumes by clarifying whether market activity was an intraday event or the beginning of a new trend.