Introducing New Technical Indicators on Dhan Charts





Key takeaways:
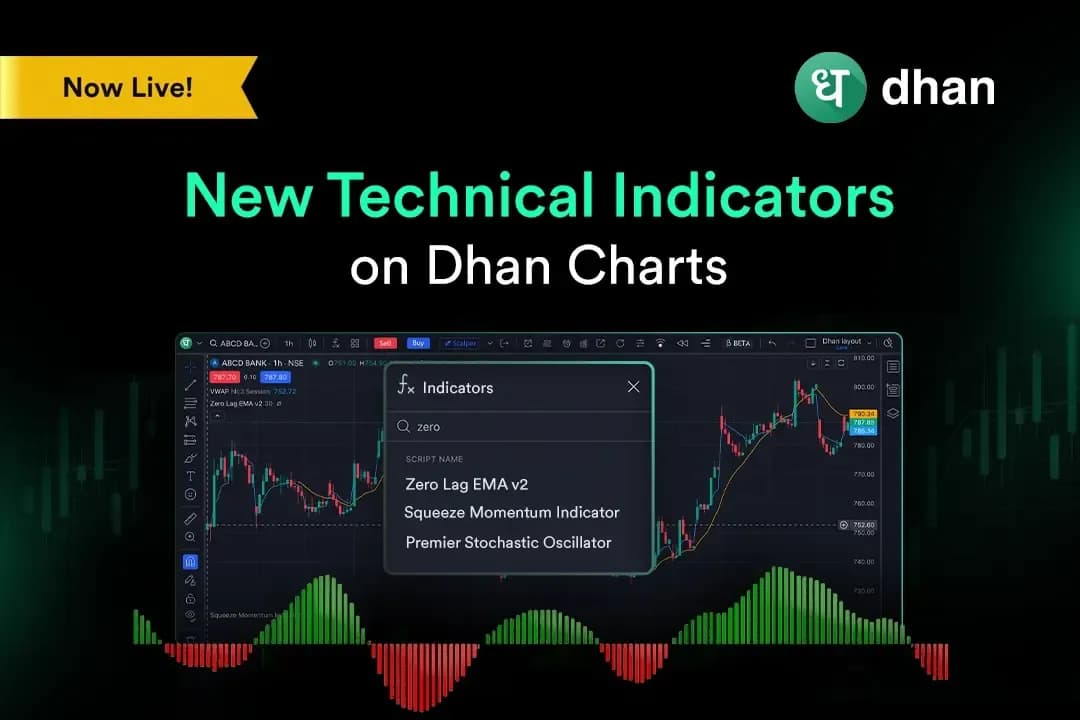
- The newly introduced indicators include Zero Lag EMA v2, Squeeze Momentum Indicator, Premier Stochastic Oscillator, Premier RSI Oscillator, and Volume Candles.
- The update also introduces watchlist sorting, quick Search, VWAP enhancements, new multi-layout combinations, and simplified notifications.
- All improvements are automatically available, with no extra setup required.
- New indicators are available within the chart interface alongside existing indicators, drawing tools, and analytical features.
You open the chart and start your analysis. You observe that a stock is in consolidation, volume is quietly building, and something is setting up. However, your current indicators are still processing what has already occurred. By the time traditional indicators generate a signal, a significant portion of the move may already have been absorbed by the market. Thus, the data was available, but the tools needed to interpret it efficiently were not.
To overcome this challenge, we have introduced a chart update that adds new technical indicators, chart types, and workflow improvements, providing you with a more flexible and feature-rich analytical experience.
What are the New Technical Indicators?
The new technical indicators introduced on Dhan charts are part of its chart update. This update adds a new version of the chart library to Dhan Charts, along with several advanced technical indicators, new chart types, and usability improvements.
New additions include indicators such as the Premier Stochastic Oscillator, Zero Lag EMA v2, Squeeze Momentum Indicator, Premier RSI Oscillator, Volume Candles, and multiple charting enhancements. The new indicators are available directly within the chart interface, alongside the existing tools you already rely on.
This update has been introduced to provide you with more advanced indicators, better market visualisation, and faster workflows. In addition to the new indicators, the update also introduces quick search, watchlist sorting, VWAP improvements, new multi-layout combinations, and simplified notifications to make your navigation and analysis journey smoother.
Why does it matter?
With the aim of enhancing charting and keeping you on top of markets, we consistently update our charting platform. This offers:
More analytical depth on the same chart
The new indicators increase your analytical depth on the charts. For example, indicators like the Zero Lag EMA v2 help you track trends without delay, giving you ample time to plan your entry.
Simplify the reading process
Reading volume alongside price usually requires switching your focus between the price and volume panels. Volume Candles bring both these together, so you can see the strength behind each candle without disrupting your workflow.
Faster navigation
The quick search for chart functions implies that you can find and apply any indicator without scrolling through a long list. Improved watchlist sorting helps you organise and access your stocks faster, which matters the most when the market is moving.
How does it work?
The upgraded charting experience is automatically available on Dhan Charts. Here’s how you can start using it:
Step 1: Open Dhan Charts on the Dhan app or web trading platform. The updates are available automatically.
Step 2: Open the indicator search and type the name of the new indicator you want to use, such as Squeeze Momentum Indicator or Zero Lag EMA v2.
Step 3: Apply the indicator to your chart and adjust the settings to align it with your trading strategy.
Step 4: Switch to Volume Candles if you want to view price and volume in an integrated display.
Step 5: Use the quick search, improved watchlist sorting, and new multi-layout combinations to set up your workspace the way you prefer.
Key benefits of the new technical indicators
This update offers you several benefits. Some of those benefits are:
- Advanced indicators: It gives you access to several new advanced indicators like Zero Lag EMA v2, Squeeze Momentum Indicator, and refined oscillators, thus giving you more tools for trend and momentum analysis.
- Volume Candles: A combined price-and-volume view makes it easier for you to read the strength behind price moves.
- Quick search: You can instantly find an indicator or chart function instead of scrolling through a list.
- Improved layouts: New multi-layout combinations let you set up your chart workspace according to your workflow and convenience.
- Automatic access: The updates are automatically available within your existing Dhan Charts.
Use cases
Some practical use cases of the new technical indicators are:
Tracking a breakout setup
The Squeeze Momentum Indicator can be used by you to identify where compression is building in a stock before a potential breakout. When used in conjunction with Volume Candles, it can help you validate the participation in the expected direction before entering the trade.
Analysing multiple charts
If you want to track multiple stocks, you can use the new multi-layout combinations to monitor several charts simultaneously, each with its own indicator configuration, without having to switch between multiple windows.
Evaluating intraday momentum
If you trade intraday moves, Zero Lag EMA v2 and the Premier RSI Oscillator can help you read momentum more quickly and check whether the trend still has strength. You can use them in combination to gauge whether a momentum is still present or if it is fading away.
Conclusion
Our new updates to the Dhan Charts provide you with advanced technical indicators, chart types, and usability improvements to help you identify trends, momentum shifts, and potential setups more efficiently. This update automatically brings both analytical depth and ease of use within the same interface you already use.
These updates solve the problem of not having the advanced tools to analyse market conditions more effectively and quickly act on them when market conditions align with your analysis.