See What Happens Inside Every Candle with Order Flow on DEXT T3




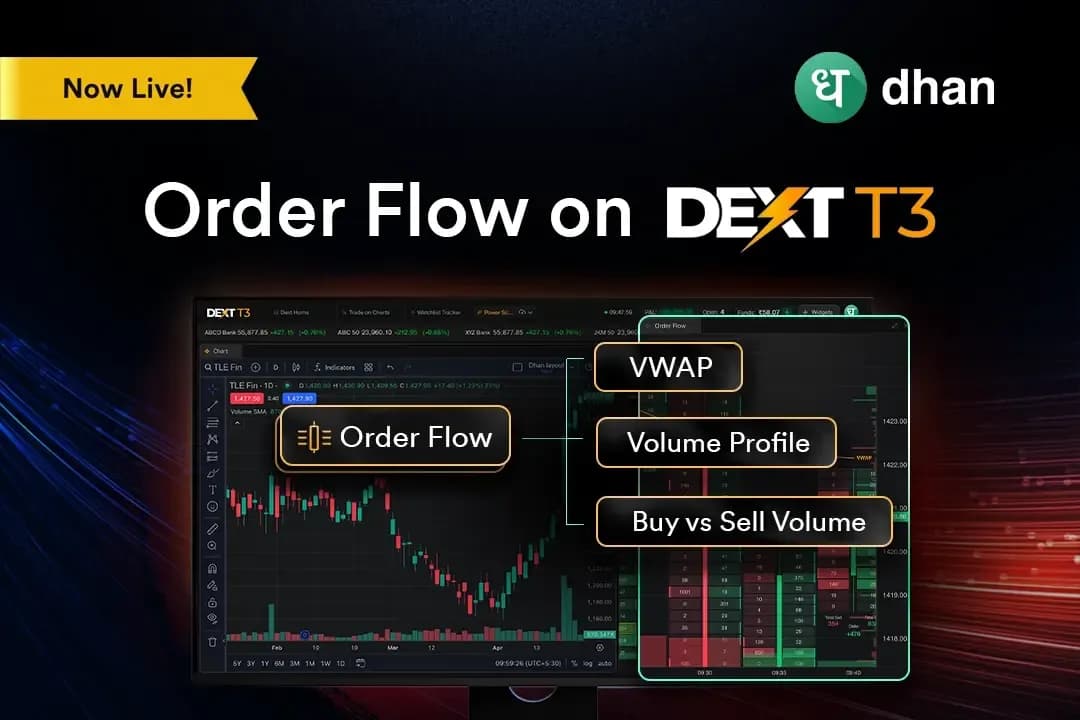

At Dhan, every feature we build for DEXT T3 starts with a simple question: what information gap is quietly costing traders their edge?
For intraday traders, one gap has always stood out.
Price tells you where the market moved. It does not tell you why it moved. It does not show who was driving the move, who was absorbing it, whether buyers or sellers were in control, or whether the conviction behind the move was real.
Today, that changes.
With Order Flow, traders can move beyond price alone and understand the real participation behind every move.
The Problem with Traditional Charts
Imagine you're watching Futures on a 3-minute chart.
A strong green candle forms. Price rallies sharply and appears to be breaking out. Everything on a traditional chart suggests a long trade.
Moments later, the move reverses.
What happened?
The candle looked bullish, but what was happening inside the candle told a very different story. Buying activity was weak, while sellers were aggressively absorbing orders near the highs.
Traditional charts show the result of the battle.
They do not show how the battle was fought.
Every candle gives you four data points: Open, High, Low, and Close. But it does not show which side was aggressive, where absorption happened, or how volume was distributed at each price level.
Order Flow fills that gap.
What is Order Flow?
Order Flow helps traders analyze actual buying and selling activity at every price level within a candle.
Instead of only seeing how price moved, you can see how market participants interacted at each level and understand the conviction behind the move.
This allows traders to identify potential traps, absorption zones, aggressive participation, and areas where momentum may be strengthening or weakening.
What You Can See with Order Flow
Buy vs Sell Volume at Every Price Level
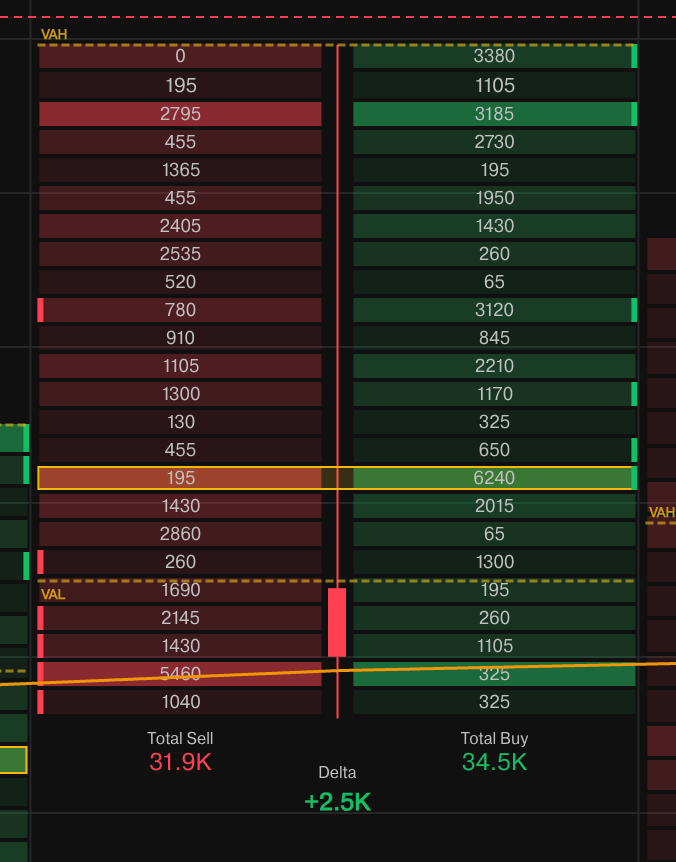
Order Flow displays aggressive buy volume and aggressive sell volume side by side for every price level inside a candle.
This is not a lagging indicator or derived calculation. It is based on actual executed trading activity.
Two candles may look identical on a chart but can tell completely different stories when viewed through Order Flow. Understanding where buyers and sellers were most active provides valuable context that price alone cannot offer.
The securities are quoted as an example and not as a recommendation.
Delta
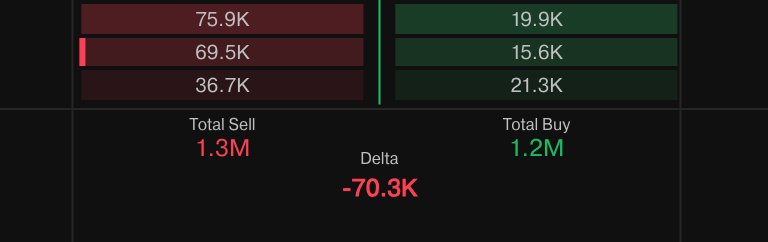
Delta measures the difference between total aggressive buy volume and total aggressive sell volume within a candle.
A positive Delta indicates buyers were more aggressive overall, while a negative Delta indicates sellers dominated.
One of the most useful observations comes when price and Delta diverge. A candle may close green while Delta remains strongly negative, suggesting underlying weakness despite higher prices.
Order Flow helps surface these insights directly on the chart.
The securities are quoted as an example and not as a recommendation.
Go Beyond the Basics
Point of Control (POC)
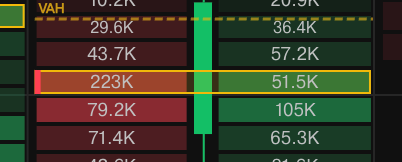
Point of Control represents the price level where the highest volume was traded within a candle.
This level often acts as an important reference point because it reflects where the most business was conducted between buyers and sellers.
Tracking how the POC shifts across candles can provide additional insight into trend strength and participation.
The securities are quoted as an example and not as a recommendation.
Value Area (VAH & VAL)
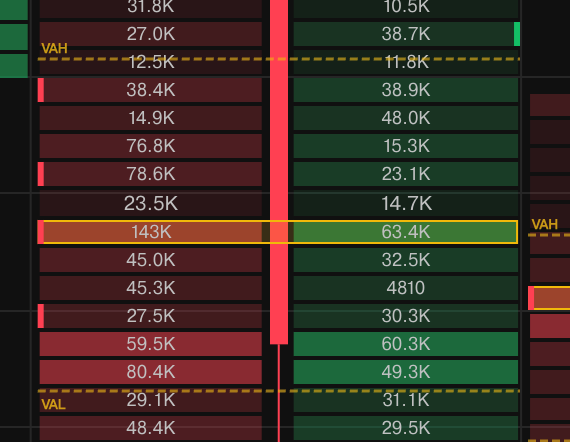
The Value Area represents the price range where approximately 70% of a candle's volume was traded.
The upper boundary is the Value Area High (VAH), while the lower boundary is the Value Area Low (VAL).
These levels help traders understand where market consensus was established and identify areas where price may move faster due to lower participation.
The securities are quoted as an example and not as a recommendation.
Imbalances
Imbalances highlight price levels where one side showed significantly greater aggression than the other.
By default, when buy volume is three times or more than the corresponding sell volume, or vice versa, the level is flagged as an imbalance.
These areas often indicate strong participation and can become important support or resistance zones when revisited.
The imbalance threshold can also be customized according to individual trading preferences.
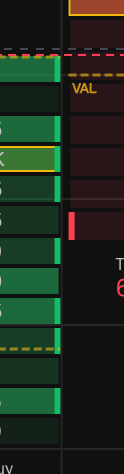
The securities are quoted as an example and not as a recommendation.
VWAP
VWAP, or Volume Weighted Average Price, represents the average traded price of the session weighted by volume.
Unlike a simple average, VWAP reflects where most trading activity has occurred during the day.
It provides valuable context for understanding whether buyers or sellers are controlling the session and can help traders align with the prevailing market flow.
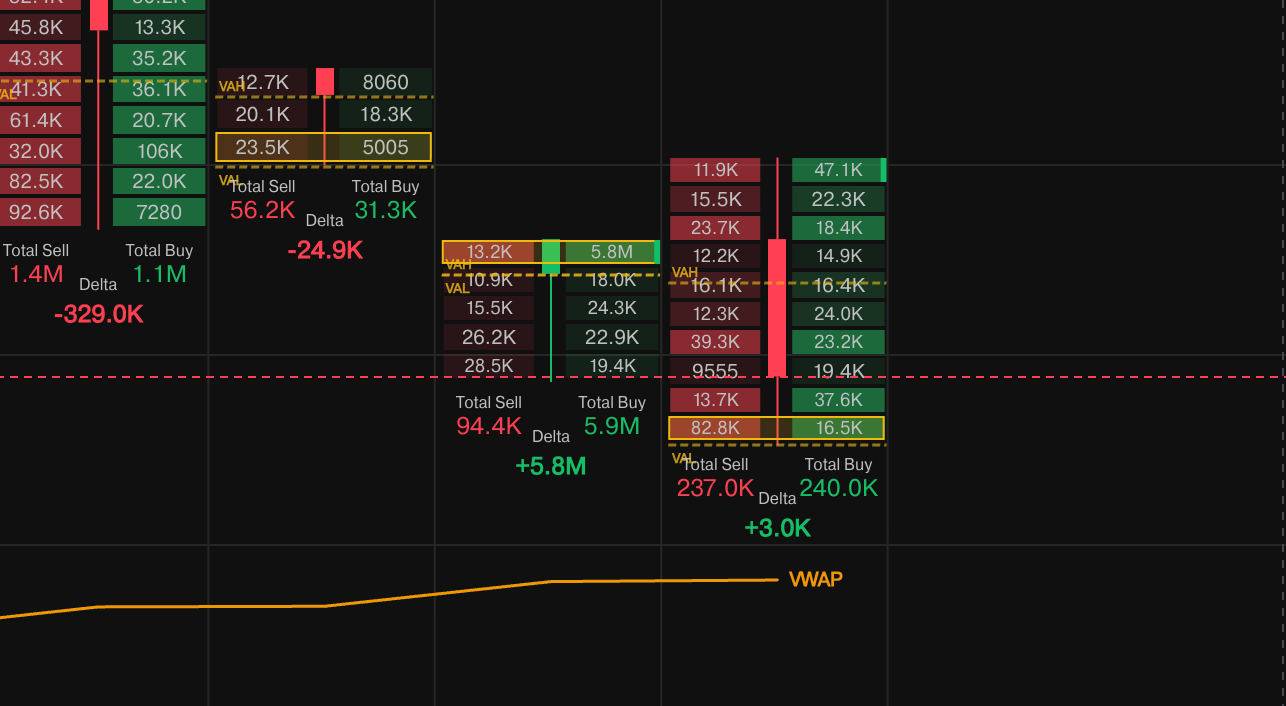
The securities are quoted as an example and not as a recommendation.
Volume Profile
Volume Profile provides a session-wide view of traded volume across different price levels.
High Volume Nodes identify areas where substantial trading activity occurred, while Low Volume Nodes highlight areas with relatively lower participation.
Understanding these zones helps traders assess where price may find support, resistance, acceptance, or acceleration.
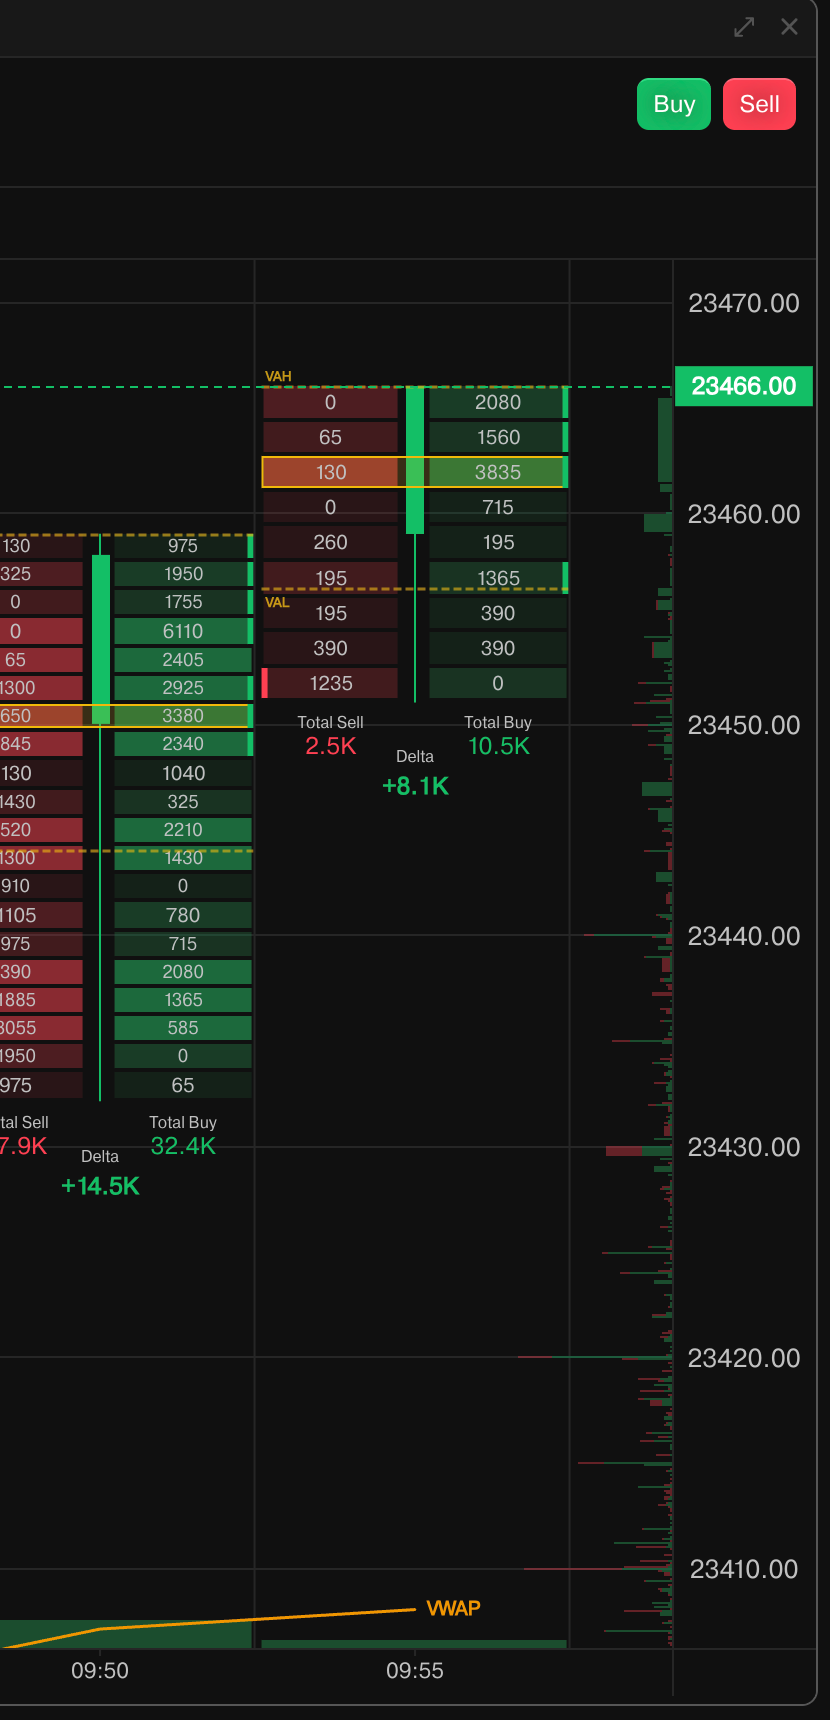
The securities are quoted as an example and not as a recommendation.Candle Trade Summary
Simply click on any candle to open the Candle Trade Summary window.
This provides a complete breakdown of the selected candle, including:
- Open, High, Low, and Close
- Total Volume
- Delta
- Point of Control (POC)
- Price-by-price Bid and Ask activity
- Delta at every price level
- Volume traded at every price level
Instead of analyzing only the candle's final shape, you can inspect exactly how buyers and sellers interacted throughout the move and identify where participation was concentrated.
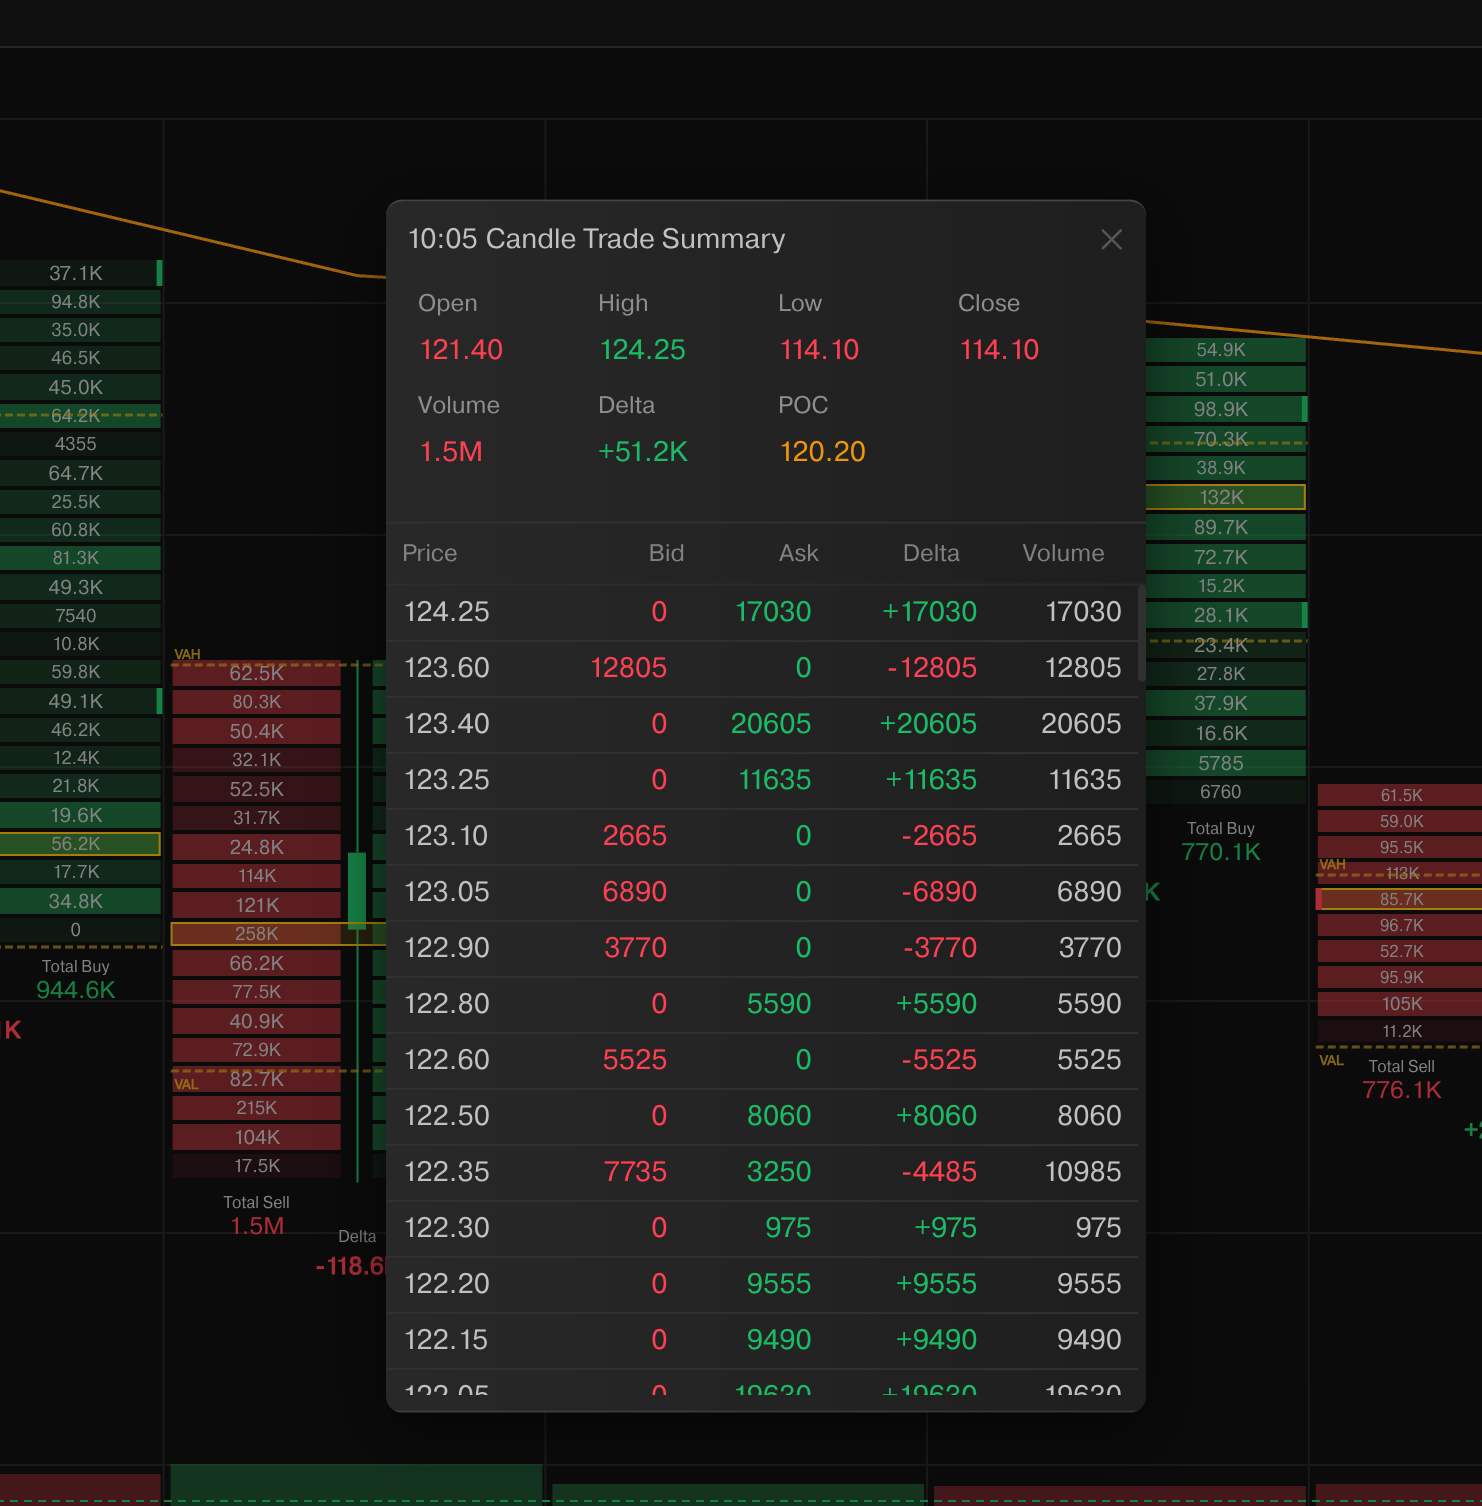
Zoom Into Every Candle
Want to investigate a candle more closely?
Simply press the Option (⌥) key and hover over any candle on the Order Flow chart.
This instantly zooms into the selected candle, making it easier to inspect individual price levels, imbalances, volume concentration, and buying or selling activity without disrupting your workflow.
Whether you're reviewing a breakout, a reversal, or a key support and resistance reaction, this allows you to move from a chart-level view to a detailed Order Flow view in seconds.
Built on Executed Trades, Not Intent
While building Order Flow for DEXT T3, one of the most important decisions was determining the data foundation behind it.
Some Order Flow solutions rely primarily on bid and ask data to estimate buying and selling pressure.
However, bid and ask data represents intent. Orders can appear and disappear within milliseconds.
We chose a different approach.
Order Flow on DEXT T3 is built using actual executed trades. Every number displayed is derived from real transactions occurring on the exchange.
This means traders are analyzing what actually happened in the market, not merely what participants intended to do.
To support this, we built a custom trade-level data pipeline capable of processing and visualizing execution data in real time while maintaining the performance standards expected from DEXT T3.
Integrated Directly into Your Trading Workspace
Order Flow is available directly within DEXT T3 and works alongside your charts inside the same workspace.
There is no need for separate software, external tools, or disconnected workflows.
You can analyze the candle, understand the activity within it, and take action from a single trading environment.
Built for Indian markets.Built for Indian traders.Built for a seamless trading experience.
How to Get Started
Getting started with Order Flow on DEXT T3 is simple:
- Open DEXT T3 on Windows, Mac, or Web
- Add the Order Flow widget to your workspace
- Place it alongside your charts
- Select your preferred instrument and timeframe
- Start analyzing buy and sell activity within every candle
See the candle.
See inside the candle.
Trade what's actually happening.