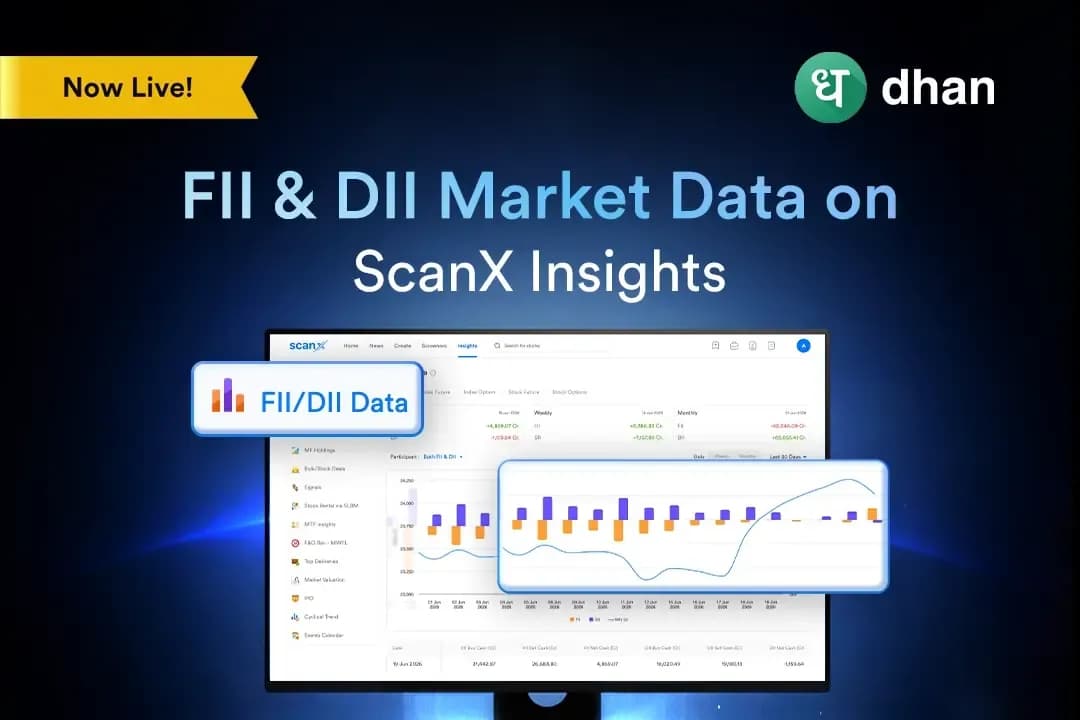
Stay ahead in the market with FII & DII Market Data on ScanX Insights





Key takeaways:
- It offers FII and DII activity across cash market participation and derivatives Open Interest data.
- You can view participation trends from Pro and Client categories for a complete picture of market activity.
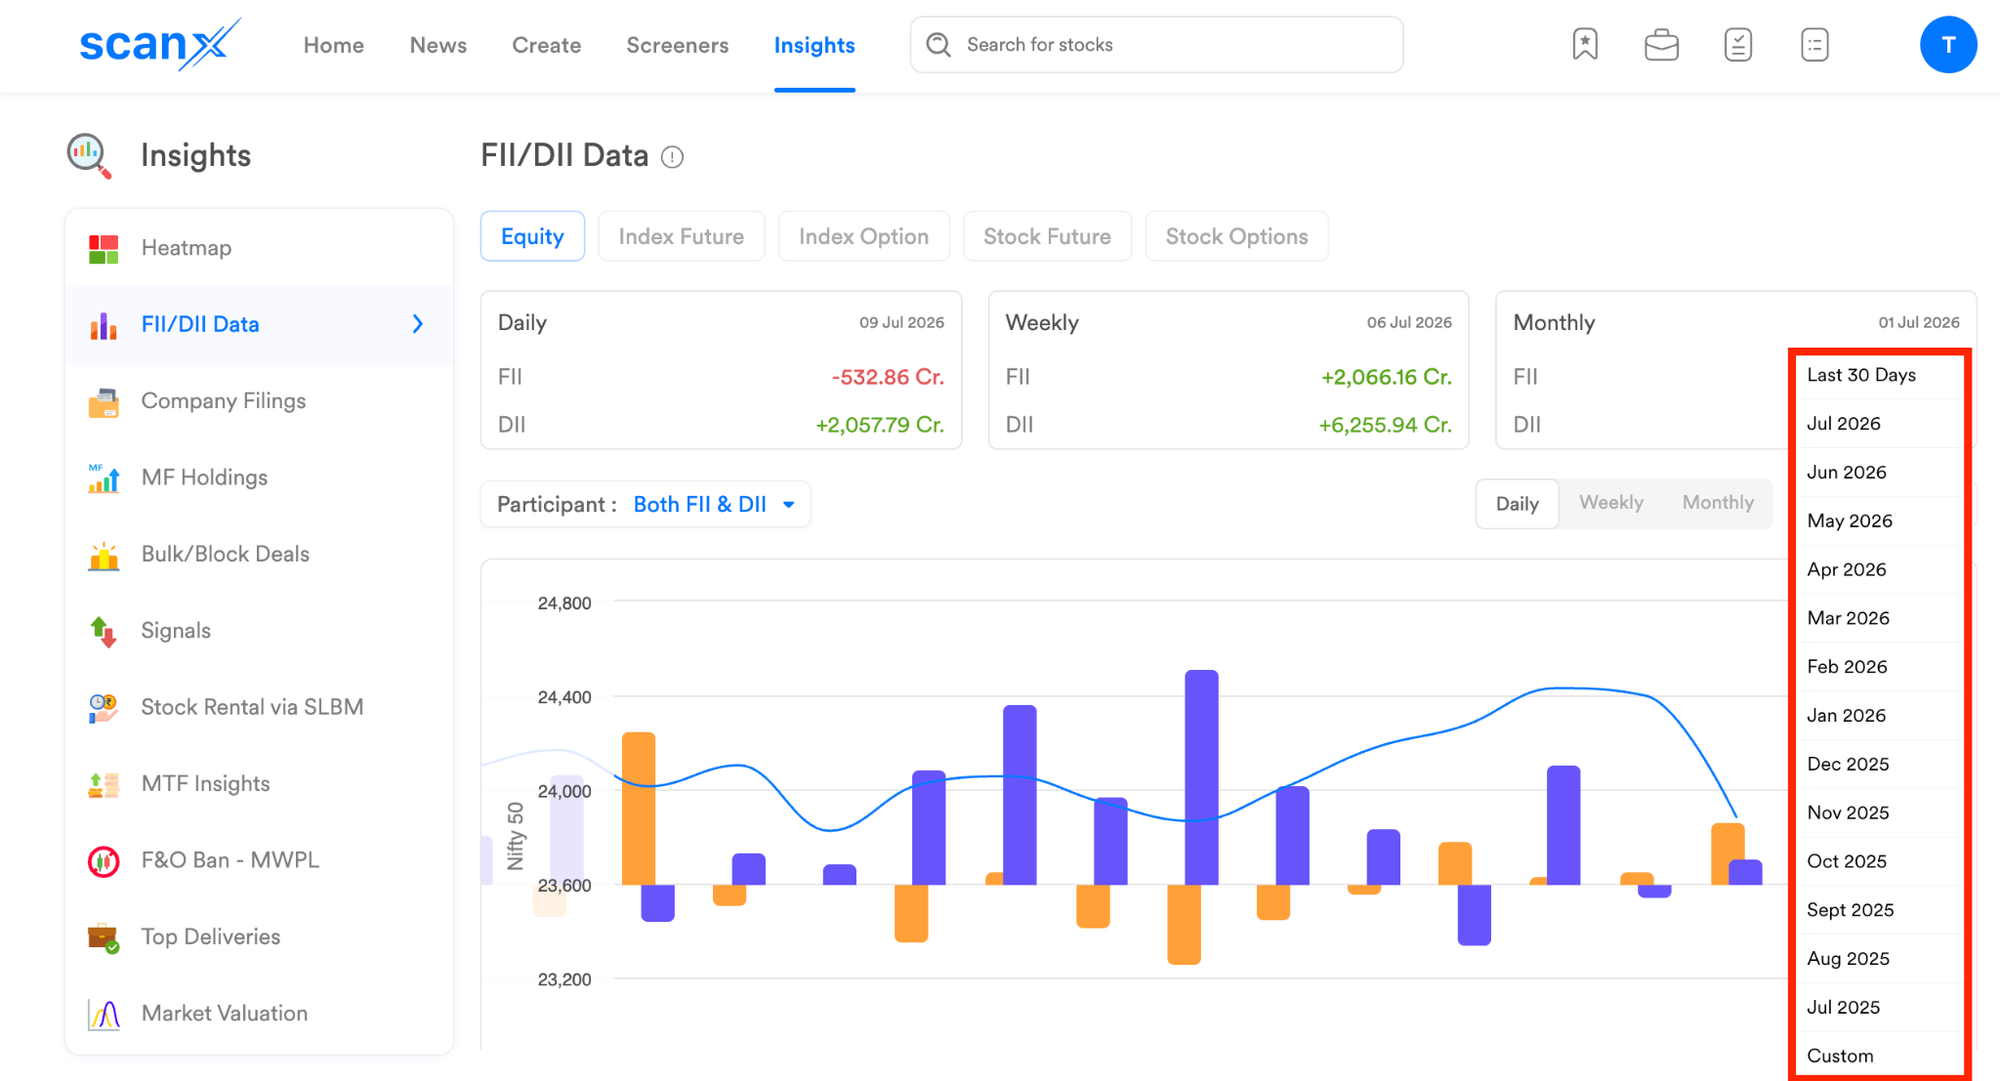
- You get access to six months of historical data along with the current activity to understand institutional trends over time.
- FII & DII Market Data is available directly within the Insights section on ScanX.
You have identified a potential opportunity, and, according to your analysis, the charts appear correct, the setup is clean, and you have prepared a suitable trading strategy to capitalise on it. But just as you enter the trade, the market moves in the opposite direction to your trade. You were correct about the stock, but the largest players were going the other way, thus placing the trade without knowing their direction led to losses for you.
Most traders and investors lack institutional activity as a part of their market context. To overcome this challenge, we have introduced FII & DII Market Data on ScanX Insights, which provides you with an overview of institutional market activity to help you make informed decisions.
What is FII & DII Market Data on ScanX Insights?
FII & DII Market Data on ScanX Insights allows you to monitor the market activity of Foreign Institutional Investors (FIIs) and Domestic Institutional Investors (DIIs). The feature offers their market activity across various segments, including cash market participation, derivatives Open Interest data, and participation trends for the Pro and Client categories.
Why does it matter?
You would have often experienced that even after analysing the market, sudden market moves still catch you off guard. The reason behind this is the institutional activity, which is often not available in a structured format in one place. FII & DII Market Data on ScanX Insights fills this void. It allows you to:
Understand the true market drivers
FIIs and DIIs account for the significant capital flow in the Indian stock markets. If FIIs are net buyers over several sessions, it indicates their confidence in the market's direction. If DIIs are buying and FIIs are selling, it implies that the domestic support is absorbing the FIIs' selling pressure. These insights help you understand the forces behind the current price movement, not just the movement itself.
Derivatives positioning alongside cash data
Open Interest data shows where institutions are building positions in futures and options. For example, if FII Open Interest is rising sharply during a rally, it indicates institutional confidence in the move, which cash market data cannot provide. Thus, when viewed together, it provides you with a complete picture of how institutional money is positioned.
Identifying trends, not just daily data points
A single day of institutional flow can reflect routine activity rather than a broader view. Thus, with FII & DII Market Data on ScanX Insights, you can monitor six months of historical data to help you determine whether current activity is part of a sustained trend or a one-time change. It helps you understand where large participants are deploying capital and making informed decisions.
How to access FII & DII Market Data on ScanX Insights?
Accessing FII & DII Market Data on ScanX Insights takes just a few steps:
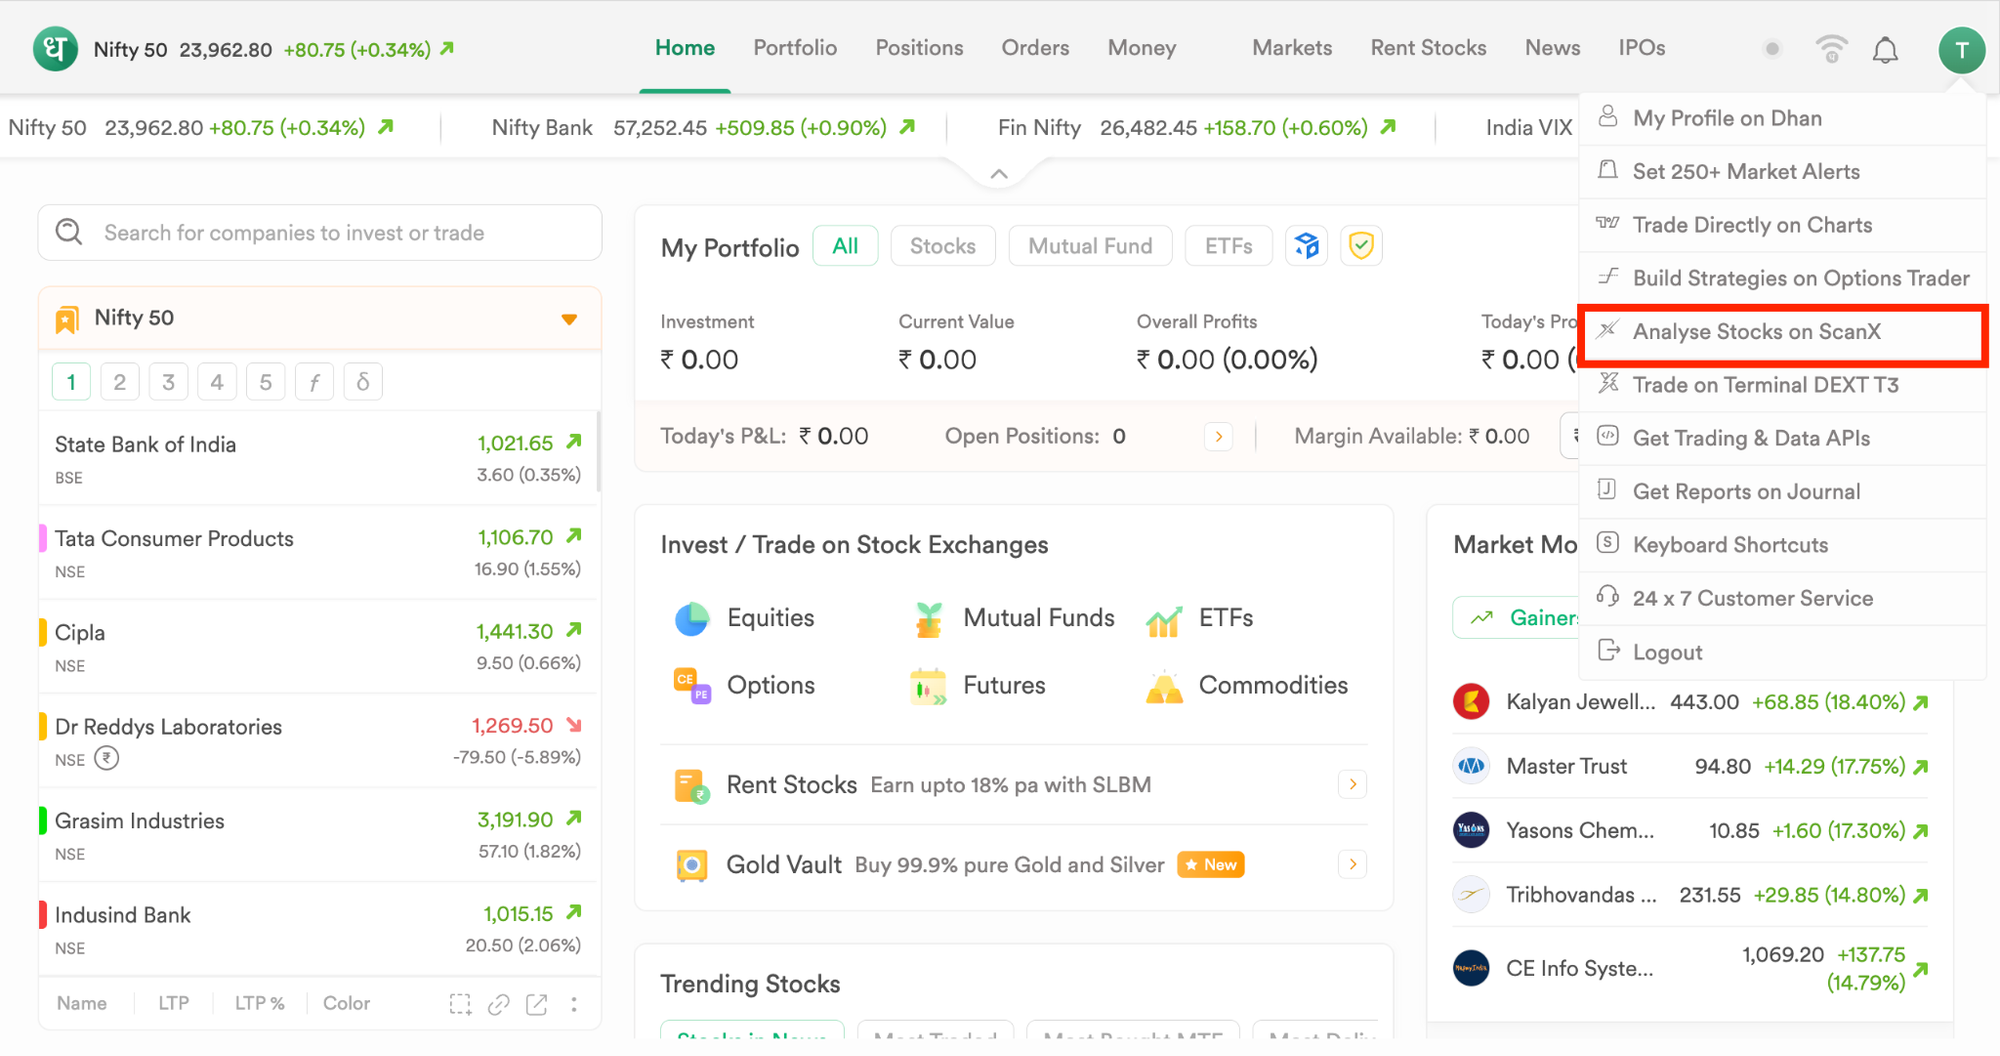
Step 1: On Dhan App or Dhan Web, select Analyse stocks on ScanX.
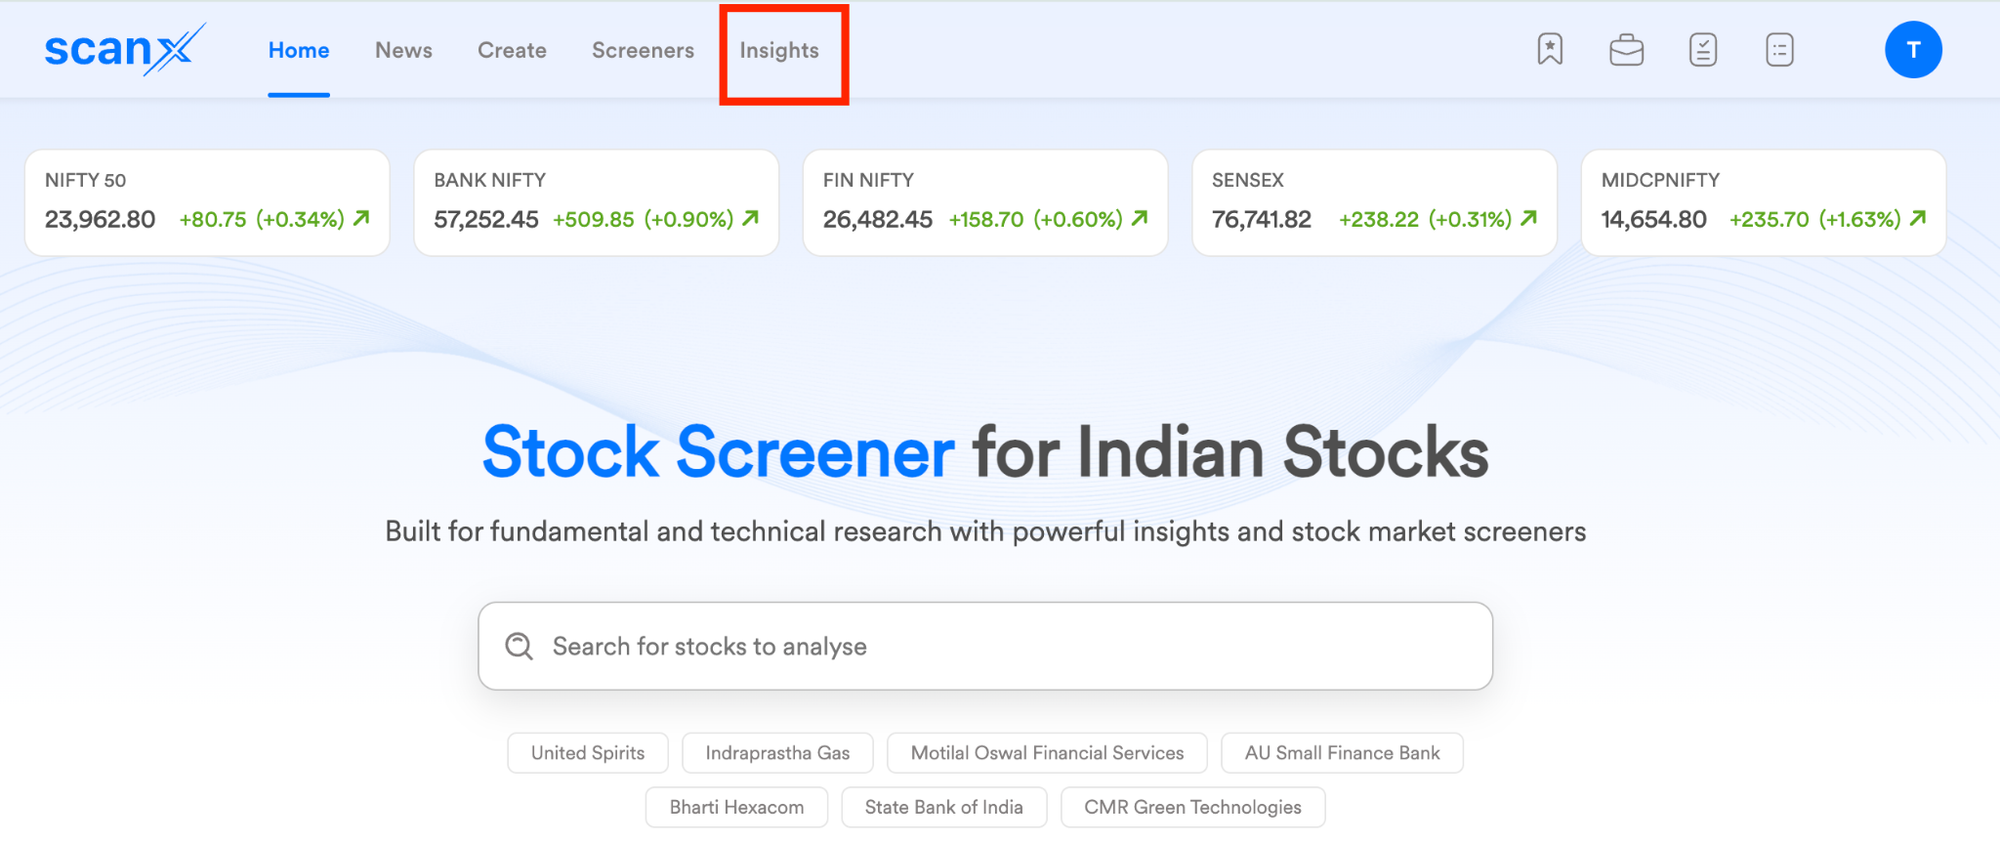
Step 2: Click on the insights tab on the ScanX homepage.
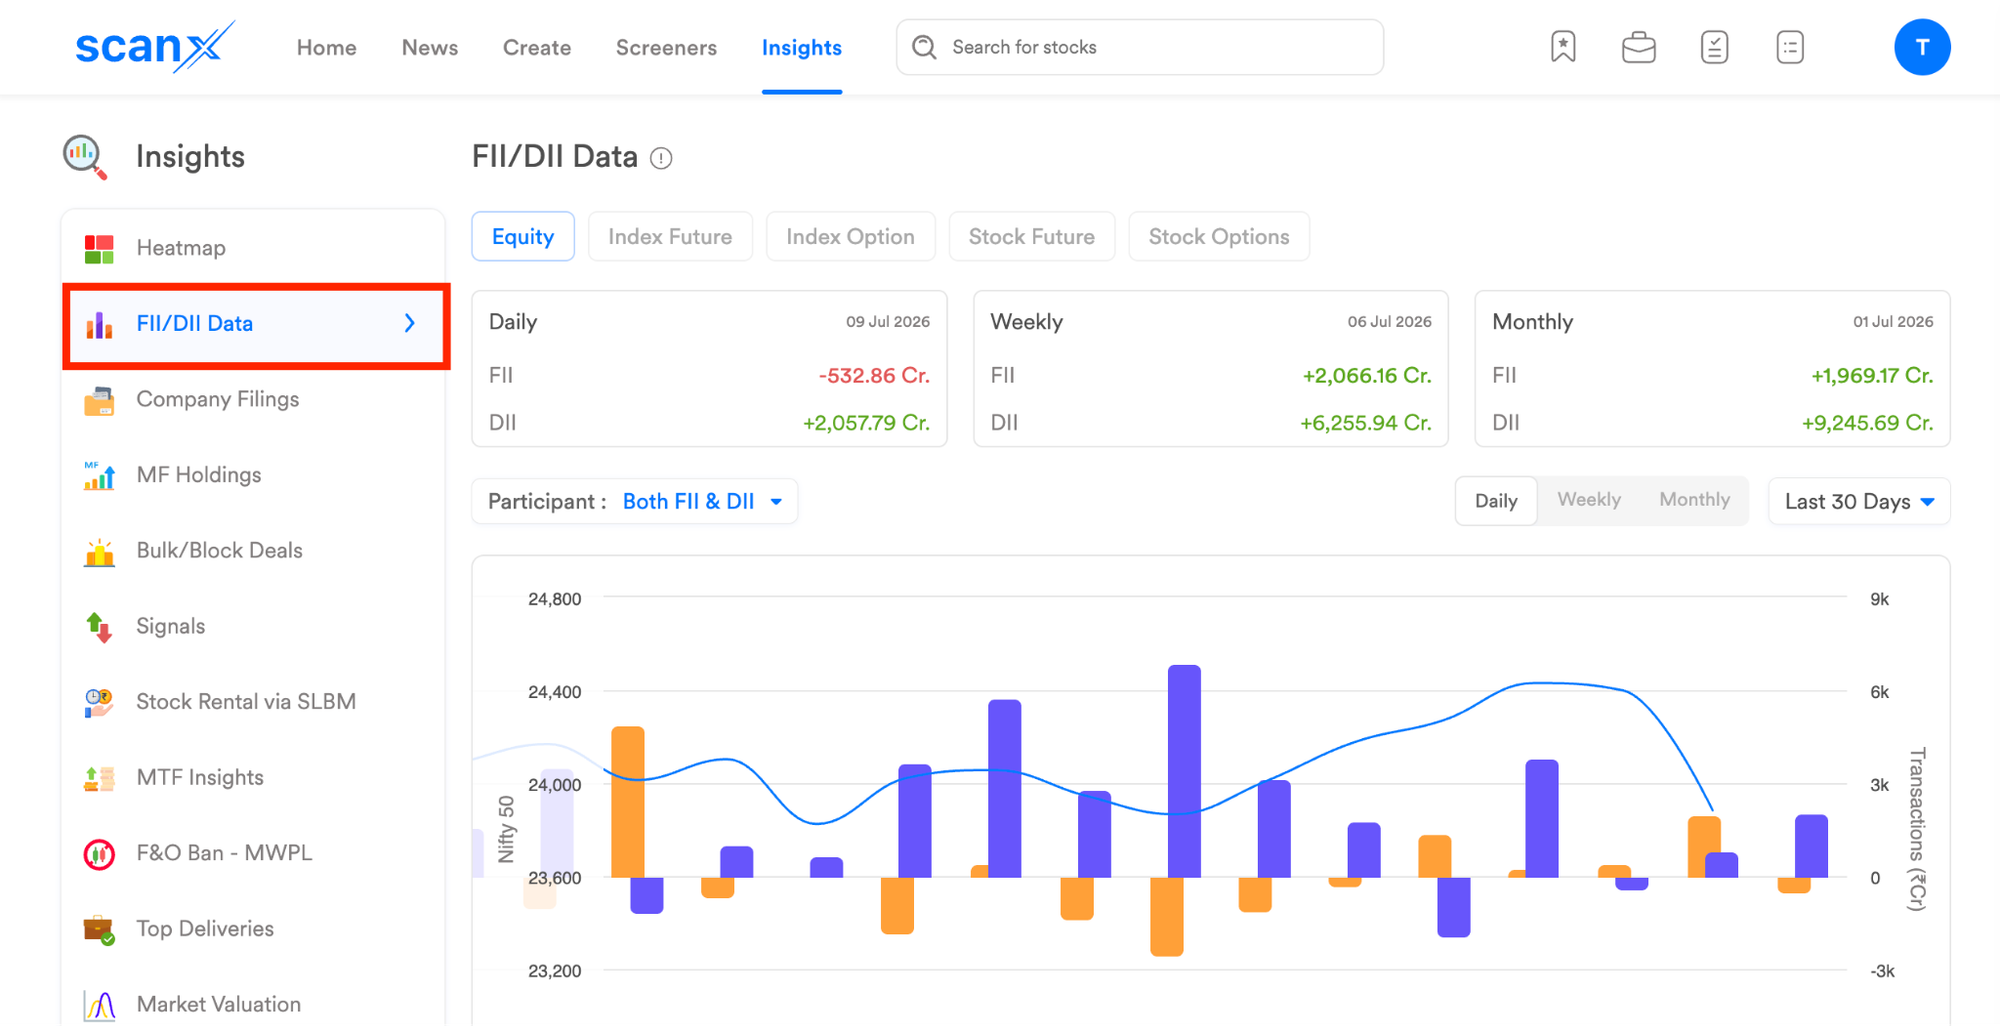
Step 3: Navigate to the FII & DII Data section within Insights.
Step 4: Select the segment and timeframe for which you want to view FIIs and DIIs' activity.
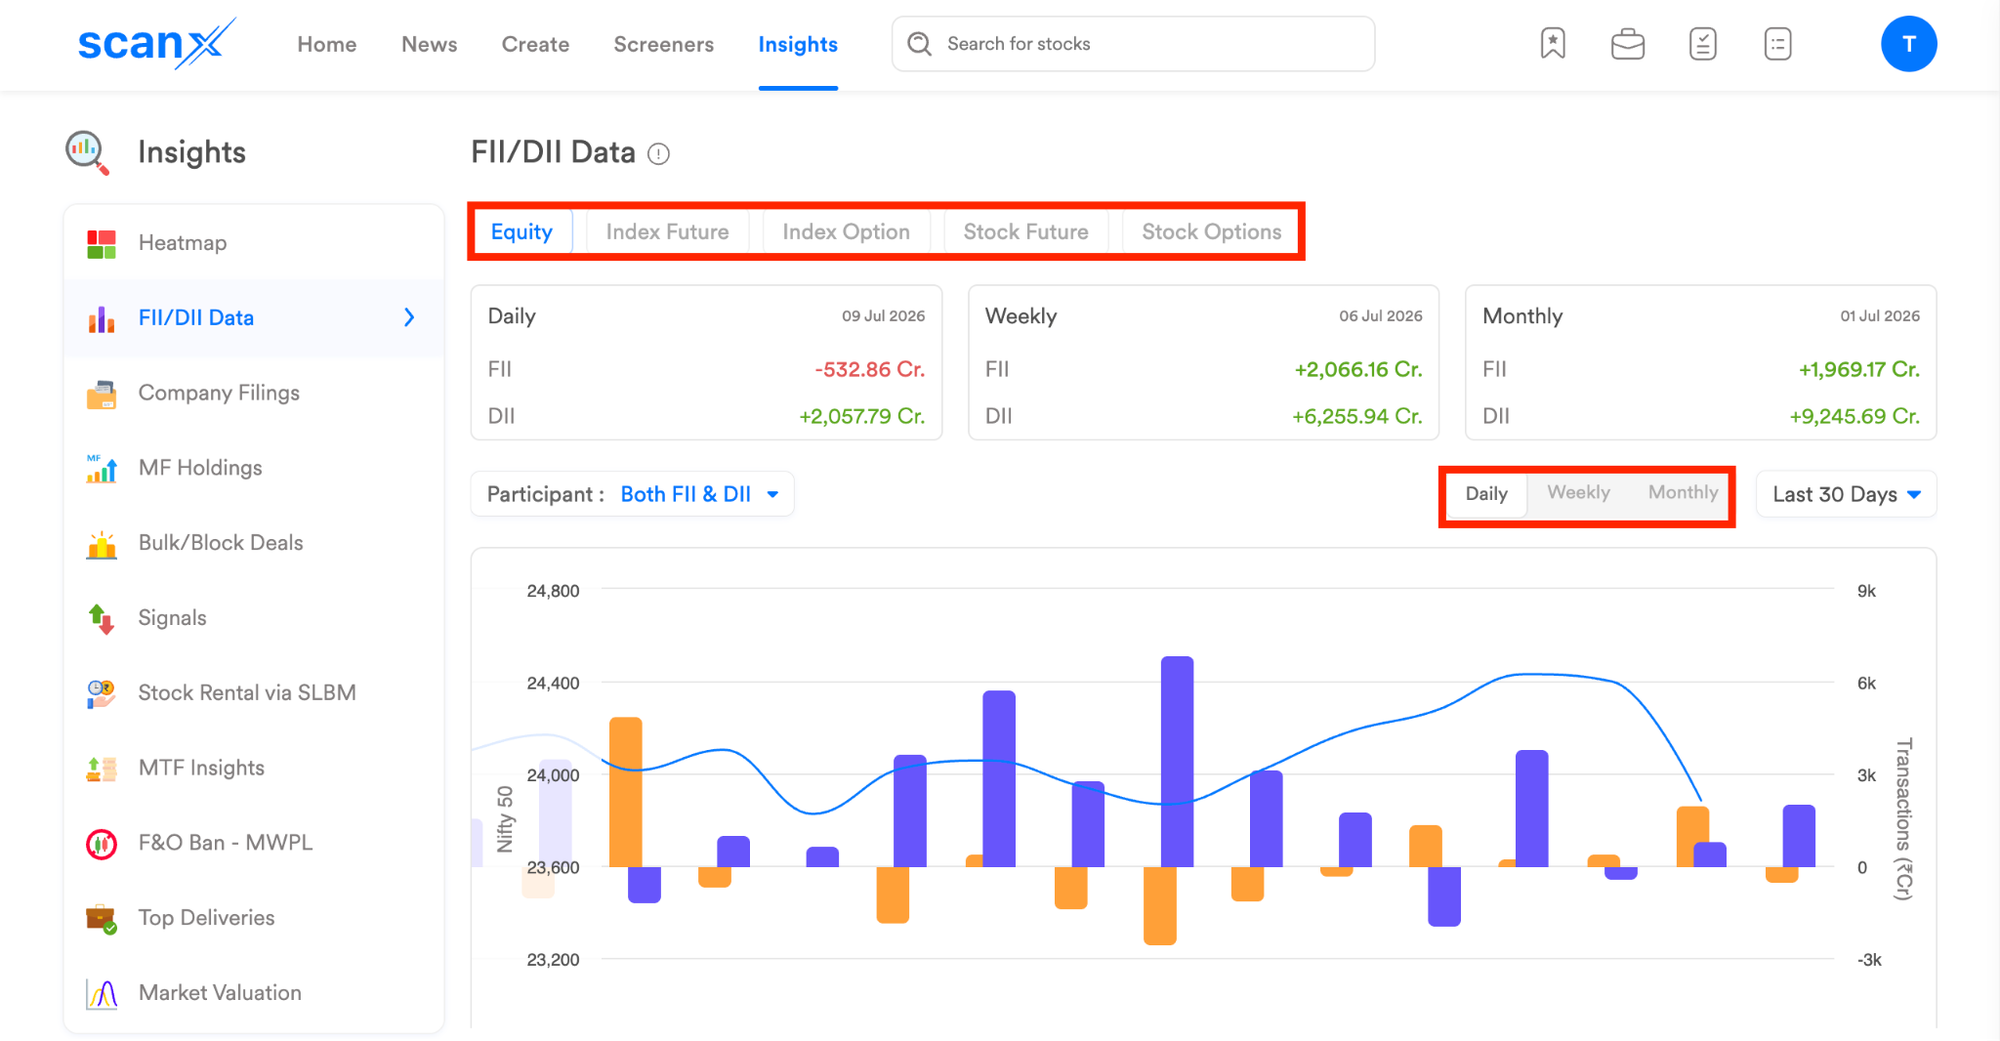
Step 5: Use the historical view to track participation trends across the previous months.
Key benefits of FII & DII Market Data
FII & DII Market Data on ScanX Insights offers you several benefits. Some of those are:
- Institutional flow visibility: You can gauge where large participants are deploying their capital across cash and derivatives markets.
- Historical analysis: You can view the past six months of FIIs and DIIs activity data, which helps you distinguish between short-term shifts and sustained directional moves.
- Complete participant view: You can view FIIs and DIIs' activity across the cash market, derivatives OI, and Pro and Client segments.
- Macro clarity: Institutional activity gives your analysis a comprehensive picture of overall market participation.
Use cases
Some practical use cases of FII & DII Market Data on ScanX Insights are:
For directional trading
Before entering a positional trade, you can check FII cash market flows alongside derivatives OI data. If FIIs have been net buyers for a few weeks and Open Interest is building on the long side, it provides a confirmation to an existing technical setup, thus providing a stronger foundation for your trade plan.
In taking long-term decisions
If you are looking to make a long-term investment in a specific equities sector, you can take a look at FII and DII trend data in that sector over the past six months to gauge whether the institutional sentiment supports that sector or not, thus helping you take informed positions and avoid entering at higher prices.
In options trading
While trading, you can overlay FII derivatives OI data with your market view. A significant build-up in FII short positions on index futures during a rally can serve as an early signal to review your trade, even when the technical picture still looks bullish.
Conclusion
Dhan's FII & DII Market Data on ScanX Insights provides you with a structured, consolidated view of how institutional participants are positioned in the market. By bringing together cash market activity, derivatives OI, and broader participant categories, such as the Pro and Client segments, with their 6 months of historical trends into a single interface, it gives you a complete view of overall market participation and sentiment trends.
Ultimately, it closes the gap in decision-making by showing where the largest players in the market are actually allocating their capital.