


Top Ratios used in Value Investing




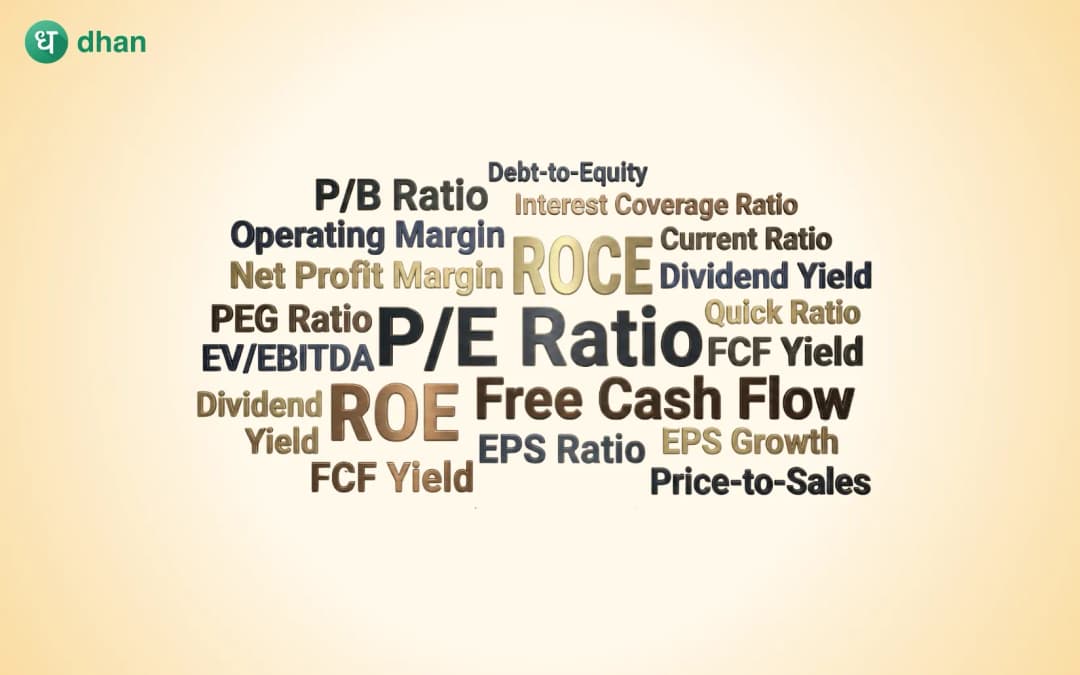




Value investing is based on simple ratios that help you tell whether you’re paying a fair price for a company’s earnings, assets, and cash flows before you hit the buy button. To get the best results, you need to compare a company with sector peers and track trends. You also need to avoid apples-to-oranges comparisons to analyse accurately. In this article, we’ll discuss the top ratios you can use for value investing.
How to read ratios?
You can't get the full story from one ratio; you need a set of different valuation, profitability, leverage, and liquidity ratios to check in with each other on the quality and price of a certain stock. Best ratios for value investing are only as good as the comparison made, so line them up against the same industry and consider multi‑year trajectories.
Looking for P/E, P/B, ROE, ROCE, and other value investing ratios can be a tideous task we recommend using stock screeners which offers ready-made screeners with live insights. You can check a company’s financial metrics on Dhan and make wise decisions easily.
Now, let’s discuss the best ratios for value investing you must analyse for making smart decisions:
1. P/E Ratio
The P/E ratio (Price-to-Earnings) is used to indicate how much investors are ready to pay per rupee of the earnings of any company. A low P/E usually signals a greater value, provided that the earnings are sound and viable.
Formula:
P/E = Price per Share/Earnings per Share
Compare the P/E ratio to industry peers to gain insights regarding the company, whether it is overvalued, undervalued, or fairly valued.
2. P/B Ratio
The P/B ratio(Price-to-Book Value) is a comparative ratio between the market price of a company and the book value of a company, which is the value of its assets in the balance sheet. It is particularly beneficial to banks, insurers, and asset-heavy companies.
Formula:
P/B = Price per Share/Book Value per Share
A P/B Ratio of less than 1 can be a sign of undervaluation, but it is advisable to first verify the quality of assets and profitability.
Difference between P/E and P/B ratio explained in detail.
3. EBITDA Margin
The EBITDA margin is the operating profitability before non‑cash charges; track it versus peers and time.
Formula:
EBITDA Margin = EBITDA/Operating Revenue
Increased margins mean improved cost control and price power. Make comparisons across time and with peers to identify trends.
4. Current Ratio
The Current Ratio shows how easily a company can pay its short-term debts using its short-term assets. It indicates how well the company operates and how liquid it is.
Formula:
Current Ratio = Current Assets/Current Liabilities
A range of 1.5–3 is often considered healthy, but inventory quality and receivable turns matter just as much.
5. Dividend Yield
This ratio shows the extent to which shareholders get cash back in the form of dividends, depending on the price of the stock. It is important to income-oriented investors.
Formula:
Dividend Yield = Annual Dividend per Share/Current Price×100
Companies pay high yields only when the dividends are supported by strong cash flows. Thus, ₹20 annual dividend on a ₹400 share implies a 5% yield, but you will also have to confirm payout sustainability via coverage and cash flows.
6. ROE(Return on Equity)
ROE indicates the efficiency with which a company utilises the funds of shareholders to make profits. It is one of the most important indicators of the quality of management and the strength of businesses.
Formula:
ROE = Net Income/Shareholders’ Equity
A high ROE is an indicator of a competitive advantage or moat. However, when high ROE is associated with high debt, the same can be unsustainable.
7. Debt‑to‑Equity
The ratio indicates the proportion of debt to equity financing of a company. It is a financial leverage and risk measure.
Formula:
D/E = Total Debt/Shareholders’ Equity
Low D/E implies reduced risks and healthy financial conditions. Investors often use it together with the interest coverage ratio to determine whether income is sufficient to cover debt.
8. ROCE(Return on Capital Employed)
ROCE is used to evaluate the efficiency with which an organisation uses all capital, both debt and equity, to make profits. It is more usable in comparing companies that have different leverage levels.
Formula:
ROCE = Profit Before Interest and Taxes/Debt (Short+Long) + Equity
An increase in the ROCE with constant margins and good reinvestment capacity is a good indication of value generation in the long run.
9. PEG Ratio(Price/Earnings to Growth)
The PEG ratio is the growth‑adjusted P/E. It allows investors to avoid low P/E traps in slow-growing companies and identify reasonably valued growth opportunities.
Formula:
PEG = (P/E)/EPS Growth Rate
A PEG near 1 is often cited as “fair,” but you should check the company’s growth quality and cyclicality before relying on a single threshold.
That said,
- Always compare ratios of the same sector and consolidated numbers for diversified groups if possible.
- Mix valuation with quality: i.e., combine low EV/EBITDA or P/E with good ROE/ROCE and clean D/E to obtain a value without compromising durability.
- Map yields and payouts to cash flow reality; dividend yield without coverage is a mirage in value portfolios.
Conclusion
Use a core kit of P/E, P/B, EV/EBITDA, PEG, dividend yield, ROE, ROCE, D/E, and current ratio to judge price vs. quality, then validate with peer and trend checks. Remember that definitions and methodologies matter even when using the best ratios for value investing, so read the fine print before you make your comparisons.
You can use tools like Dhan’s ScanX to turn ratio logic into a watchlist.
FAQ's on Ratios used in Value Investing
1. How are ROE and ROCE helpful in identifying quality companies?
The two ratios are measures of efficiency and profitability. ROE (Return on Equity) determines the amount of profit that a company has earned on the shareholder funds. ROCE (Return on Capital Employed) is a combination of debt and equity and gives a more detailed view of how efficiently the total capital is being used.
2. What is an important ratio for value investors, the P/E or P/B Ratio?
Both P/E (Price-to-Earnings) and P/B (Price-to-Book) ratios are valuable, yet the relevance of the ratios varies by industry and company type. It is suitable when the P/E Ratio is used to analyse profit-driven firms with stable earnings (FMCG or IT). Asset-intensive businesses such as banks, insurers, or real estate businesses can be better analysed using the P/B Ratio. The two usually give a better valuation picture when combined.
3. What is the difference between the P/E ratio and the EV/EBITDA ratio?
The P/E ratio is sensitive to the equity value against the earnings per share and therefore is handy in comparing companies of the same capital structure. Instead, the EV/EBITDA ratio considers enterprise value (equity + debt) and operating profit, providing an analogy between firms of varying levels of debt. Consequently, EV/EBITDA is frequently applied in cross-corporate or cross-industry analysis.
4. What is the purpose of financial ratios in value investing?
Financial ratios are applied to get an idea of whether the stock of a company is fairly priced when measured against the earnings of the company, its assets, and its cash flows. They transform complex financial data into comparable measures.
5. Are ratios enough to be used by investors to make buy or sell decisions?
No. Ratios are not complete answers. They assist in determining potential opportunities or red flags. Investors use a combination of ratio analysis and qualitative checks to make balanced investment choices.