Best Moving Averages for Day Trading








Moving average is one of the most used trading indicators for intraday trading. In day trading, traders have to capture small moves and make quick decisions. But on a short timeframe, prices fluctuate constantly and are difficult to understand. Moving averages simplify these moves and realtime market direction.
Traders use moving averages to identify trend direction, momentum, and spot potential entry and exit points. Moving averages appear simple, but can be very useful when correctly used. This article will help you to understand moving averages, their types, and the best moving averages for day trading, and how to use them practically.
What is a Moving Average?
Moving Average (MA) is a technical indicator that calculates the average price of the stock over a specific period and smooths out the price data. Moving average does not react to every small price change. It helps the trader to get clarity on the larger trend behind small price movements.
For example, a 20-period moving average can show the average price of the last 20 candles. As a new candle forms on the chart, it drops the oldest candle and calculates a new average value, and the average continues.
Many traders consider the moving average as a lagging indicator, meaning they show the past data and do not predict future values. Although for day trading, this is acceptable, as traders try to trade with the trend. On lower timeframes, moving averages reduce noise and provide clear price action.
Types of Moving Averages used in day trading
Traders use various types of moving averages for different trading styles and for different timeframes. The following moving averages are used primarily for day trading.
Simple Moving Average (SMA)
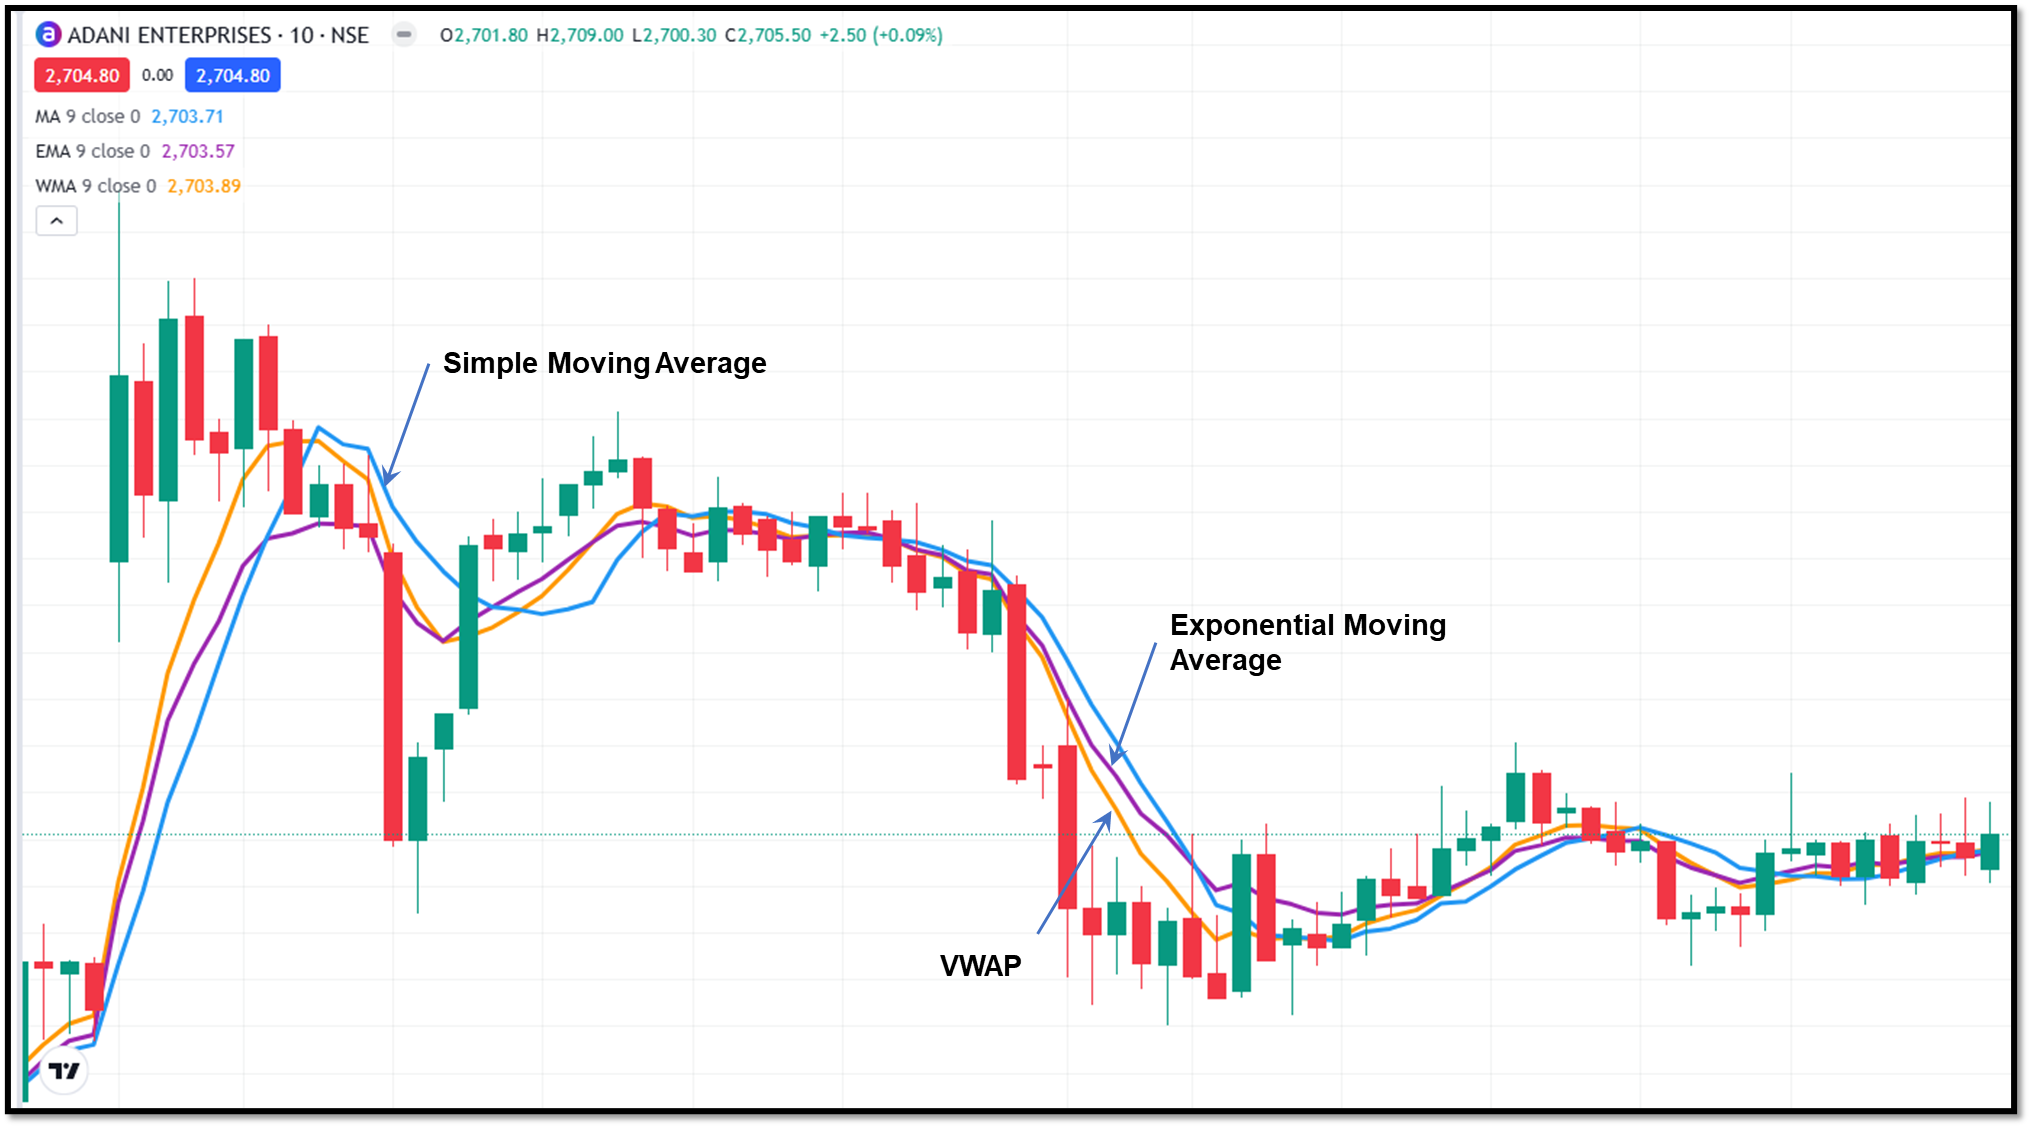
A simple moving average is calculated by averaging all closing prices of a specified period. SMA gives equal weight to all points, due to which its responsiveness is much slower than EMA. SMA is useful for identifying broader trend directions. SMA is considered very slow for day trading, but traders use it as a reference level instead of using it as an entry tool.
Exponential Moving Average (EMA)
An exponential moving average gives more weight to recent price points, which makes it more responsive to price changes. EMAs adapt quickly to momentum shifts, which is why day traders prefer the EMA. Also, EMA is more suitable for intraday entries and pullbacks.
Weighted Moving Average (WMA)
Similar to EMA, the weighted moving average also gives more weight to recent price points, but it uses linear weighting instead of exponential weighting. WMA has slower responsiveness than EMA but higher than the SMA. Traders use it to identify intermediate price changes.
Top moving average settings for day traders
The following moving average settings are seen as the best moving averages for day trading by most professional traders. Although there is no single moving average setting for all traders, they need to choose according to their trading style and comfort level.
9 EMA - For fast momentum trading
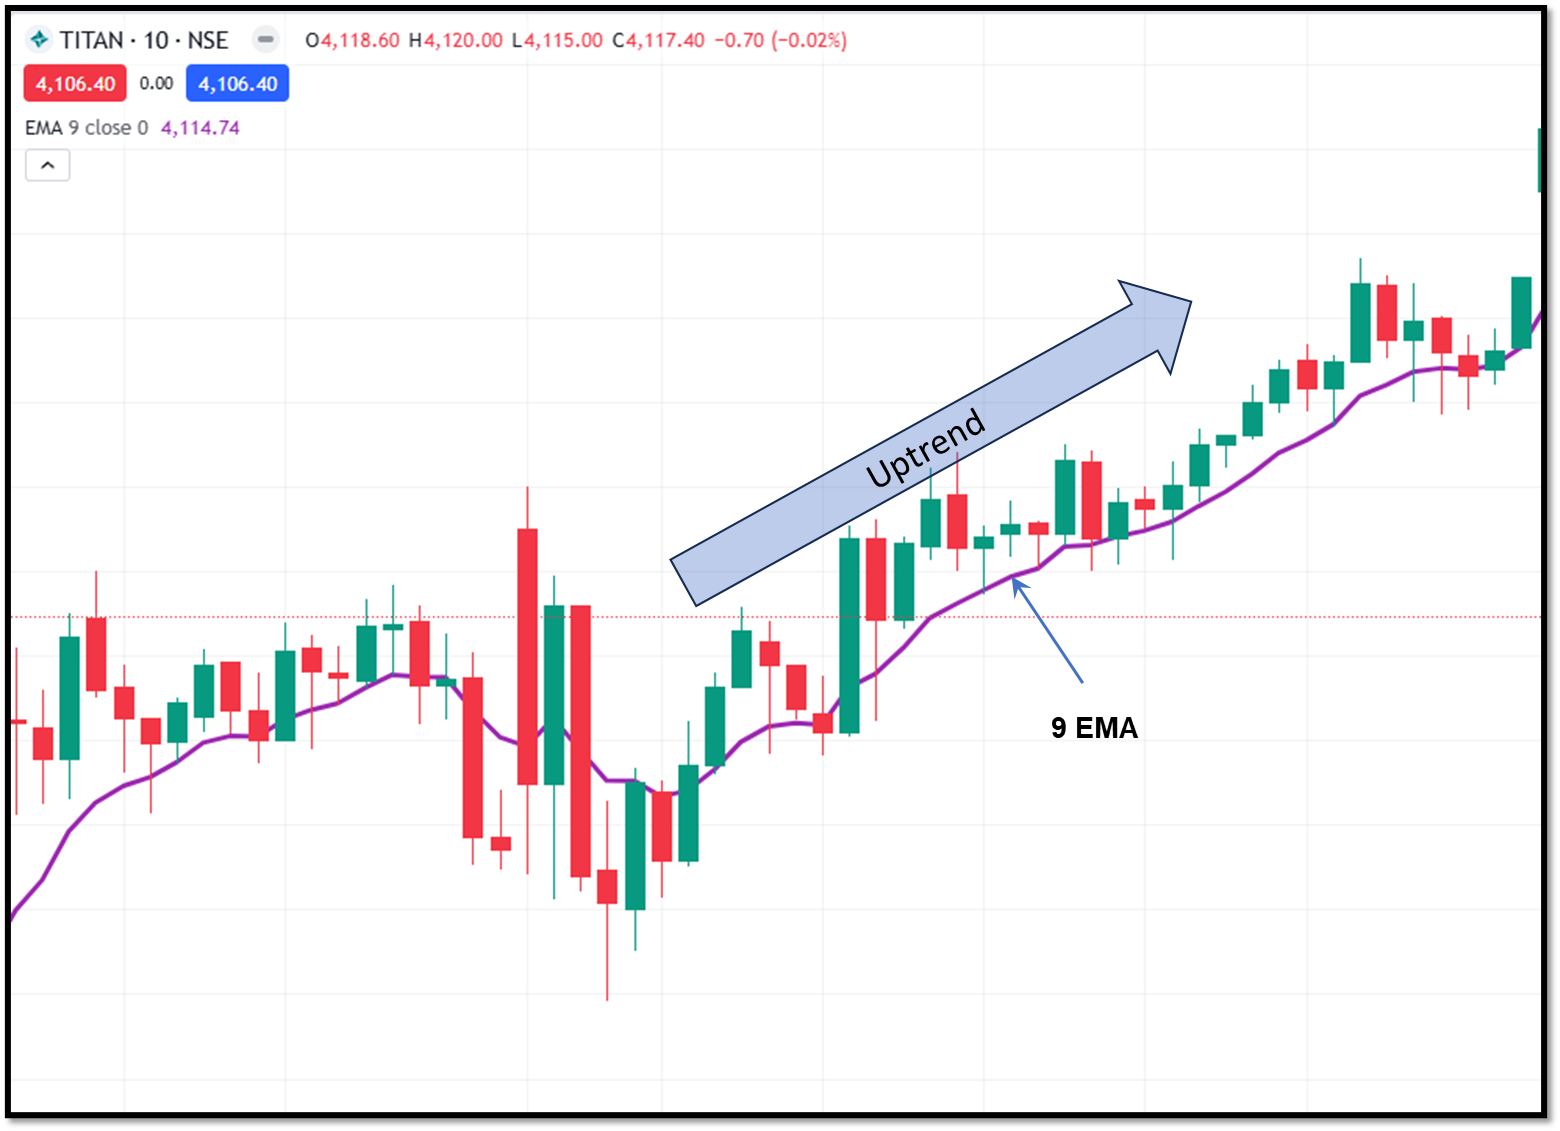
9 EMA is the most common setting for momentum traders. It is extremely fast, and traders use it to identify micro trends. If the price stays above the 9 EMA line for a longer duration (in an uptrend), then it is a sign of strong momentum. In such a situation, price tries to pull back and touch the 9 EMA line. If it bounces, it provides a low-risk entry point for traders.
Traders prefer to see the 9 EMA on a 1-minute or 5-minute chart, but it tends to generate false signals during a sideways market.
21 EMA - Short-term trend confirmation
The 21 EMA is popular among day traders as it strikes a balance between speed and stability. Which makes it more suitable for identifying short-term trends. Traders use the 9 EMA as the ‘Trigger’ and the 21 EMA as the ‘Filter’.
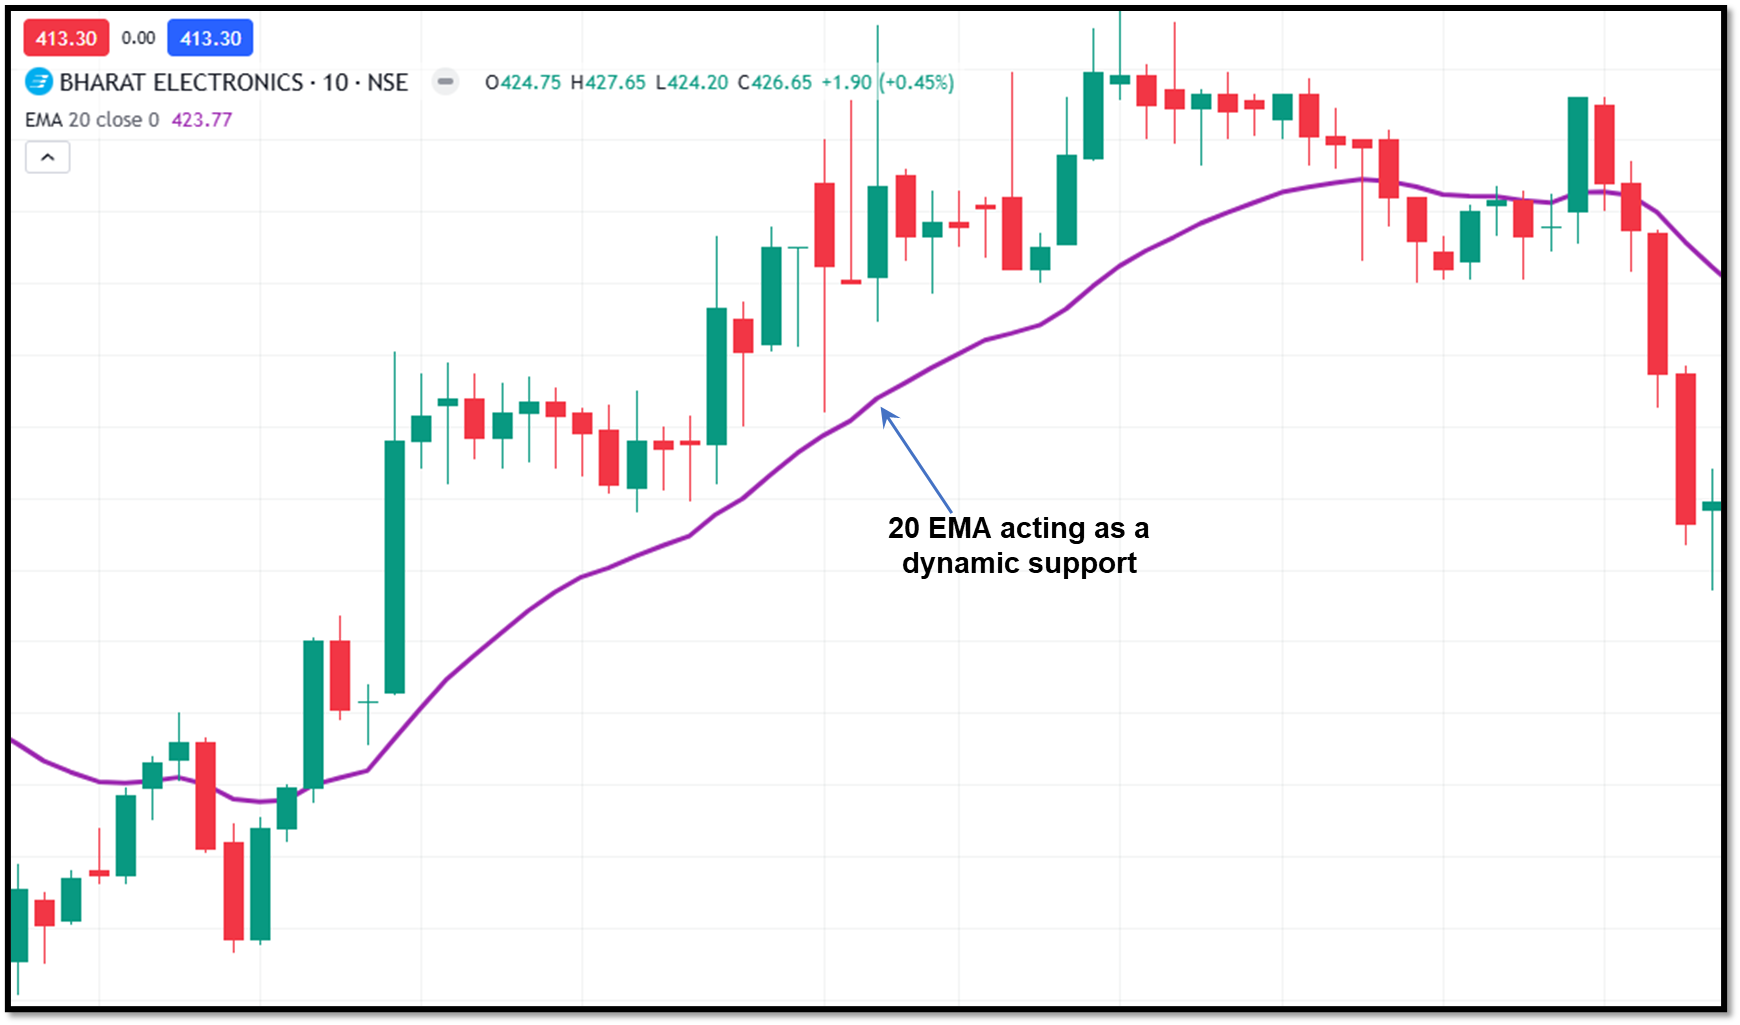
Also, 21 EMA is used as a dynamic support or resistance level. Pullbacks toward the 21 EMA in a trending market often provide high-probability trade setups.
50 SMA - Trend direction filter
Traders use the 50 SMA to determine the overall day trend. When the price stays above the 50 SMA line for a longer duration represents bullish sentiment. If the price stays below the 50 SMA line, it represents bearish sentiment.
200 SMA - Major trend and market bias
The 200 SMA is one of the important moving averages in trading. It showcases the long-term trend and is closely monitored by institutional and experienced traders.
Many traders use the 200 SMA as a key support and resistance in day trading. When you take a trade in the direction of the price relative to the 200 SMA, your probability generally improves.
Moving average combinations for day trading
Instead of using a single moving average, traders use multiple combinations of moving averages for different market conditions or trading styles. Some of the key combinations are listed below:
- 9 EMA + 21 EMA - This combination is used mostly for scalping and momentum-based trades.
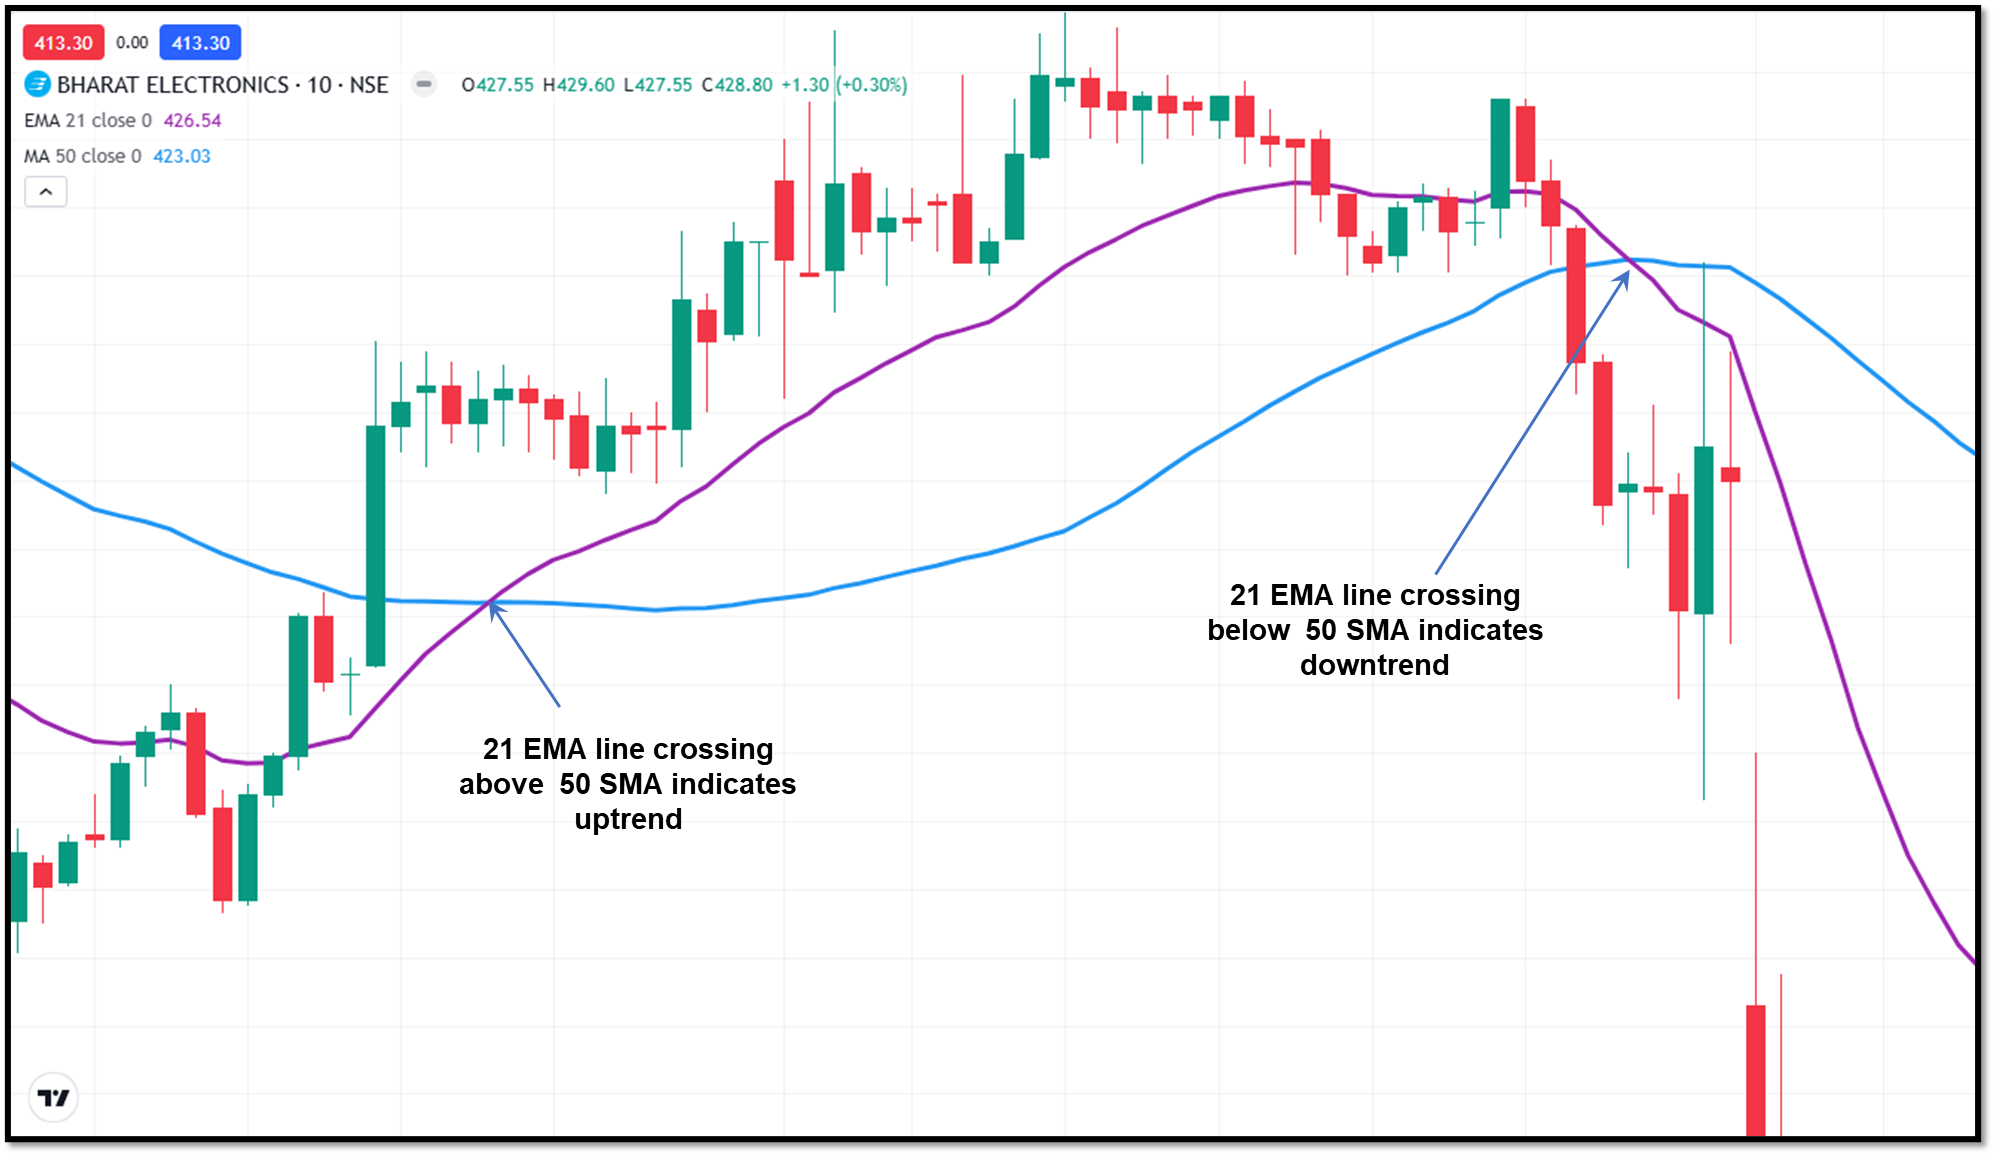
- 21 EMA + 50 SMA - This is the most popular trend following intraday combination.
- 50 EMA + 200 SMA - Traders use this combination to filter out trades and market bias.
Many advanced platforms, like Dhan, offer features to display two or more indicators on the same screen.
Use of moving averages in day trading
Moving averages can be interpreted in several ways depending on how the price interacts with them. Below are some of the key signals traders commonly derive from different moving average positions.
Trend identification
Moving averages are commonly used for identifying trend direction. When the price stays above the moving average line for an extended period, facing upward, it indicates the market is bullish. When the price is below the moving average, facing downward, it indicates a bearish trend.
Dynamic support and resistance
In a trending market, the moving average acts as dynamic support and resistance. Traders analyse how the price is acting near the 20 EMA and 50 EMA /SMA lines. In trending markets, prices may react near key moving averages, making them a popular point of reference, but not always a reversal.
Moving average crossovers
A crossover happens when a faster-moving average crosses slower moving average from below or above. Most of the time, a crossover indicates a change in the trend, although a trader should be careful about them during range-bound markets because it makes many false signals.
Final thoughts
Moving averages are one of the most widely used trading indicators by professional traders. Although it is a lagging indicator, traders primarily use it for trend identification and simplifying price moves. There is no single moving average that can work for all market conditions and all trading styles, but traders need to choose a combination of moving averages that suits their trading style and market situation.
FAQs
Which moving average is best for day trading?
There is no single best moving average for day trading, but many traders use 9 EMA, 21 EMA, and 50 SMA and their combinations during day trading.
Why do day traders prefer EMAs over SMAs?
During day trading, time matters the most. EMAs are more responsive than the SMAs, which help traders with quick trend formation and entry exit zones. This is the major reason day traders prefer EMAs.
Which timeframe works best with moving averages in day trading?
Many traders who day trade with moving averages use a 5-minute time frame. Scalpers may use the 1-minute chart, but traders looking for less noise to confirm setups on the 15-minute chart.
Is the 200 SMA important for intraday trading?
Yes, the 200 SMA is widely followed and helps identify the overall market bias. Traders usually trade in the direction of the 200 SMA line.
Should beginners start with moving averages for day trading?
Yes. Moving averages are the most beginner-friendly indicators. However, beginners should focus on understanding how the price behaves around key moving averages.