Bullish Harami Pattern




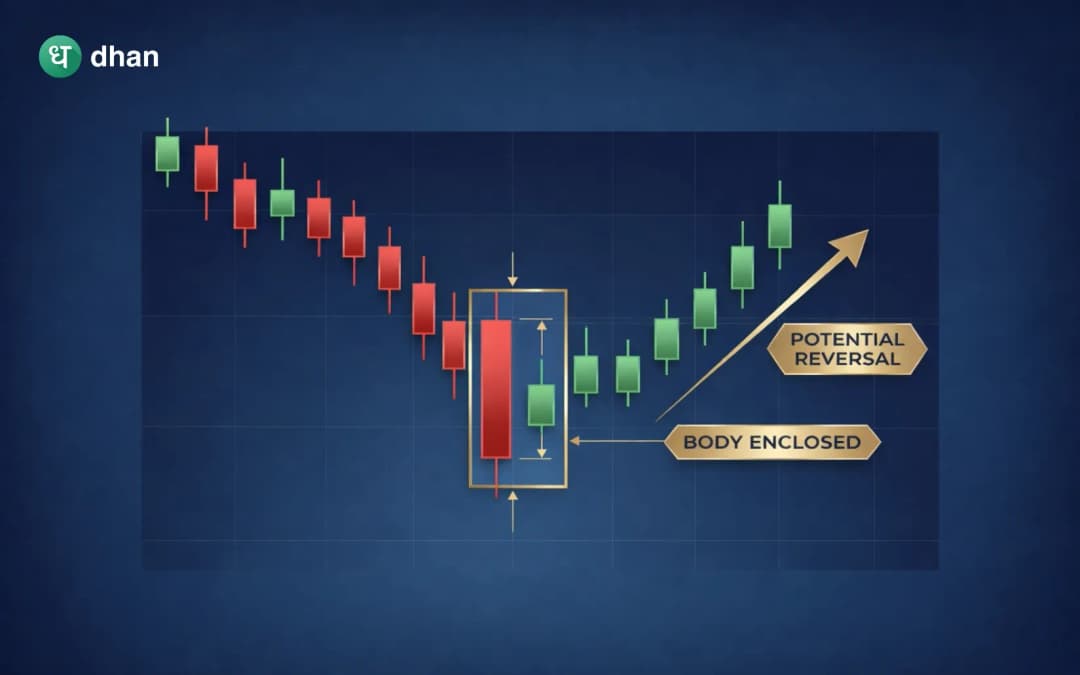




Markets don’t turn suddenly without leaving clues. Before a reversal, the price usually slows, loses momentum, and shows hesitation to move higher or lower. One such early signal is the bullish harami pattern. It is a bullish reversal pattern that usually appears after a downtrend.
It’s not loud or dramatic like some other patterns. In fact, it’s quite subtle. That’s exactly why many traders either miss it or misunderstand it.
This blog explains the bullish harami in a simple, practical way — what it means, how to identify it, and how to actually use it in trading.
What is a Bullish Harami Pattern?
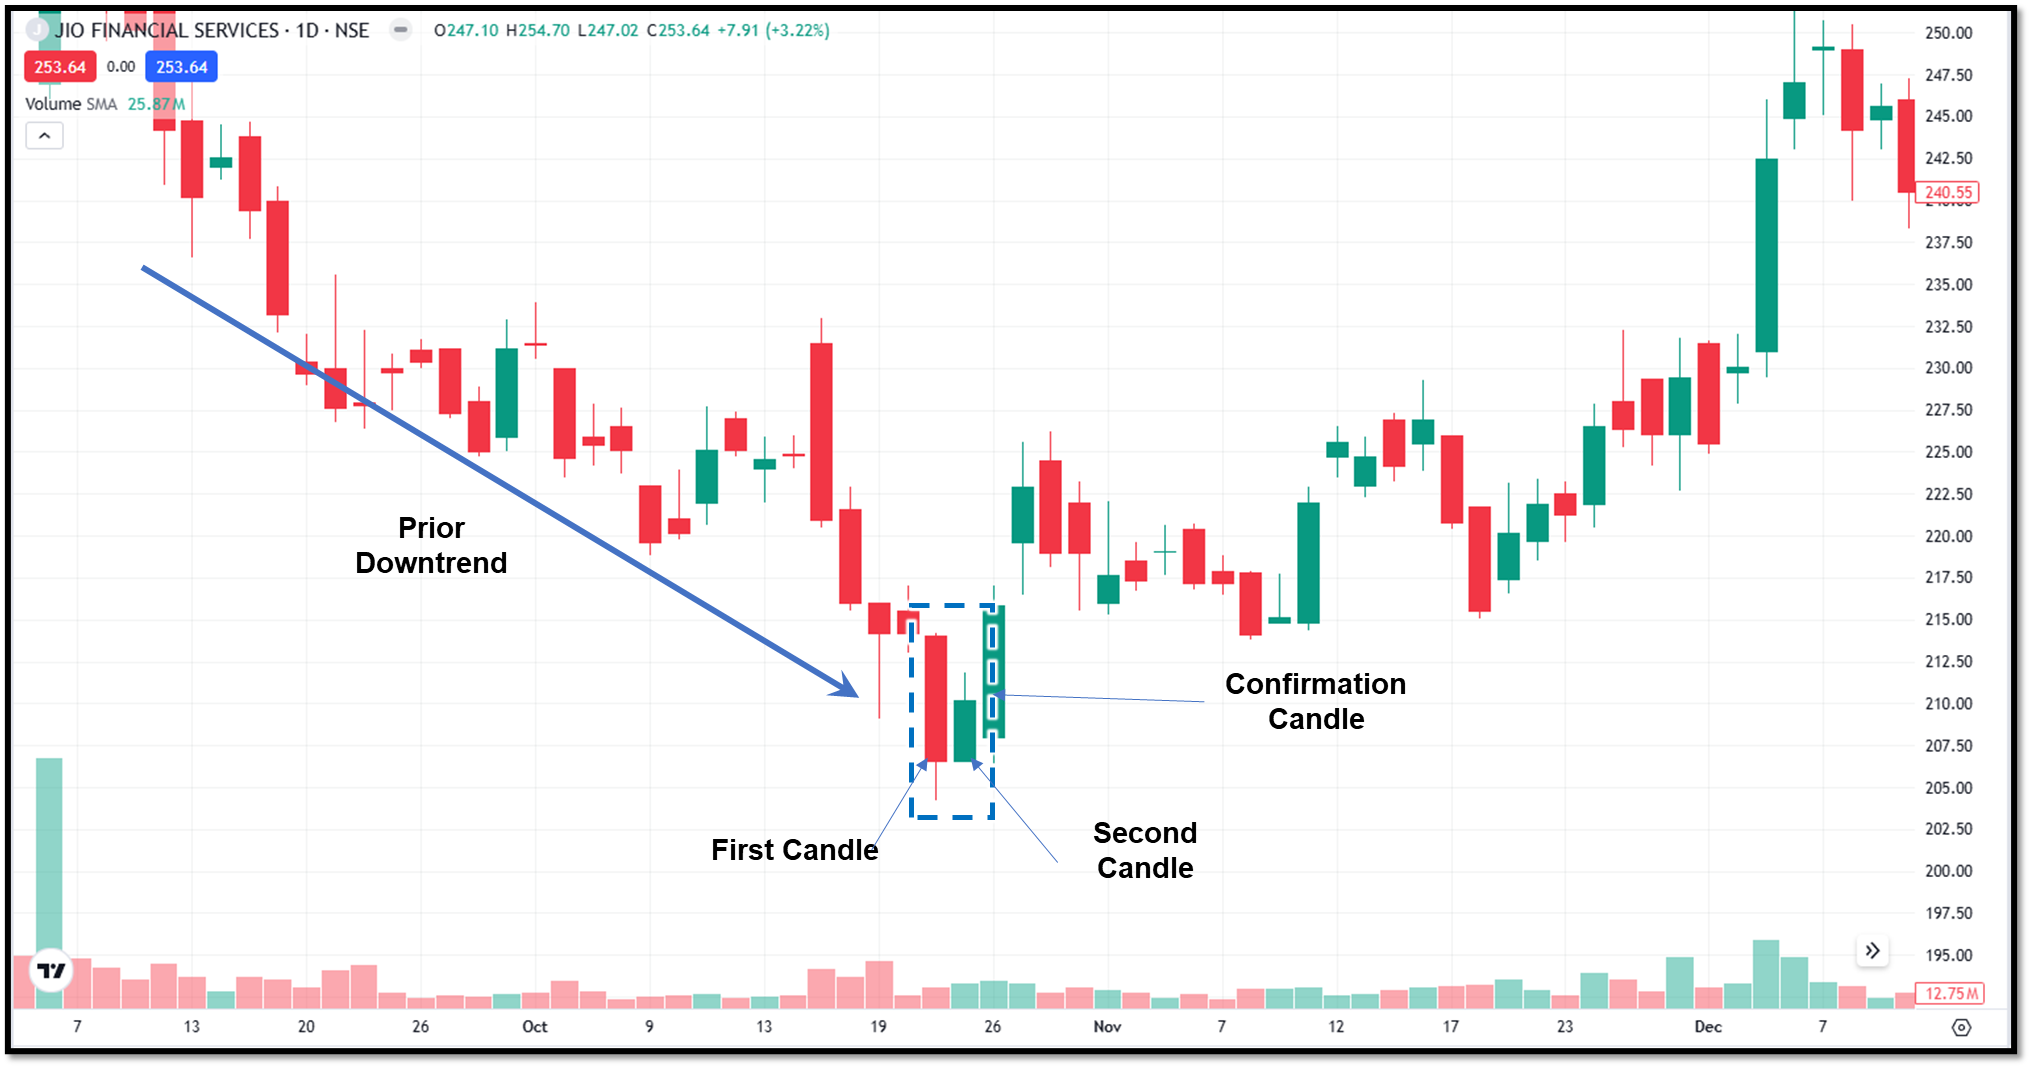
A bullish harami is a two-candlestick reversal pattern that appears after a downtrend and suggests that selling pressure is weakening.
The word “harami” comes from Japanese and means “pregnant.” The pattern reflects this idea visually.
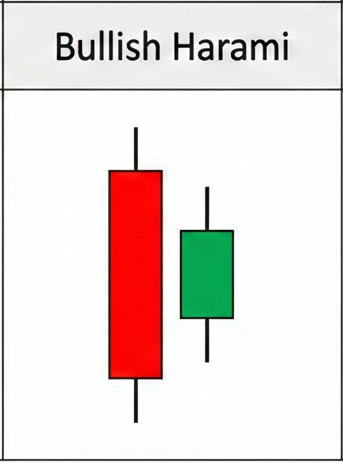
It consists of two candles:
- First candle – a large bearish candle (strong selling)
- Second candle – a small bullish or neutral candle that forms inside the first candle’s body
This “inside” structure is what defines the pattern.
What does the Bullish Harami Indicate?
The bullish harami pattern signals a shift in momentum.
- First candle: strong selling pressure
The first candle makes it quite clear that the market is bearish. Sellers dominate and push the price significantly lower.
- Second candle: loss of momentum
The second candle is green and smaller, which stays within the previous candle’s range. This tells you that the sellers are no longer as aggressive, and buyers are starting to step in. The downtrend is slowing down.
It’s not a full reversal yet; it’s a warning sign that a reversal might happen.
Psychology behind the Bullish Harami Pattern
Understanding the psychology makes the pattern more useful.
Phase 1: Control with sellers
The first candle reflects the seller's confidence. The trend is intact, and most traders expect further downside.
Phase 2: Hesitation appears
The second candle changes the tone:
- Price does not fall further
- Volatility reduces
- The market enters a pause
This is where smart traders start paying attention.
Phase 3: possible reversal
If buyers follow through after the pattern, the market can shift direction.
Characteristics of a Bullish Harami Pattern
Not every two-candle combination is meaningful. To identify the bullish harami pattern, you can search for the following characteristics.
Clear prior downtrend
The pattern only matters if it appears after a noticeable decline.
Large first candle
The first candle should show strong bearish momentum.
Small second candle
The second candle should be relatively small and stay within the body of the first candle.
- If the second candle is a bullish (green) candle, it is considered a stronger signal.
- If the second candle is a Doji or neutral, it is still a valid candle, but weaker.
Colour of the second candle
location matters
The pattern becomes more powerful when it appears near:
- Strong support levels
- Previous demand zones
Bullish Harami vs Bullish Engulfing
Beginners usually confuse bullish harami and bullish engulfing patterns. Here is a difference between the two of them.
How to trade the Bullish Harami
There’s no single way to trade it, but here are common approaches.
Entry after confirmation
This is a safer way to trade. In this strategy, you wait for a green candle after the pattern, which confirms the reversals.
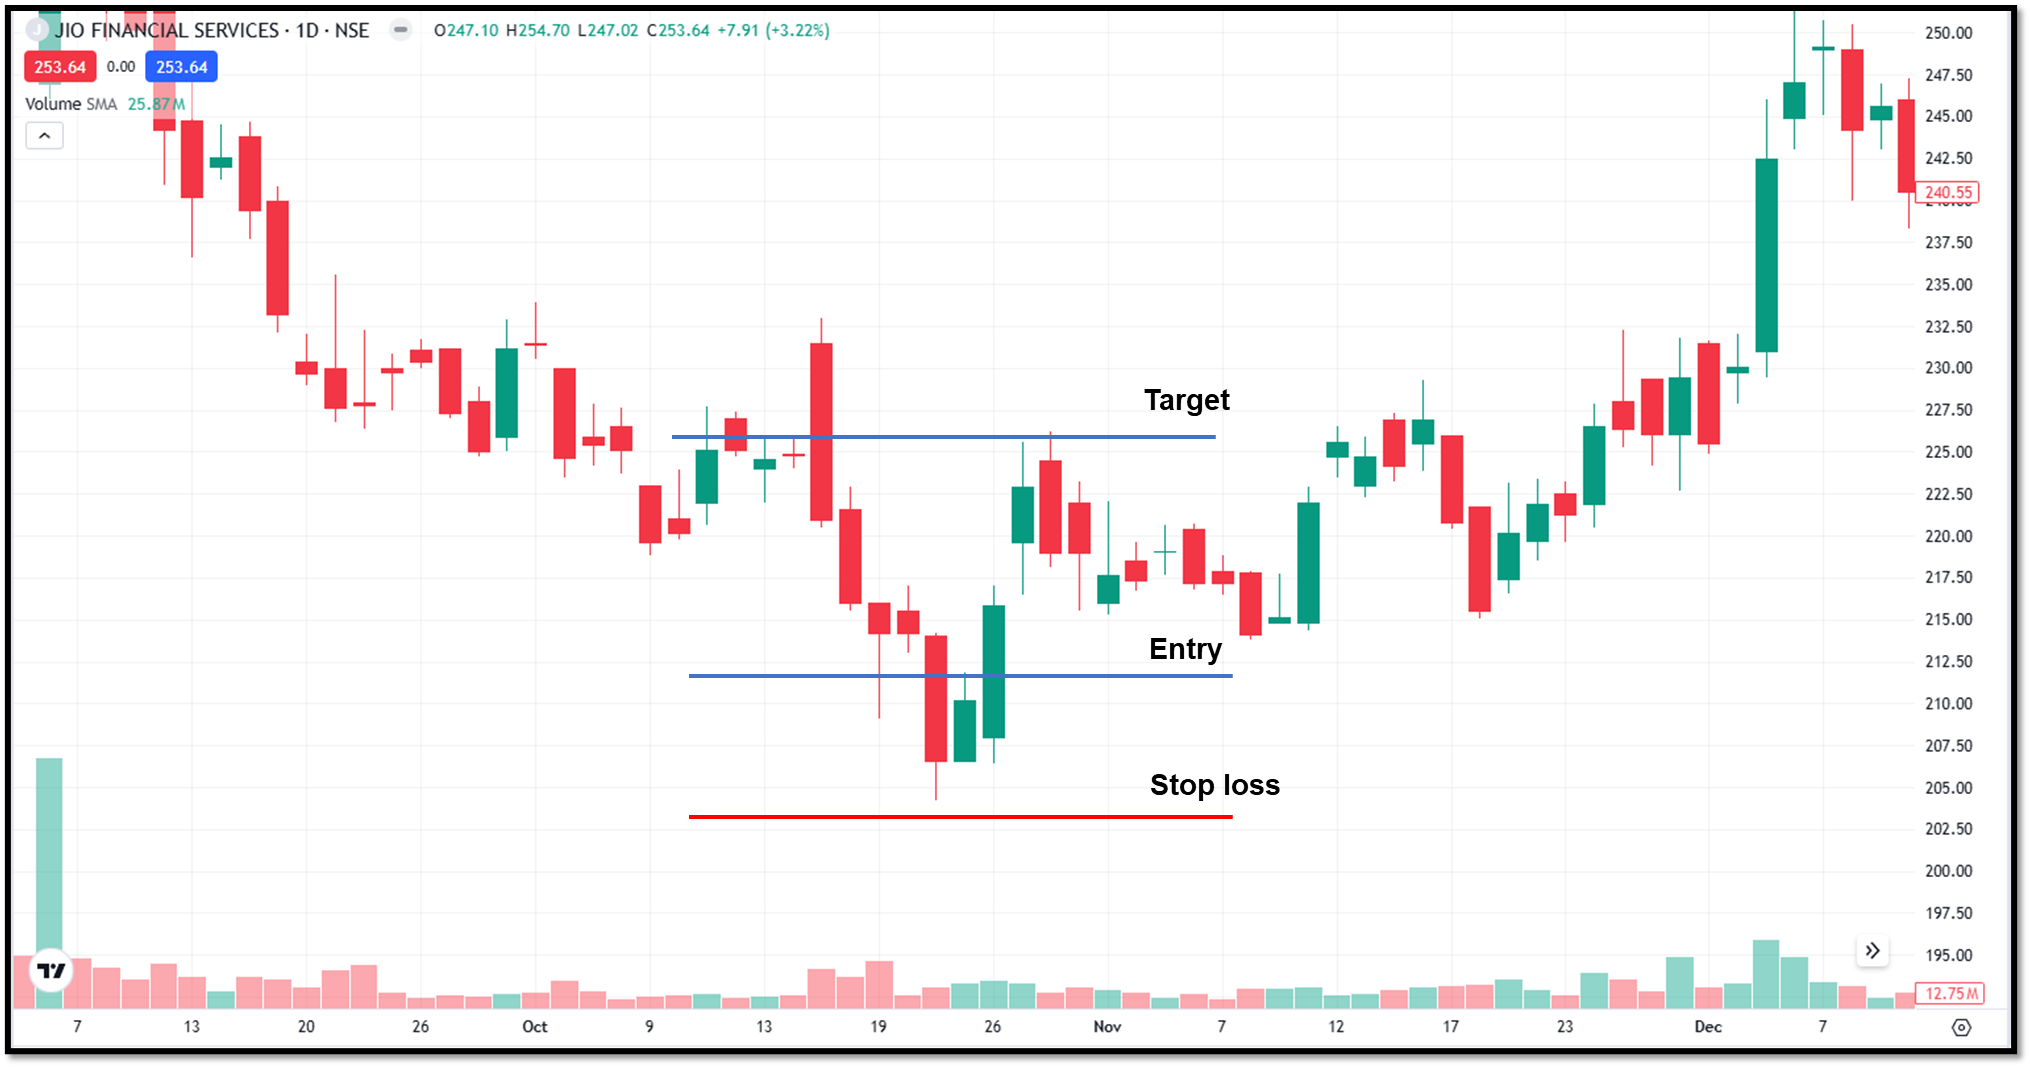
- Entry: above the high of the second candle
- Stop loss: below the recent low
- Advantage: reduces false signals
Early entry
In this strategy, you enter right after the second candle. This is an aggressive approach. There are chances of pattern failure, but it gives a better risk-reward ratio.
Breakout of resistance
If the pattern forms near a key resistance level, wait for a breakout. This adds an extra layer of confirmation.
Stop loss placement
Bullish harami is considered a weak pattern compared to other types of patterns. Hence, while trading with a bullish harami, stop loss is most important. The following are some common stop loss zones:
- Below the low of the pattern
- Below the second candle
Avoid placing stops too close, as small fluctuations can trigger them.
Target
To set the target, you can use the common approaches below.
- Previous resistance levels
- Risk-reward ratio (like 1:2 or 1:3)
- Trailing stop for trend capture
In the case of a bullish harami pattern, the context is more important; the pattern itself does not give a fixed target.
Role of volume
Volume can improve confidence in the setup.
- A high volume on the first candle indicates strong selling pressure.
- Low volume on the second candle indicates selling pressure weakening.
- Increase in volume after pattern buyers step in.
Without volume support, signals can be weaker.
Combining with indicators
The bullish harami pattern should not be used alone. Using indicators helps filter better trades.
- On the RSI indicator, if a bullish divergence appears, it strengthens the pattern.
- If the price is holding above a key moving average adds confidence.
- Patterns near strong support levels are more reliable.
Where does Bullish Harami Pattern Works?
The bullish harami performs better in:
- Trending markets (after a downtrend)
- Higher timeframes (daily, weekly)
- Stocks with good liquidity
It is less effective in choppy or sideways markets.
Common Mistakes Traders Make
You should avoid below mistakes for effective trading.
- Beginners usually treat this as a strong signal. This can be a mistake as a bullish harami is a weak to moderate signal.
- Many traders ignore confirmation and enter the trade just after the second candle. Without confirmation their are more chances of failure.
- Ignoring the market trend can be risky. This pattern is more effective in trending markets. If it appears in a sideways market.
- Traders usually ignore the context. Patterns without support levels or trend context usually fail.
- Trading without a stop loss is another common mistake. A sharp move against your position can lead to significant losses.
If the pattern fails
Not all patterns lead to reversals. If the pattern fails, it gives the following signs of failure:
- Price continues downward after the pattern
- No bullish follow-through
- Breakdown below recent lows
When the pattern fails, it usually confirms that the downtrend is still strong.
Final thoughts
The bullish harami pattern is an indication that something is changing. It represents a possibility of reversal but not certainty. Using it with confirmation, context and discipline is important. Relying on it blindly can lead to losses.
The pattern should always be used with other indicators like RSI, moving averages and volume. Using it alone can be risky.
FAQs
What is a bullish harami pattern?
A bullish harami is a two-candle pattern that shows the market slowing down after a fall. It suggests that selling pressure is weakening and a reversal may happen.
Is a bullish harami a strong reversal signal?
No, it is considered a weak to moderate signal. It works better as an early warning rather than a confirmation of trend change.
Can I trade the pattern without confirmation?
You can, but it’s risky. Most traders prefer to wait for a bullish confirmation candle or a breakout before entering.
What is the difference between bullish harami and bullish engulfing?
Bullish harami has a small candle inside the previous candle, which can be a weaker signal, while bullish engulfing has a large candle that covers the previous candle, and it is a stronger signal.
Is a bullish harami better for intraday or positional trading?
It works better for positional trading (higher timeframes) because the signals are cleaner and more reliable. For intraday trading, it can give more false signals.