



CPR Indicator









Key takeaways
- The Central Pivot Range (CPR) is a technical indicator that uses the previous period's high, low and close to create three price levels: the Pivot Point (PP), Top Central (TC) and Bottom Central (BC).
- Traders use the CPR to identify potential support and resistance areas, understand the market's directional bias and assess whether a trading session may be range-bound or trending.
- CPR works best as a reference area rather than a standalone buy or sell signal. Traders can combine it with price action, volume and other technical tools to confirm a setup.
Some technical indicators are designed to follow price after a move has already started. The CPR indicator takes a different approach. It gives traders a set of predefined price levels that can be marked on the chart before the next trading session begins.
CPR stands for Central Pivot Range. It is a pivot-based technical indicator calculated using the previous period's high, low and closing price. The resulting range consists of three levels that traders can use to study the market's potential support, resistance and directional behaviour.
For intraday traders, this can be particularly useful because the CPR levels provide a framework for reading the session. Instead of looking at every price movement in isolation, a trader can observe how the price behaves around the CPR.
For example, if an index opens above the previous days CPR and continues to hold above it, the structure may indicate bullish strength. On the other hand, repeated rejection from the CPR or a move below it may suggest weakness.
What is the CPR indicator?
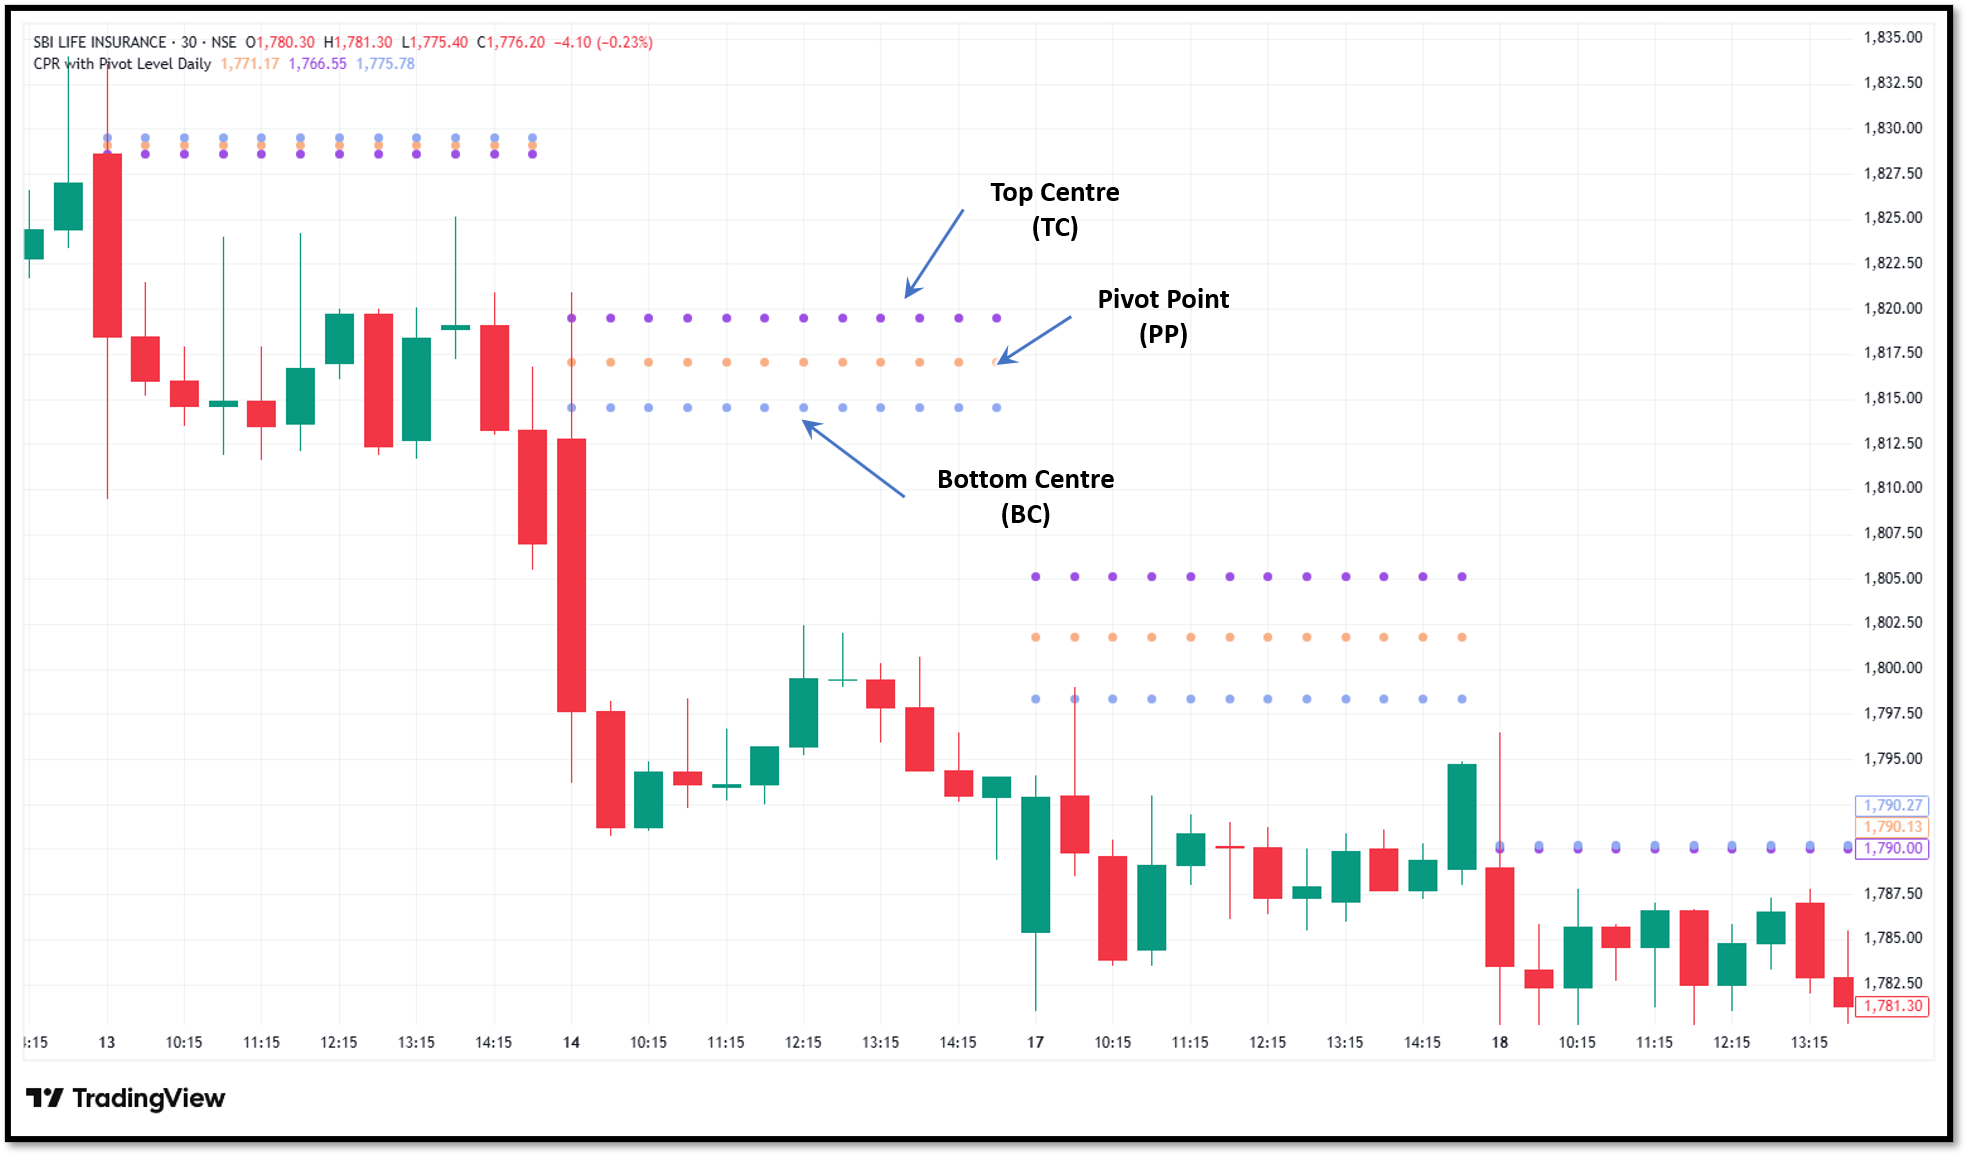
The Central Pivot Range is a three-level pivot structure consisting of:
- Pivot Point (PP)
- Bottom Central (BC)
- Top Central (TC)
These levels are calculated from the previous period's high, low and close.
Unlike a traditional single pivot point, CPR creates a central range. This range gives traders more information about where price may interact with an important reference area.
The CPR can be calculated using daily, weekly or monthly data, depending on the trader's timeframe and objective. For an intraday trader, the previous day's prices are commonly used to calculate the CPR levels for the current trading session.
One important feature of CPR is its width. The distance between the Top Central and Bottom Central levels changes according to the previous period's price range.
How is CPR calculated?
The CPR calculation uses three formulas.
Step 1: Calculate the Pivot Point
The Pivot Point is calculated with the following formula:
PP= High+Low+Close3
Here, High, Low and Close refer to the previous trading period.
Step 2: Calculate the Bottom Central
The Bottom Central is calculated with the following formula:
BC=(High + Low)2
Step 3: Calculate the Top Central
The Top Central is calculated using the Pivot Point and Bottom Central:
TC=(PP2)-BC
Once these three values are calculated, the CPR range is formed between the TC and BC levels. The exact ordering of TC and BC on a chart can depend on the price relationship.
Numerical Example
Suppose an index had the following previous-day prices:
- High = ₹22,000
- Low = ₹21,600
- Close = ₹21,900
PP= 22,000 + 21,600 + 21,9003
PP=₹21,833.33
BC= 22,000 + 21,600 2
BC= ₹21,800
TC=(21,833.332)-21,800
TC=₹21,866.66
The trader can plot these levels on the next trading session's chart and observe how price behaves around them.
What does CPR tell traders?
CPR can provide several pieces of information at once.
CPR creates a central reference area. Price trading above or below this range can provide context about the session's directional bias.
The width of the CPR can help traders assess the structure of the upcoming session. A narrow CPR is usually seen as a possibility of a stronger directional move, while a wider CPR can represents more balanced price action.
Also, CPR can act as an area where price may find support or resistance. The actual reaction still needs to be observed on the live chart.
This is why CPR should not be interpreted as a collection of fixed rules. The same CPR structure can behave differently depending on the broader market environment.
How to read a narrow and wide CPR
A narrow CPR occurs when the TC and BC levels are relatively close together.
Traders often pay attention to narrow CPRs because a compressed central range can precede a session with a stronger directional move. However, the narrow range itself does not indicate whether that move will be upward or downward.
A wide CPR means the distance between the TC and BC is relatively larger.
A wider range can indicate that the previous session had a larger price range. Traders may therefore treat the CPR as a broader area rather than expecting price to move cleanly through the three levels.
A wide CPR does not automatically mean the next session will remain range-bound. It simply provides a different structure for interpreting price movement.
CPR-based trading approaches
Traders may use the following strategies while trading using the CPR indicator.
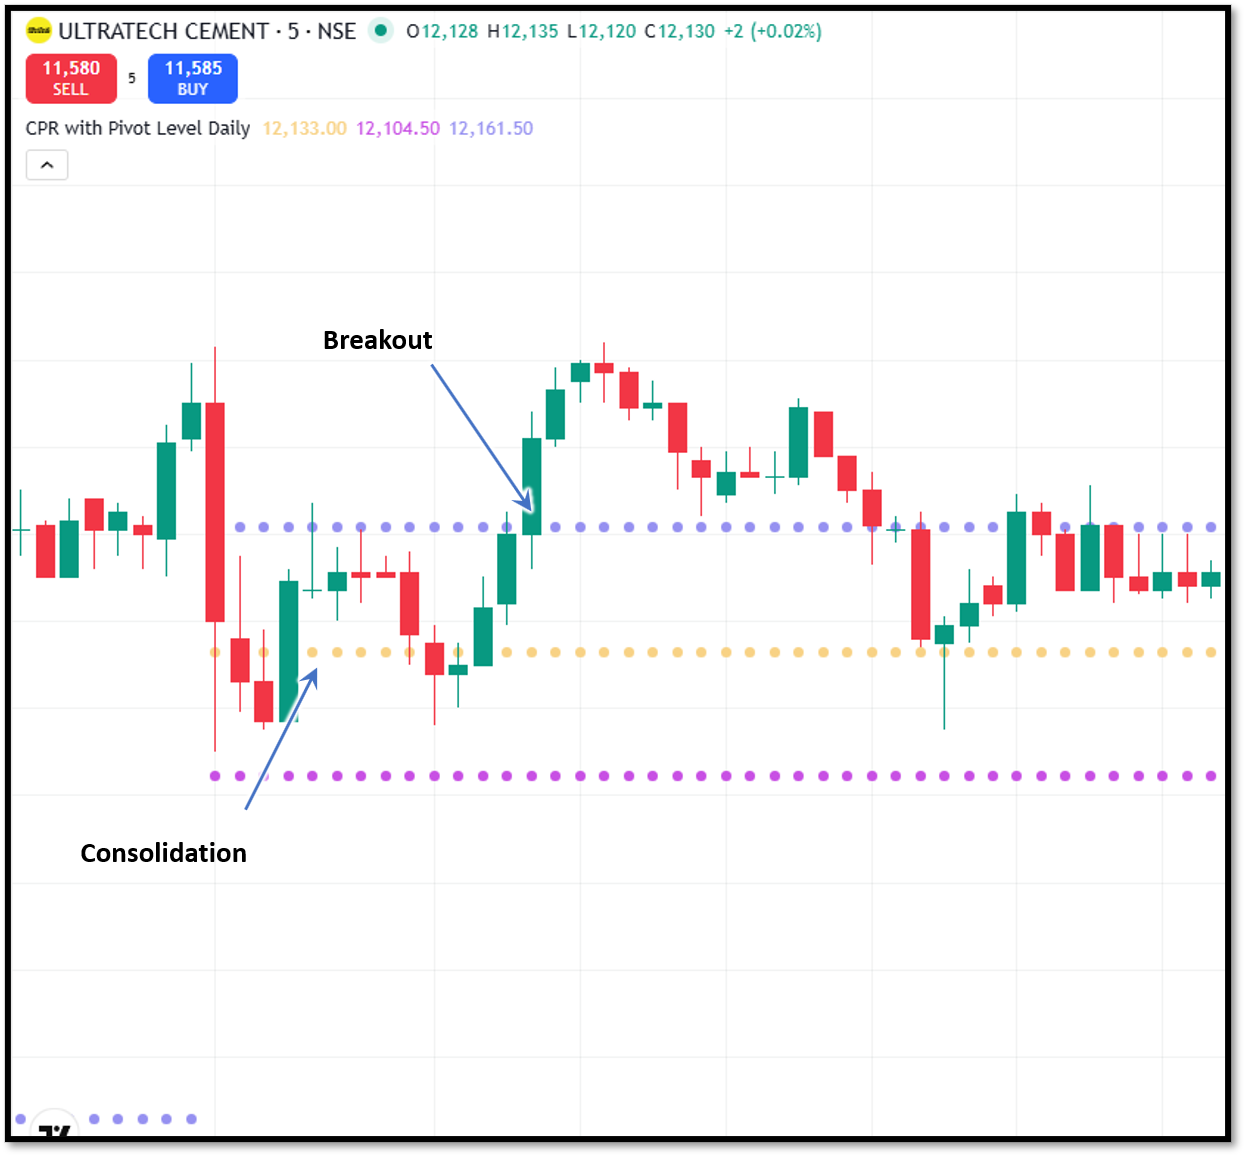
Trading a breakout from CPR
In this approach, wait for price to move decisively outside the CPR and then look for confirmation.
Suppose an index opens inside the CPR and spends some time consolidating. If it later breaks above the TC with strong price action, a trader may consider whether the breakout has enough strength to continue.
Trading a CPR rejection
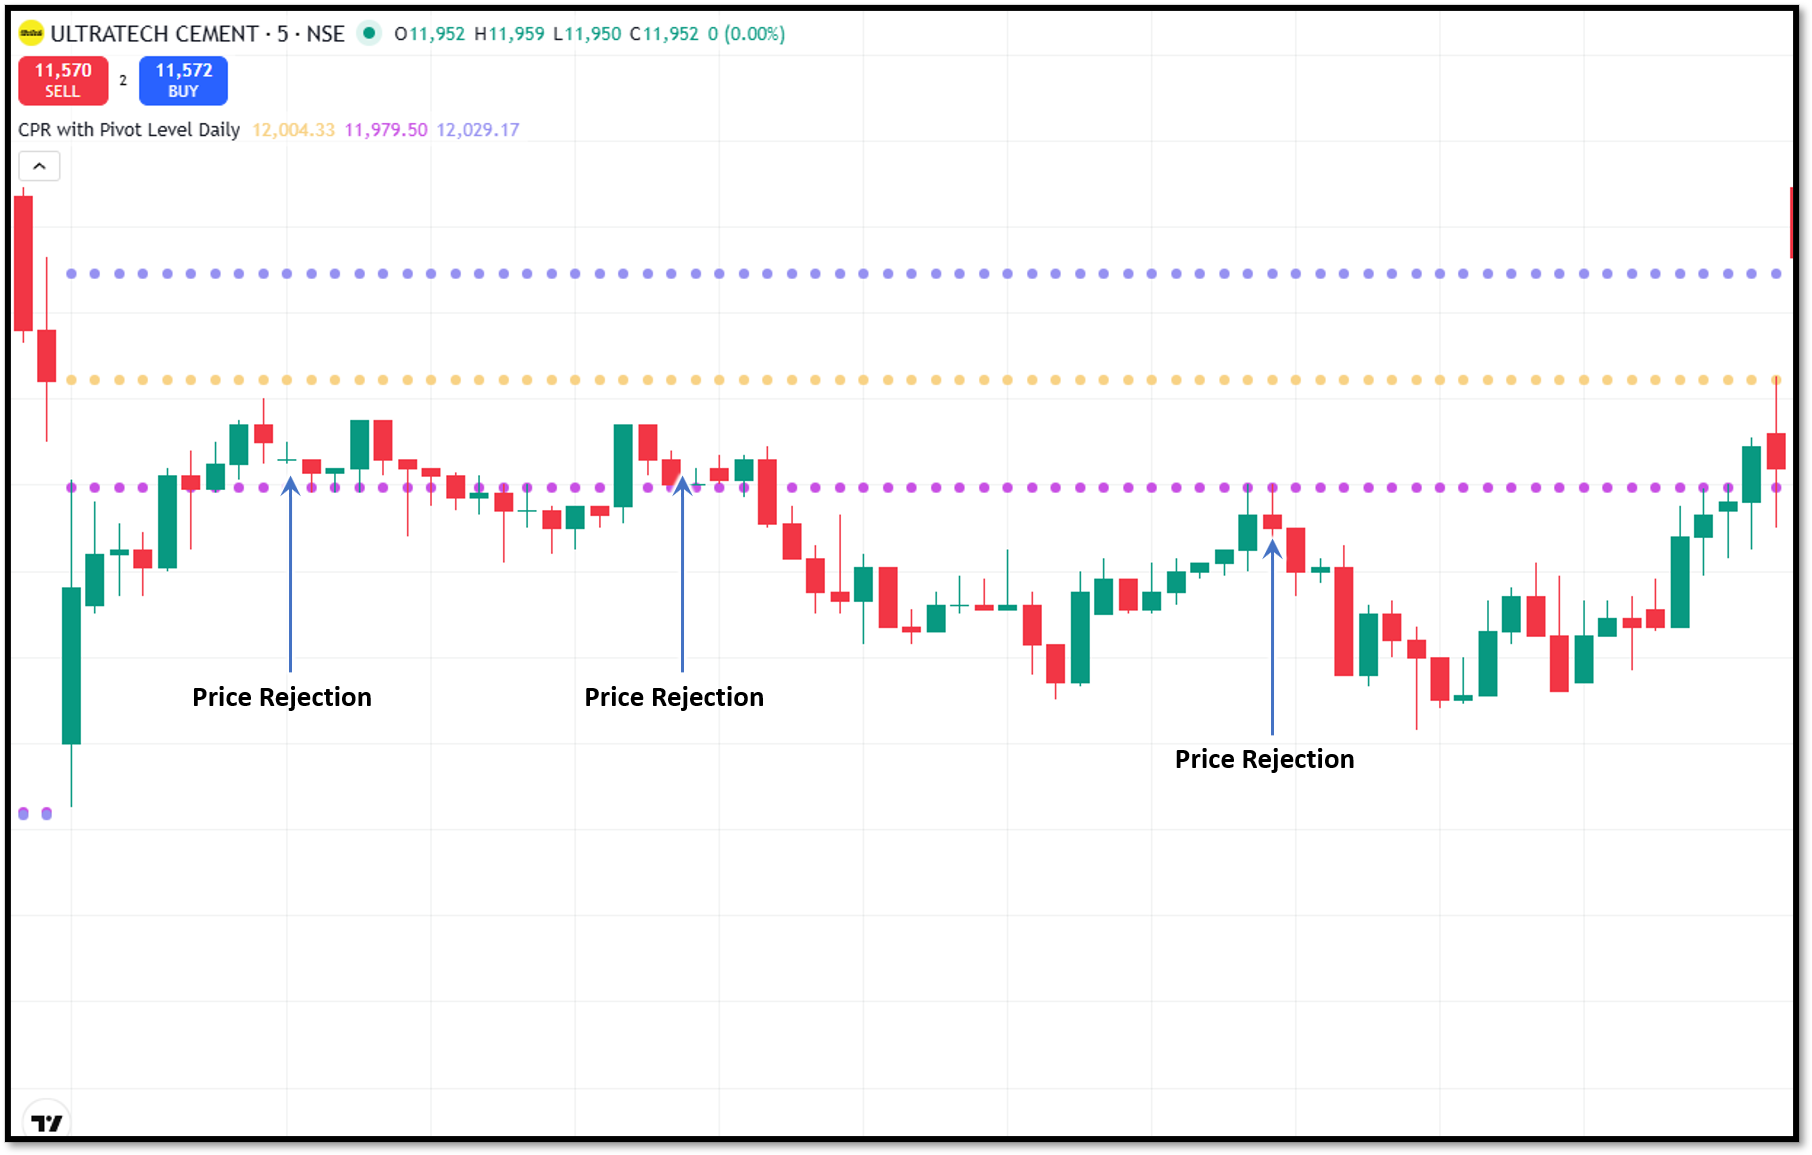
Price does not always break through the CPR. It may approach the range and reverse.
For instance, if an index moves toward the TC but repeatedly fails to sustain prices above it, the trader may interpret the rejection as evidence that sellers are active around that area.
The setup becomes more meaningful when the rejection is supported by a clear price-action pattern or other confirmation.
Using CPR with trend direction
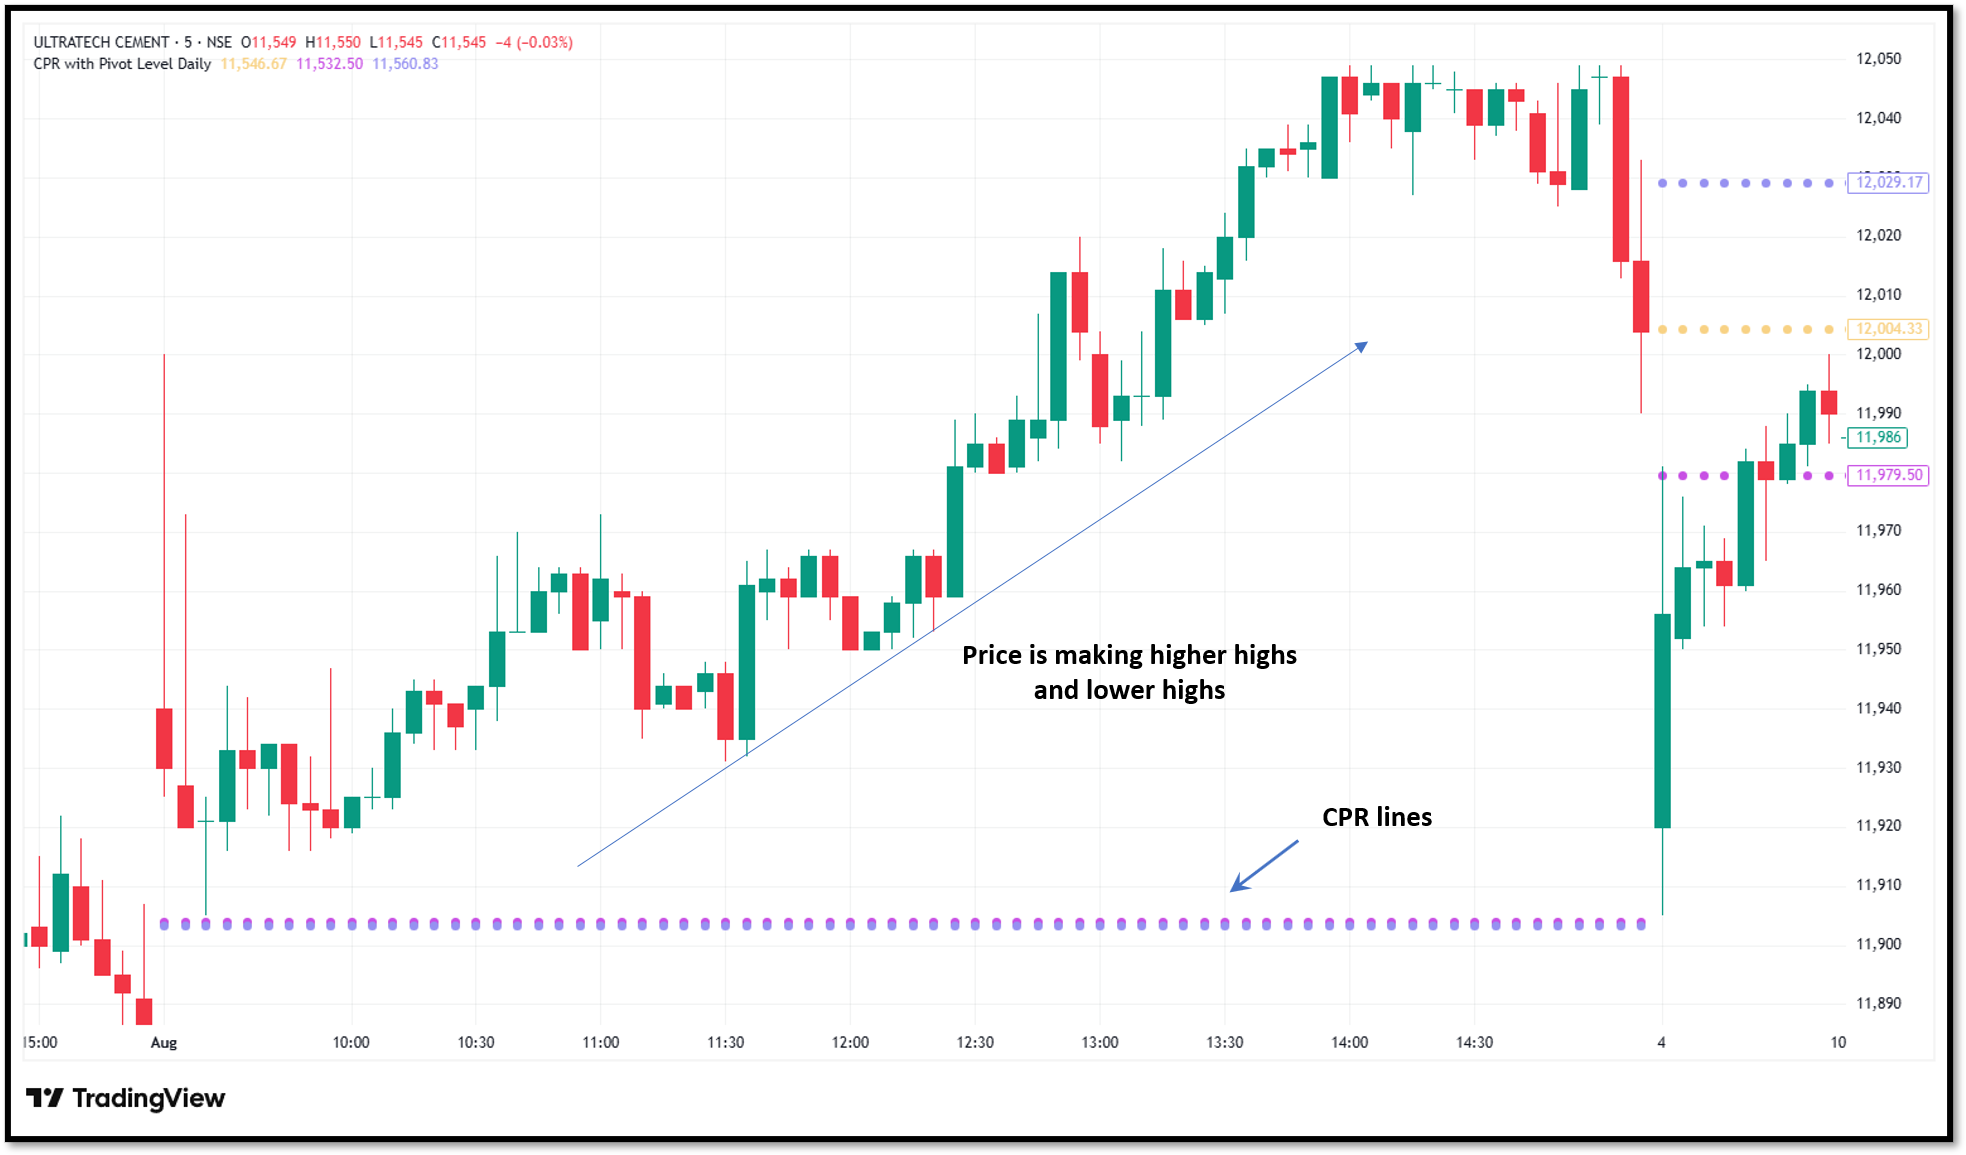
CPR can also be used as part of a broader trend-following approach.
If the market is already making higher highs and higher lows and price remains above the CPR, traders may focus on bullish continuation opportunities rather than trying to predict a reversal.
Likewise, in a declining market, repeated trading below the CPR can help maintain a bearish framework.
CPR and support & resistance
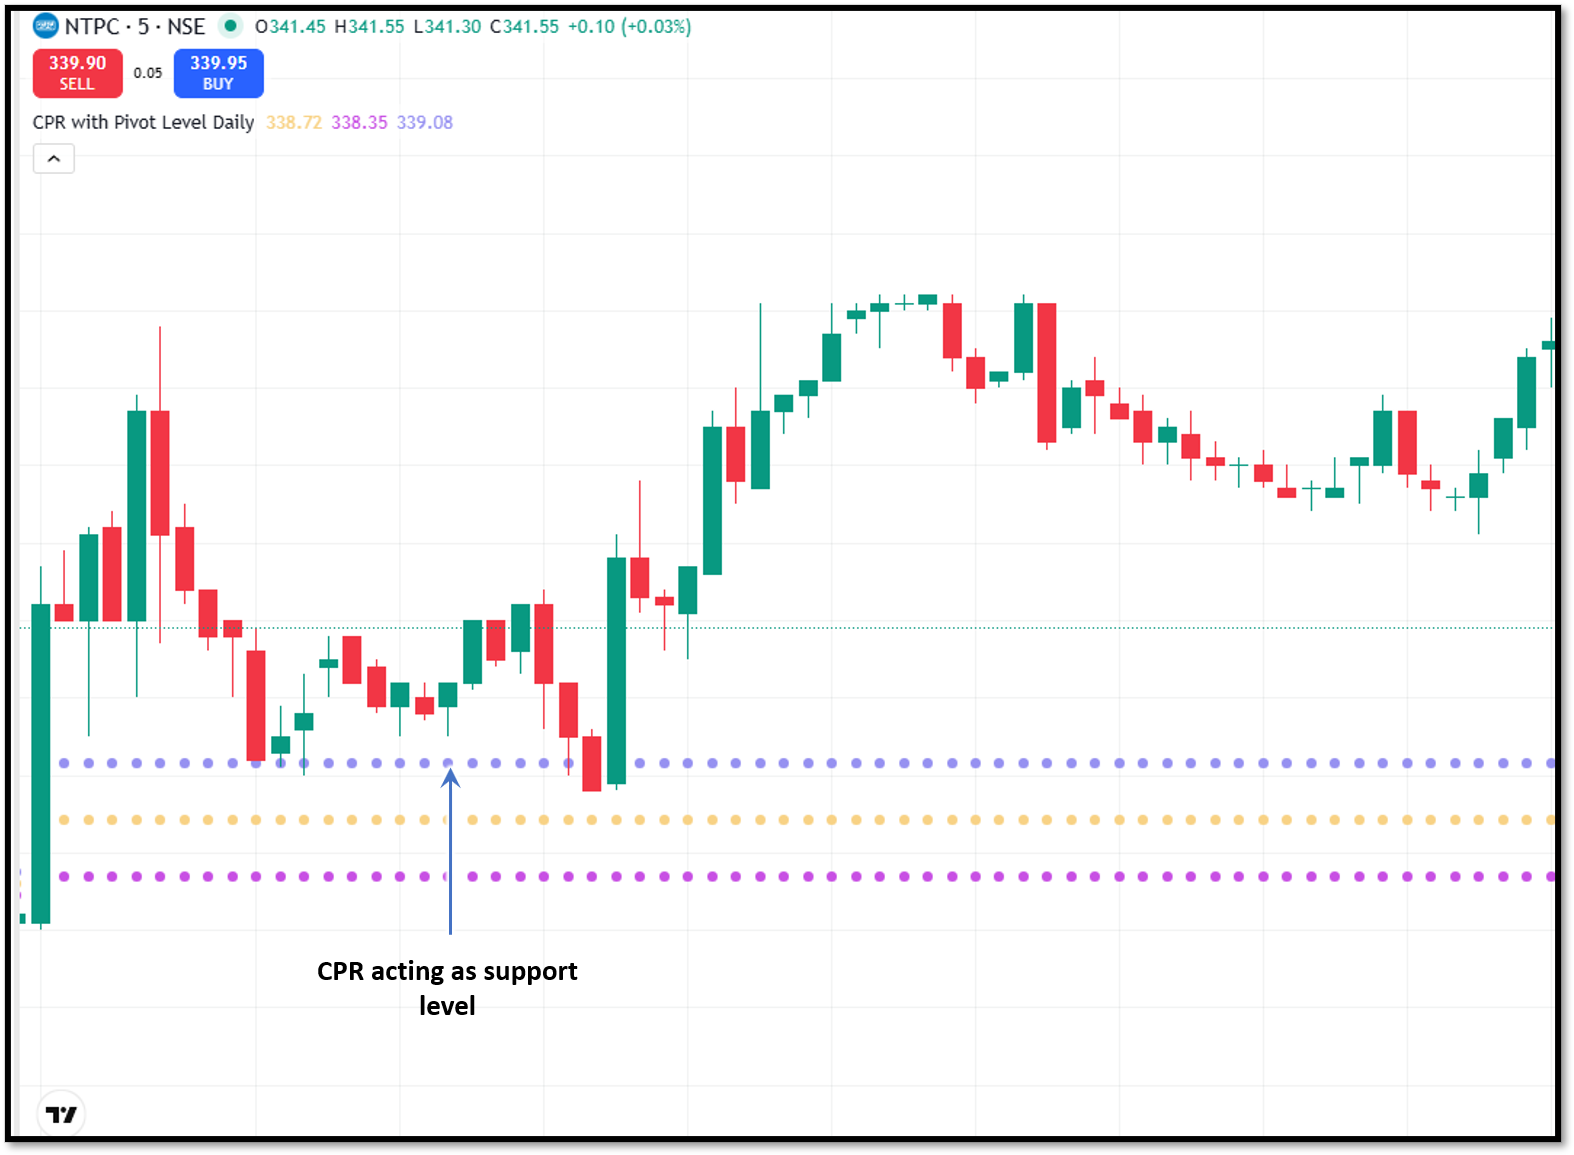
The CPR can function as a dynamic reference area for support and resistance.
When price trades above the CPR, the range may act as a support area during a pullback. If price breaks below the CPR, the same region can potentially become a resistance area when price attempts to recover.
Advantages of the CPR indicator
The CPR indicator offers some key advantages as follows:
- The CPR indicator provides a defined price zone for traders before the trading session starts. This allows them to plan their entry and exit strategies well in-advance.
- The distance between TC and BC helps traders distinguish between a compressed and broader central range, which can influence how they interpret the day's price behaviour.
- Traders only need the previous period's high, low and close to calculate the basic CPR, making the indicator relatively easy to understand and apply.
Disadvantages of the CPR indicator
Along with advantages, the CPR indicator has the following limitations:
- A CPR level does not guarantee a price reaction. Price can move straight through the range when strong buying or selling pressure enters the market.
- A narrow CPR does not tell traders which direction the breakout will take. It may alert a trader to watch for a stronger move, but confirmation from price action is still required.
- CPR can produce false breakout signals. Price may move above or below the range briefly and then return inside it, particularly during choppy sessions.
Conclusion
The CPR indicator is a pivot-based technical tool that creates a central price range using the previous period's high, low and close. Its three components, Pivot Point, Top Central and Bottom Central give traders a structured way to observe price location and market behaviour.
For intraday traders, CPR can be particularly useful because the levels can be prepared before the trading session begins. Its width also gives traders another factor to monitor, especially when distinguishing between narrow and wider central ranges.
FAQs
What is the CPR indicator?
CPR stands for Central Pivot Range. It is a technical indicator made up of three levels Pivot Point, Top Central and Bottom Central calculated using the previous period's high, low and close.
What does a narrow CPR indicate?
A narrow CPR is seen as a potentially stronger directional session, but it does not indicate whether the eventual move will be upward or downward.
What does a wide CPR indicate?
A wide CPR reflects a broader previous-period price range, but it does not guarantee that the following session will be range-bound.
Can CPR be used for intraday trading?
Yes. CPR is commonly used for intraday analysis because traders can calculate and plot the levels before the session begins.
Is CPR a leading or lagging indicator?
The Central Pivot Range (CPR) is primarily classified as a leading indicator because it is calculated before the trading session starts and projects forward-looking support and resistance levels for the day.







