



Descending Triangle Pattern




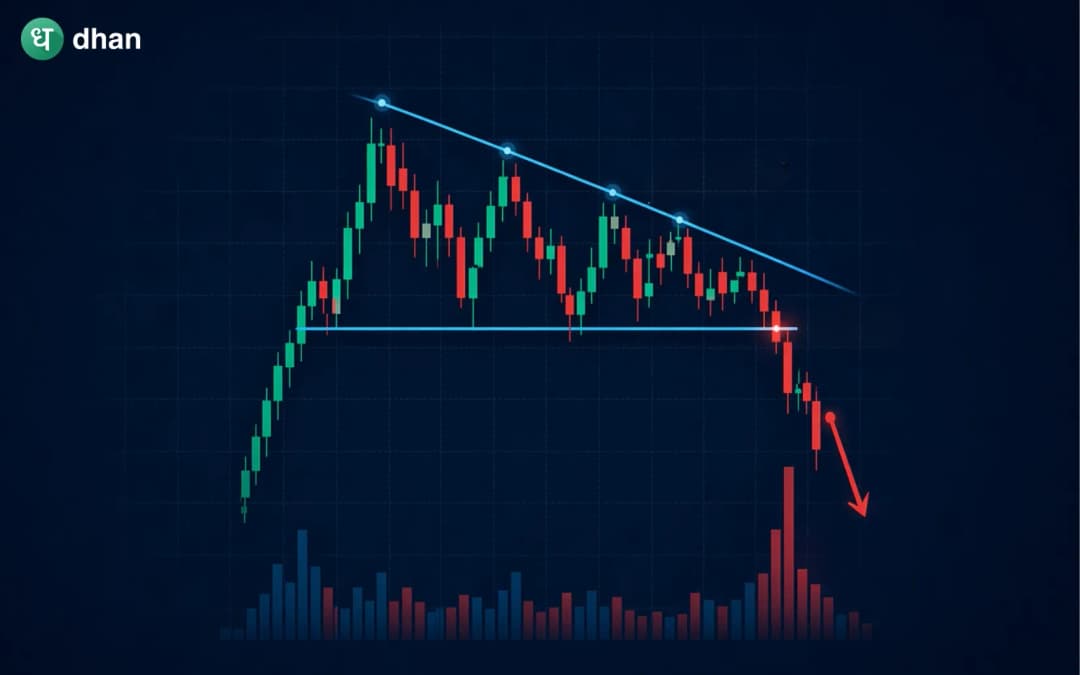




How many sharp reversals have you observed in the market? Not much, right? Because they are rare in the market. Before breakouts, prices usually slow down and test the level again and again. These phases are significant because they demonstrate how buyers and sellers are preparing for a decisive move.
Over the years, traders have recognised certain patterns that appear more often before breakouts. One such pattern is the descending triangle pattern. It looks like a consolidation phase at first glance, but a closer look reveals weakening demand and increasing selling pressure. In this blog, we will go beyond basic definitions and explore how the descending triangle forms, what it represents, how traders use it, and where it can go wrong if interpreted without context.
What is a descending triangle pattern?
A descending triangle is a bearish continuation pattern. It appears during a downtrend, and represents a phase where price consolidates between two key boundaries:
- A horizontal support level at the bottom
- A downward-sloping resistance line at the top
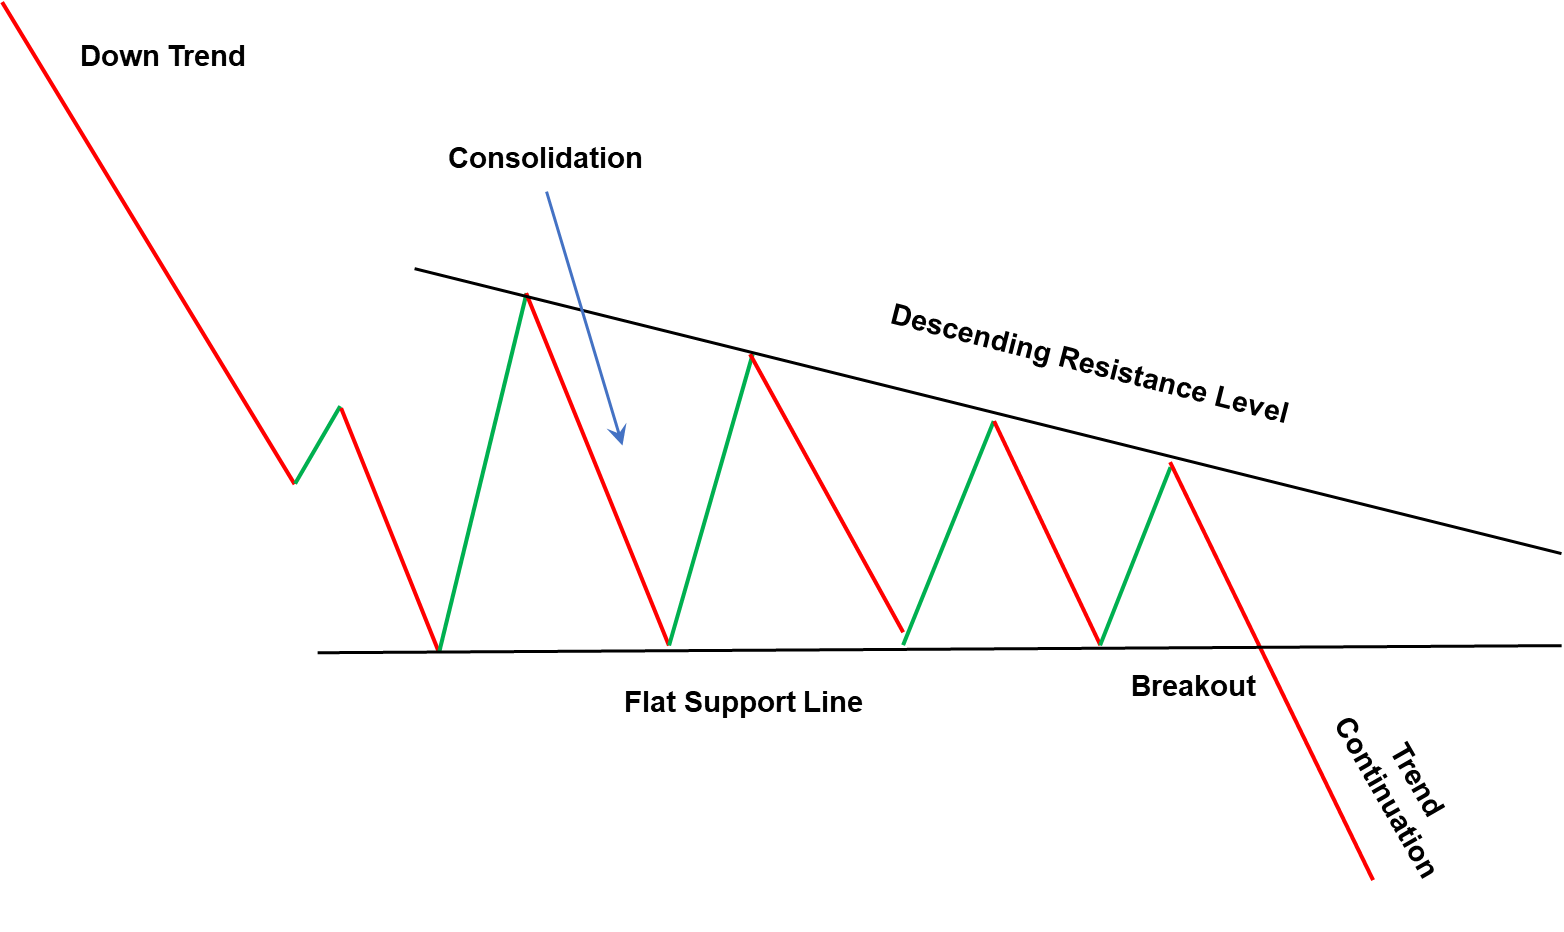
This creates a triangular shape where price gets squeezed between lower highs and a relatively stable support zone. The structure of the descending triangle pattern is as follows.
- The pattern starts after a downtrend. Sellers push the price lower and hit a strong support level.
- Buyers step in at support, and prices make a bounce.
- The next bounce fails earlier, forming a lower high
- This process repeats until the price eventually breaks support
Psychology behind the pattern
You need to understand what is happening beneath the surface to learn the pattern. Here is how you can break down the pattern:
Repeated support tests
The horizontal support level shows that buyers are defending a particular price zone. Each time the price reaches this level, buying interest temporarily stops further decline.
However, repeated testing of support is not a sign of strength. In many cases, it indicates that the level is being weakened.
Lower highs signal weakening demand
While support remains constant, the highs keep getting lower. Buyers are not showing that much interest, hence each rally is becoming weaker than the previous one. This gradual loss of upward momentum increases the possibility of a downward breakout.
Buildup toward breakdown
As the price continues to compress, the range becomes tighter. This buildup usually leads to a strong move once the pattern resolves.
In a descending triangle, the probability generally favours a downward breakout, especially when it forms within an existing downtrend.
Key components of a valid descending triangle
A well-formed descending triangle has the following characteristics that improve its reliability.
Clear prior trend
The pattern is most effective when it appears after a downtrend. In such cases, it acts as a continuation pattern.
Horizontal support level
While forming the triangle, the base should be relatively flat, it indicates a consistent support zone where buyers are active.
Downward sloping resistance
The upper boundary should show a clear series of lower highs, forming a descending trendline.
Multiple touchpoints
Both the support and resistance lines should be tested multiple times. It increases the reliability of the pattern.
Volume contraction
In an ideal pattern, volume usually decreases as the pattern develops, reflecting reduced participation during consolidation. A surge in volume during a breakout adds confirmation.
How the breakout works
There is a higher possibility of a downward breakout, but sometimes an upward breakout has also been seen.
Downside breakout
When the price breaks below the support level, it signals that sellers have finally overwhelmed buyers.
This usually leads to:
- Increased momentum
- Faster price movement
- Continuation of the downtrend
Upside breakout
Although rare, the price can break above the descending resistance line. This usually happens when the selling pressure weakens significantly, and buyers regain control.
However, such breakouts require strong confirmation.
Trading the descending triangle
Trading the descending triangle pattern is simple. You can use the following approach to trade:
Entry
There are two different ways to enter the trade. The most common approach is to enter after price breaks below support. This confirms that the pattern has completed.
Sometimes traders wait after breaking the support, as the price can move back up to test the same level from below. This retest can offer a more controlled entry.
Stop loss placement
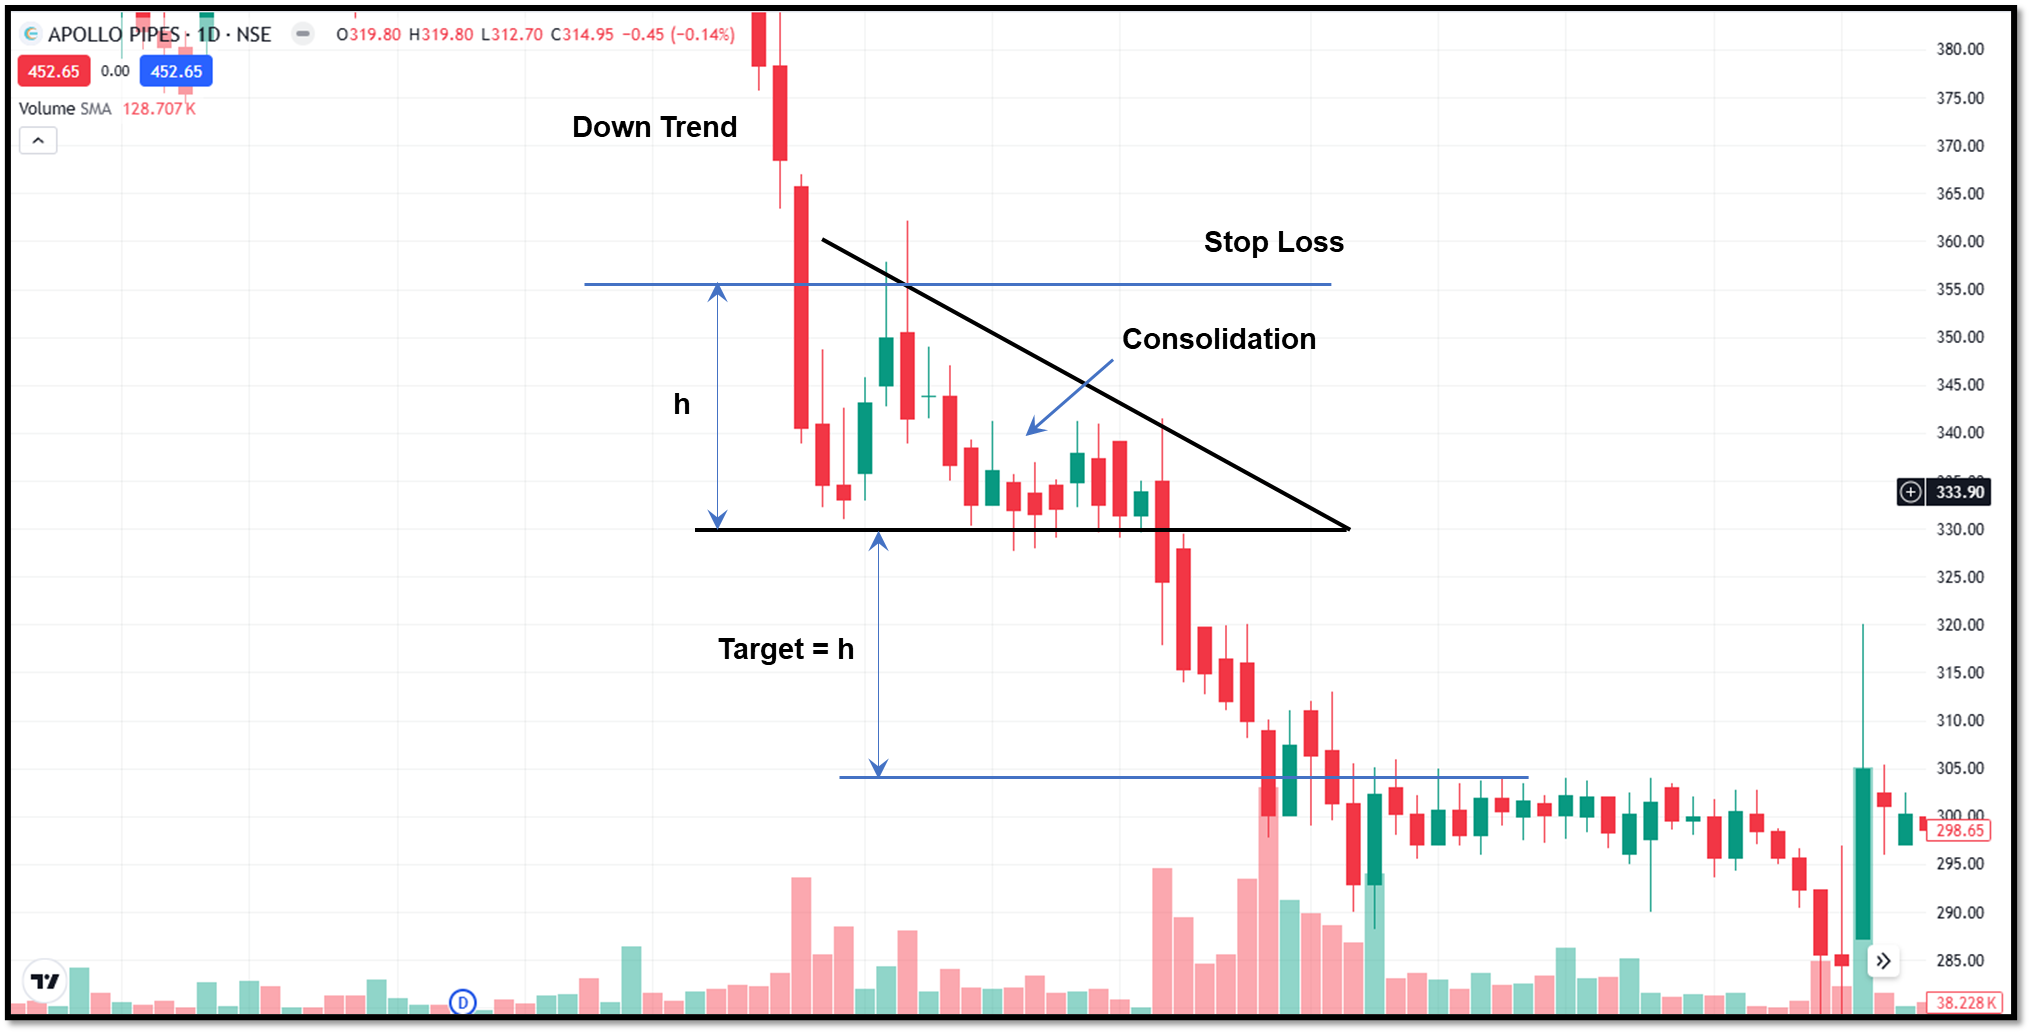
For any strategy, proper stop loss placement is essential. While trading the descending triangle pattern, common approaches for stop-loss placement are as follows:
- Placing a stop loss above the last lower high
- Placing a stop above the broken support level
The idea is to protect against false breakouts.
Target calculation
For target calculation, traders usually use a common method, which is the height projection technique. In this technique:
- Measure the vertical distance between the first high and the support level
- Project that distance downward from the breakout point
This provides a logical price target based on the pattern’s structure.
Volume confirmation
For validation of the pattern, you must watch the volume. An ideal pattern shows the volume pattern during the formation of the descending triangle pattern.
- Volume decreases during formation indicate consolidation.
- Increased volume during breakdown suggests strong selling pressure.
A breakout without significant volume is not reliable.
Descending triangle vs symmetrical triangle
A symmetrical triangle has both trendlines converging toward each other without a clear horizontal base. In contrast, the descending triangle has a flat support and a clearly declining resistance. This makes its directional bias more bearish.
Advantages of the descending triangle pattern
The descending triangle pattern has the following advantages:
- This pattern stands out clearly and makes it easy to identify. The combination of a flat support level and a downward-sloping resistance line makes it relatively easy to spot.
- When the descending triangle forms after a downtrend, it usually acts as a continuation pattern, which gives a strong bearish bias.
- The pattern has well-defined entry, exit and stop loss placement. This structure makes it easier to plan trades with proper risk management.
- The pattern works across multiple markets and also for multiple timeframes.
Disadvantages of the descending triangle pattern
Along with advantages, the descending triangle pattern has some limitations as well. These are listed below:
- The pattern generates many false breakouts. This can trap traders who enter too early without confirmation.
- The pattern is less reliable in a sideways market.
- The pattern takes multiple sessions to develop. Sometimes days to weeks. Traders usually anticipate the breakdown instead of waiting for confirmation, which increases risk.
- The pattern does not form in an ideal formation. It can form slight uneven support levels and minor breakouts that fail.
Common mistakes traders make
The following mistakes are observed while trading:
- Beginners usually enter too early, before the breakout is confirmed. This exposes traders to unnecessary risk.
- Another issue is ignoring the broader trend. A descending triangle in an uptrend does not carry the same bearish probability.
- Traders also tend to overlook volume, which is an important confirmation tool.
- Finally, forcing patterns where none exist leads to poor decision-making. Not every consolidation is a triangle.
Final thoughts
The descending triangle pattern forms after a clear downtrend. It forms a flat support line while the resistance keeps making lower highs. Each lower high tells you that buyers are losing strength and each test of support shows that the level is being challenged.
For effective trading, just spotting the pattern is not enough. Understanding what it represents and how the market is behaving is more important.
FAQs
What does a descending triangle pattern indicate?
A descending triangle pattern is usually considered a bearish continuation pattern, especially when it forms after a downtrend. It suggests that sellers are starting to take control, and buyers are having a hard time pushing prices higher.
Is the descending triangle always bearish?
Not always. It is observed that sometimes the price can break out in an upward direction as well. However, these breakouts are less common and usually require strong buying momentum.
Can beginners trade the descending triangle pattern?
Yes, beginners can trade the descending triangle pattern. It has a simple structure and well-defined entry, exit and stop loss placement levels. Although it is recommended that you paper trade before risking real money.
Can the descending triangle pattern be used in intraday trading?
Yes, it can be used intraday, but traders should be cautious as false signals are more common on lower timeframes.
What is the difference between a descending and a symmetrical triangle?
A descending triangle has a flat support and downward resistance. While a symmetrical triangle has both trendlines sloping toward each other, with no clear directional bias.







