



Donchian Channels




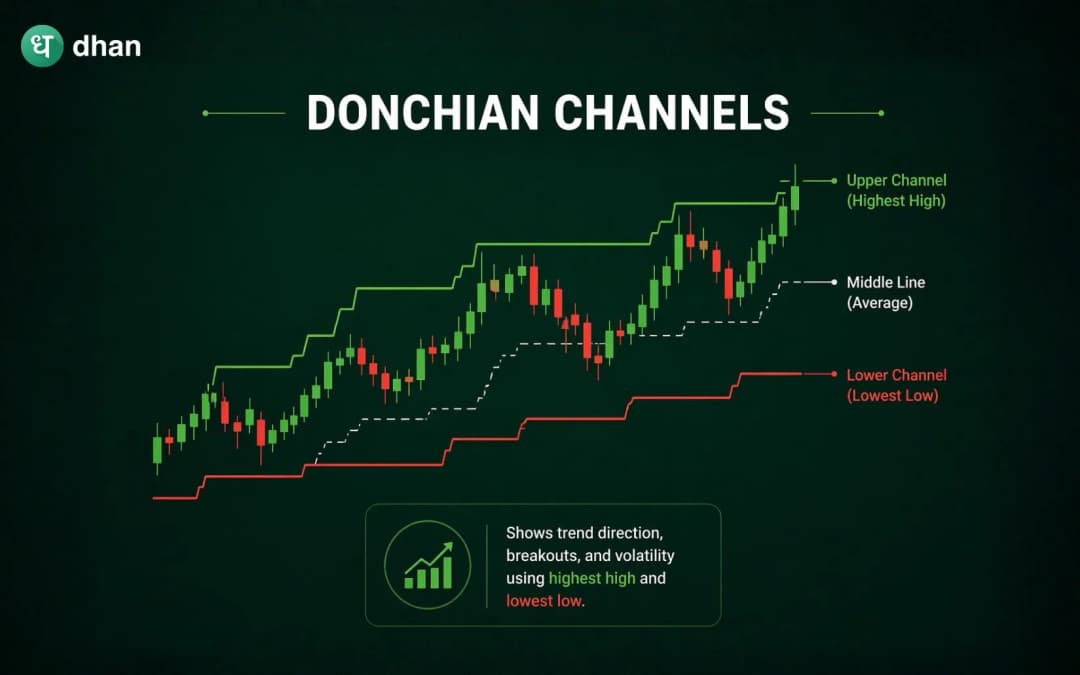




This indicator does not try to predict. It does not rely on complex formulas. In this blog, we will go deep into Donchian Channels - not just what they are, but how they behave, how traders actually use them, and where most people go wrong.
What are Donchian Channels?
Richard Donchian is known as one of the pioneers of trend-following strategies. He introduced this concept to help traders systematically identify breakouts. His philosophy was simple:
- Follow trends
- Avoid predictions
- Let price action lead decisions
Donchian Channels are a trend-following indicator that plots three lines based on price extremes over a fixed period. The upper band shows the highest price over a chosen period, the lower band shows the lowest price over that period, and the middle line is usually the average of the two.
These bands expand and contract based on the market volatility.
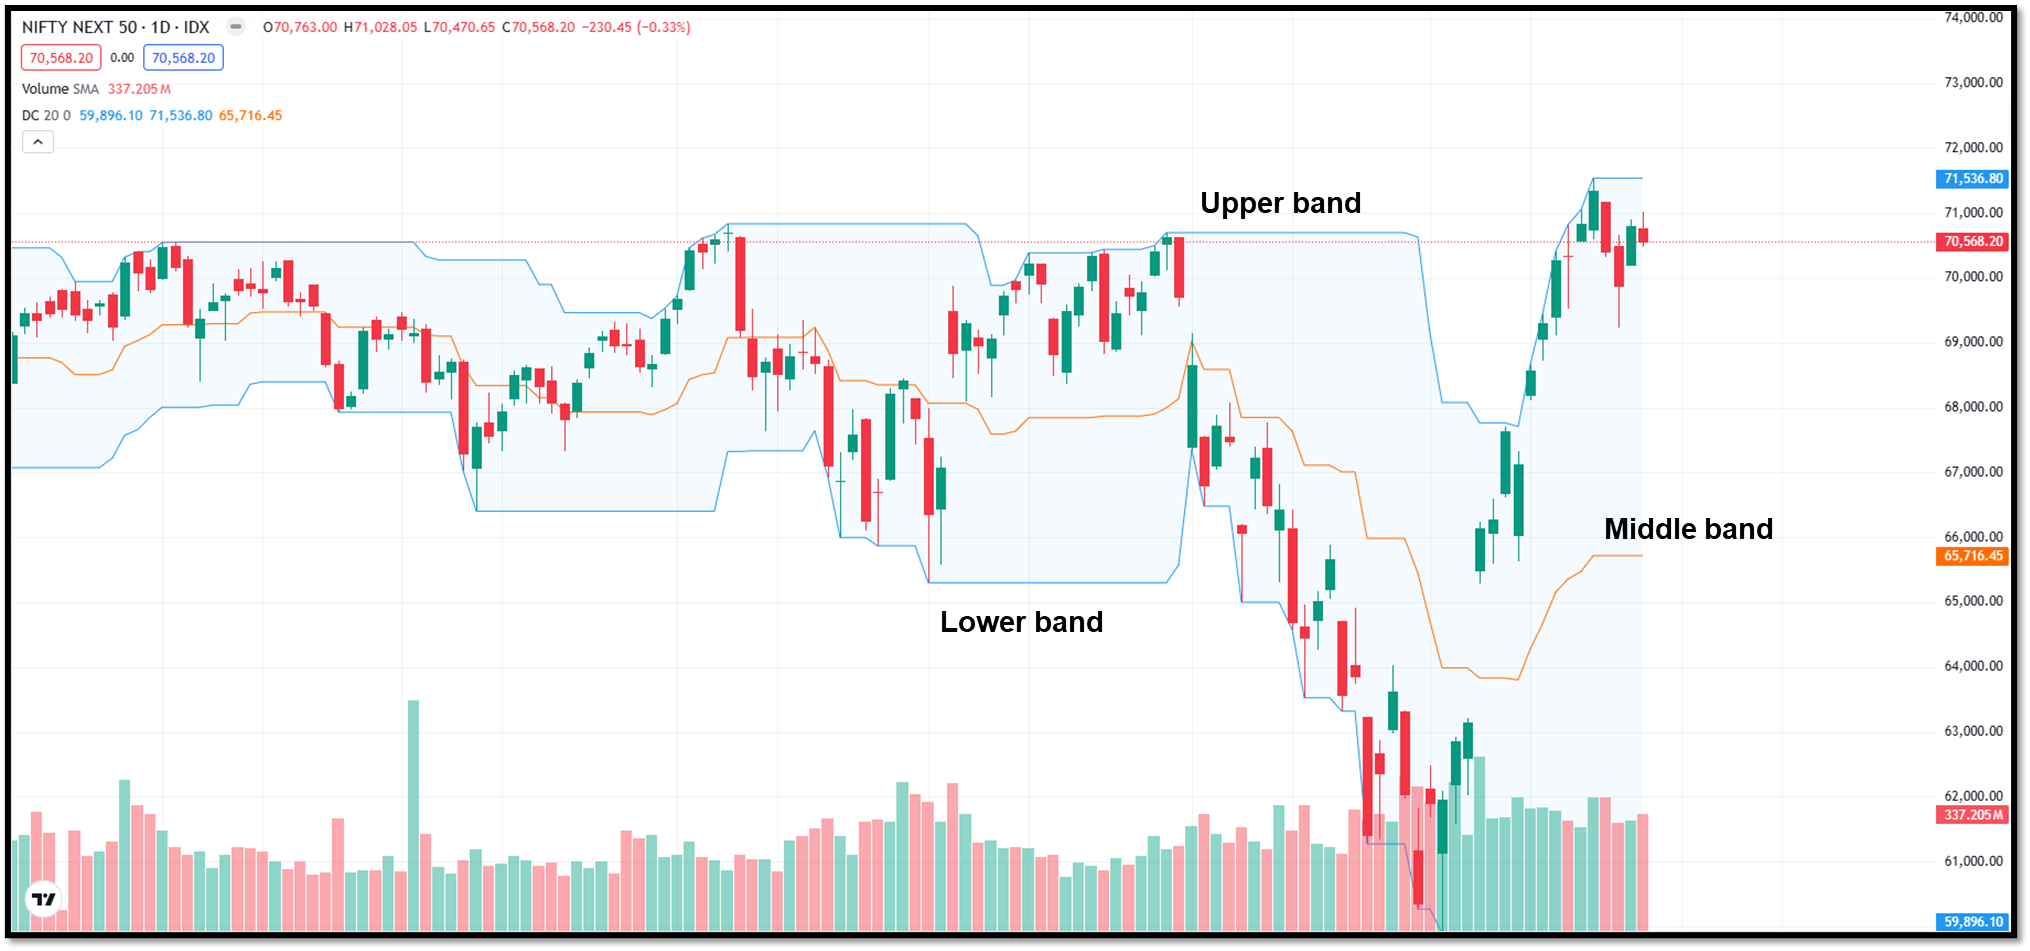
From above, you’ll notice three key behaviours of the indicator:
- When the price touches or breaks the upper band, it indicates a strong upward movement.
- When the price touches the lower band, it reflects strong downward pressure.
- When the price stays within the bands, the market is usually consolidating.
Importance of Donchian Channels
The logic behind the Donchian Channels is ‘Markets trend when they move beyond their recent highs or lows’.
If the price breaks above the upper band, it makes a new high for that period. This suggests buyers are strong enough to drive the price above the recent range. When the price breaks the lower band, sellers are in control in the same way.
This approach does not attempt to guess reversals. Instead, it reacts to confirmed strength or weakness.
How Donchian Channels are Calculated?
There are no complex calculations involved in Donchian channels. It uses the following concepts to calculate upper, lower, and middle bands:
- Upper band = the highest high over n periods
- Lower band = lowest low over n periods
- Middle band = simple average of upper band and lower band
- Upper band = max(High n)
- Lower band = min(Low n)
- Middle Band = Upper + Lower/2
Where n is the number of periods.
You can choose the value of n. A common default is 20 periods, but this can be adjusted depending on your trading style. A shorter period makes the channel more sensitive to price changes, while a longer period smooths out fluctuations and focuses on broader trends.
How Traders use Donchian Channels?
Traders use Donchian channels in various ways. Some key trading approaches are given below:
Breakout trading
This is the most common approach through which we can use Donchian channels in real trading.
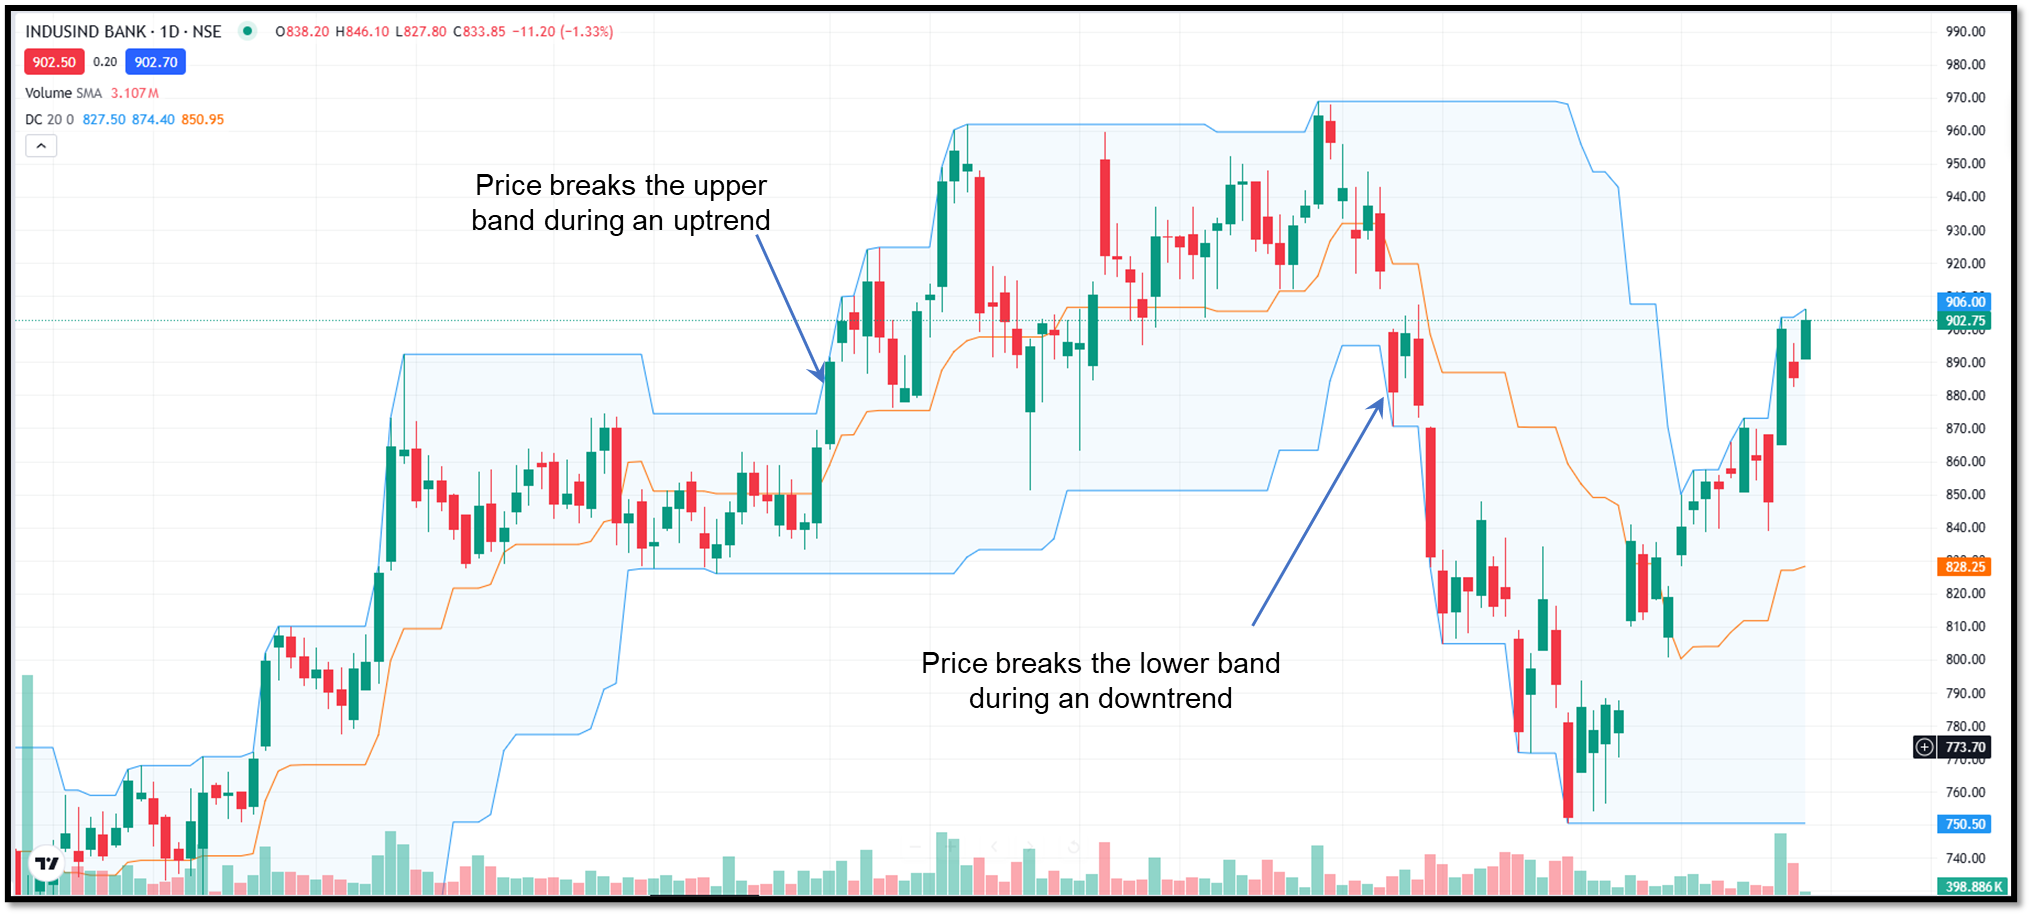
Traders watch for the price to move above the upper band and treat it as a potential buy signal. The logic is simple - if the price is breaking to new highs, momentum is likely building. The same applies on the downside. A break below the lower band can signal the start of a downward move.
This method focuses on capturing trends early, even if it means accepting a few false signals along the way.
Trend-following
In a strong uptrend, the price usually stays near or above the upper band. Instead of exiting too early, traders use the channel as a guide to remain in the position. Similarly, in a downtrend, the price tends to stay close to the lower band.
This behaviour allows traders to ride trends rather than constantly trying to time exits.
Understanding channel width
The distance between the upper and lower bands reflects volatility.
- A wide channel suggests high volatility and strong price movement
- A narrow channel indicates low volatility and consolidation
After periods of low volatility, the price usually breaks out. When the channels come closer to each other, it is a sign of market compression, which can lead to an expansion phase.
Entry strategies using Donchian channels
The following entry strategies were used by traders during actual trading.
Breakout entry
In this strategy, you enter when the price breaks out of the channel. The following steps are involved in this strategy.
- Sell when the price crosses below the lower band
- Buy when the price crosses above the upper band
This approach focuses on momentum and works best in trending markets.
Pullback-based entry
This is a lower-risk strategy than the breakout strategy. After the breakout, traders wait for a pullback towards the middle band before entering the position.
This reduces risk but may result in missed opportunities if the trend continues without retracement.
Exit strategies
Exit strategies include: opposite band exit strategy and a trailing stop using bands. These strategies are explained below:
Opposite band exit
A common exit method is to close the trade when the price reaches the opposite band.
For example, if you enter a long trade on an upper band breakout, you exit when the price approaches the lower band.
Trailing stop using bands
In trending markets, traders use the opposite band as a trailing stop. For example, in an uptrend, the lower band acts as a dynamic stop level and during a downtrend, the upper band acts as a dynamic stop level.
This allows traders to stay in the trade as long as the trend remains intact.
Right Period Setting in Donchian Channels
The effectiveness of Donchian Channels depends heavily on the period.
A shorter period, such as 10, reacts quickly to price changes and produces more signals. This can be useful for short-term trading but may lead to more false breakouts.
A longer period, like 50, smooths out the noise and homes in on the stronger trends. But could slow entries down.”
The setting depends on your trading style, timeframe, and tolerance for risk.
Advantages of Donchian Channels
Donchin channel offers the following advantages:
- It is very easy and simple to understand.
- The Donchian channel provides clear breakout levels and removes subjectivity from decision-making.
- It adapts to the changing market conditions automatically.
- They are particularly effective in markets that show strong directional movement.
Limitations of Donchian Channels
Despite their strengths, Donchian Channels are not perfect. It has the following limitations:
- The Donchian channel does not work effectively in a sideways market. During such a phase, prices may repeatedly cross the bands, and breakouts may fail quickly.
- The indicator also does not predict direction. It reacts to price, which means signals always come after movement begins.
Donchian Channels vs Bollinger Bands
While both indicators use bands, their logic is different.
Donchian Channels are based on price extremes — the highest high and lowest low. Bollinger Bands are based on statistical deviation from a moving average. It means that Donchian Channels focus on breakouts while Bollinger Bands focus on volatility and mean reversion.
When to Avoid Using Donchian Channels?
It is better to avoid this indicator when:
- The market is moving sideways
- Volatility is extremely low
- Price is repeatedly reversing within a range
In such conditions, breakout strategies become less effective.
Final Thoughts
The Donchian channel is the simplest indicator built on simple math. There are no complex formula’s are used to derive the value. It uses the high and low of a certain period. It does not predict the future, but it shows the current support and resistance values with respect to the ongoing price movements.
Traders use simple strategies like breakout and trend-following strategies to trade using Donchian channels. Although it works effectively in trending markets, it can give false signals in sideways markets.
FAQs
What is the main purpose of Donchian Channels?
Donchian Channels are used to identify breakouts and trends. They indicate when the price moves outside of its recent high or low, indicating the start of a directional move.
Are Donchian Channels leading or lagging indicators?
It is considered a lagging indicator, as the values are derived from past data.
Can beginners use Donchian Channels effectively?
Yes. They are one of the simplest indicators to understand because they rely only on price highs and lows. But beginners should still combine them with basic risk management.
Do Donchian Channels work in intraday trading?
Yes, but you must change the period setting. Intraday charts tend to use shorter periods, but this can lead to more false signals.
Can Donchian Channels be used alone?
They can be used alone, but combining them with other tools improves accuracy and reduces false signals.







