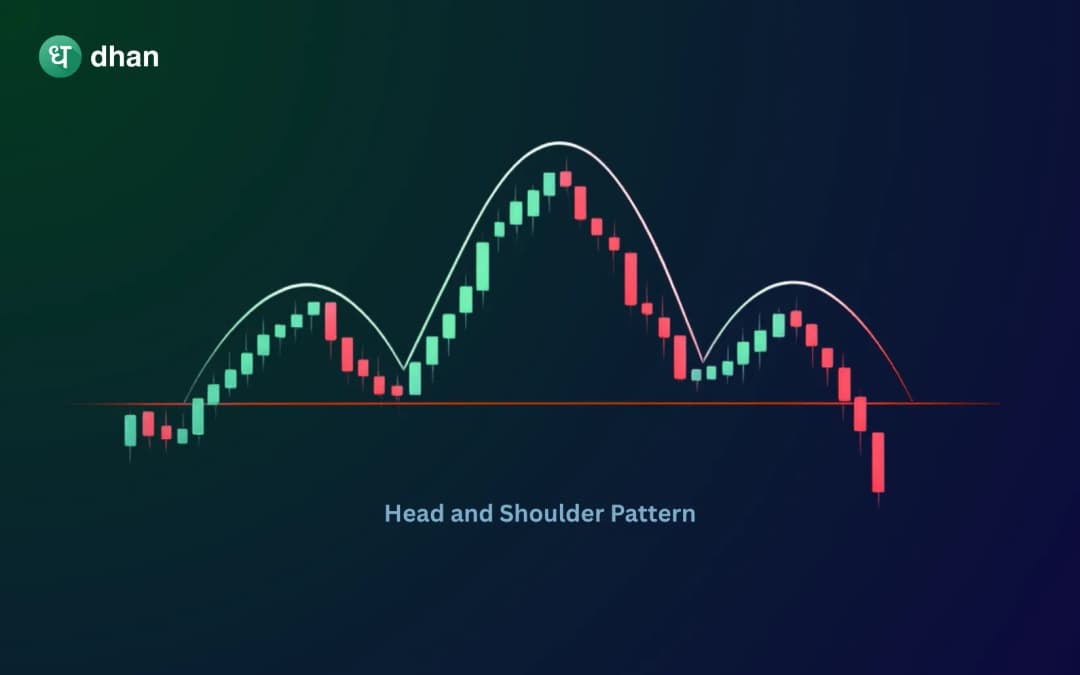
Head and Shoulders Pattern
Head and Shoulders Pattern is an indicator of a possible change in trend direction, usually from bullish to bearish and is often utilised by traders to spot market tops and entry/exit strategies making it one of the most popular and most trusted reversal patterns of technical analysis.
Team Dhan
|Apr 17, 2026, 03:47 PM
Team Dhan
|Apr 17, 2026, 03:47 PM