



Ladder Bottom Candlestick Pattern








Key takeaways
- The ladder bottom is a bullish candlestick formation made of five candles.
- It shows that buyers are progressively gaining power and selling pressure is reducing.
- When the fifth candle finishes firmly bullish, indicating a possible trend reversal, the pattern is verified.
- Traders typically place the stop-loss below the pattern's lowest low and target the next resistance level or maintain a favourable risk-reward ratio.
- The ladder bottom should always be used alongside technical analysis and proper risk management, rather than as a standalone trading signal.
Every market trend eventually reaches a turning point. Selling pressure frequently starts to weaken after a long downtrend as buyers progressively regain confidence.
Certain bullish reversal patterns appear in one or two trading sessions, but others take several candles to form, giving traders a better understanding of shifting market sentiment.
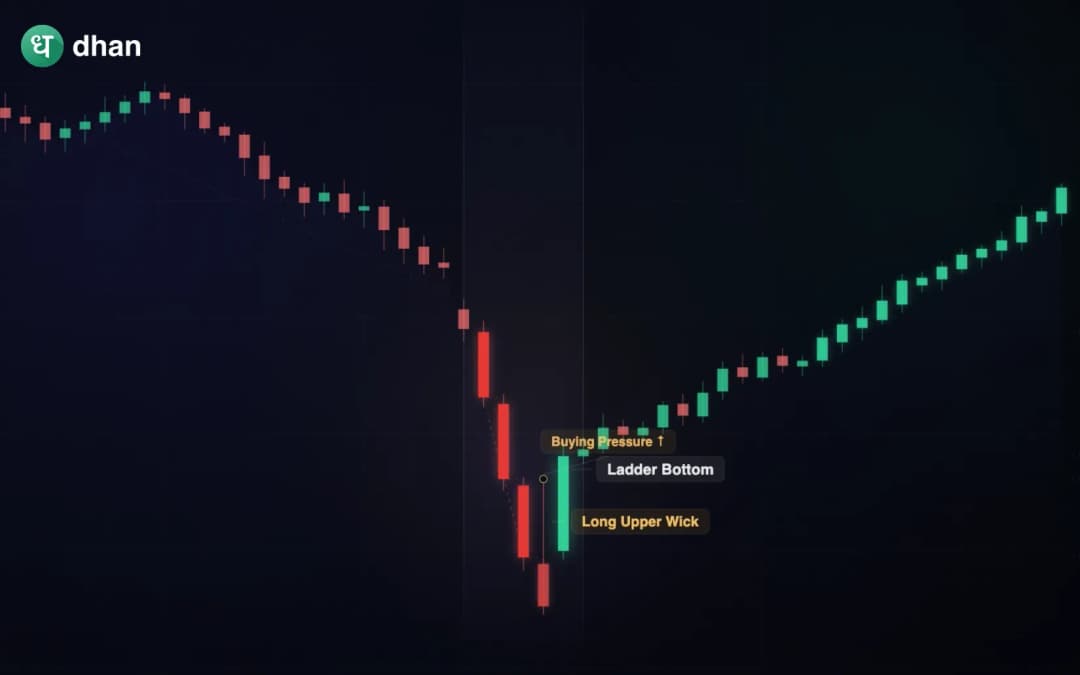
One such bullish reversal pattern is the ladder bottom candlestick pattern. It emerges following an extended downward trend and suggests that buyers are gradually gaining control as bearish momentum may be waning.
This article will explain the ladder bottom candlestick pattern, its formation, its psychology, how to spot it on a chart, and the important things traders should think about before incorporating it into their trading approach.
What is the Ladder Bottom Candlestick Pattern?
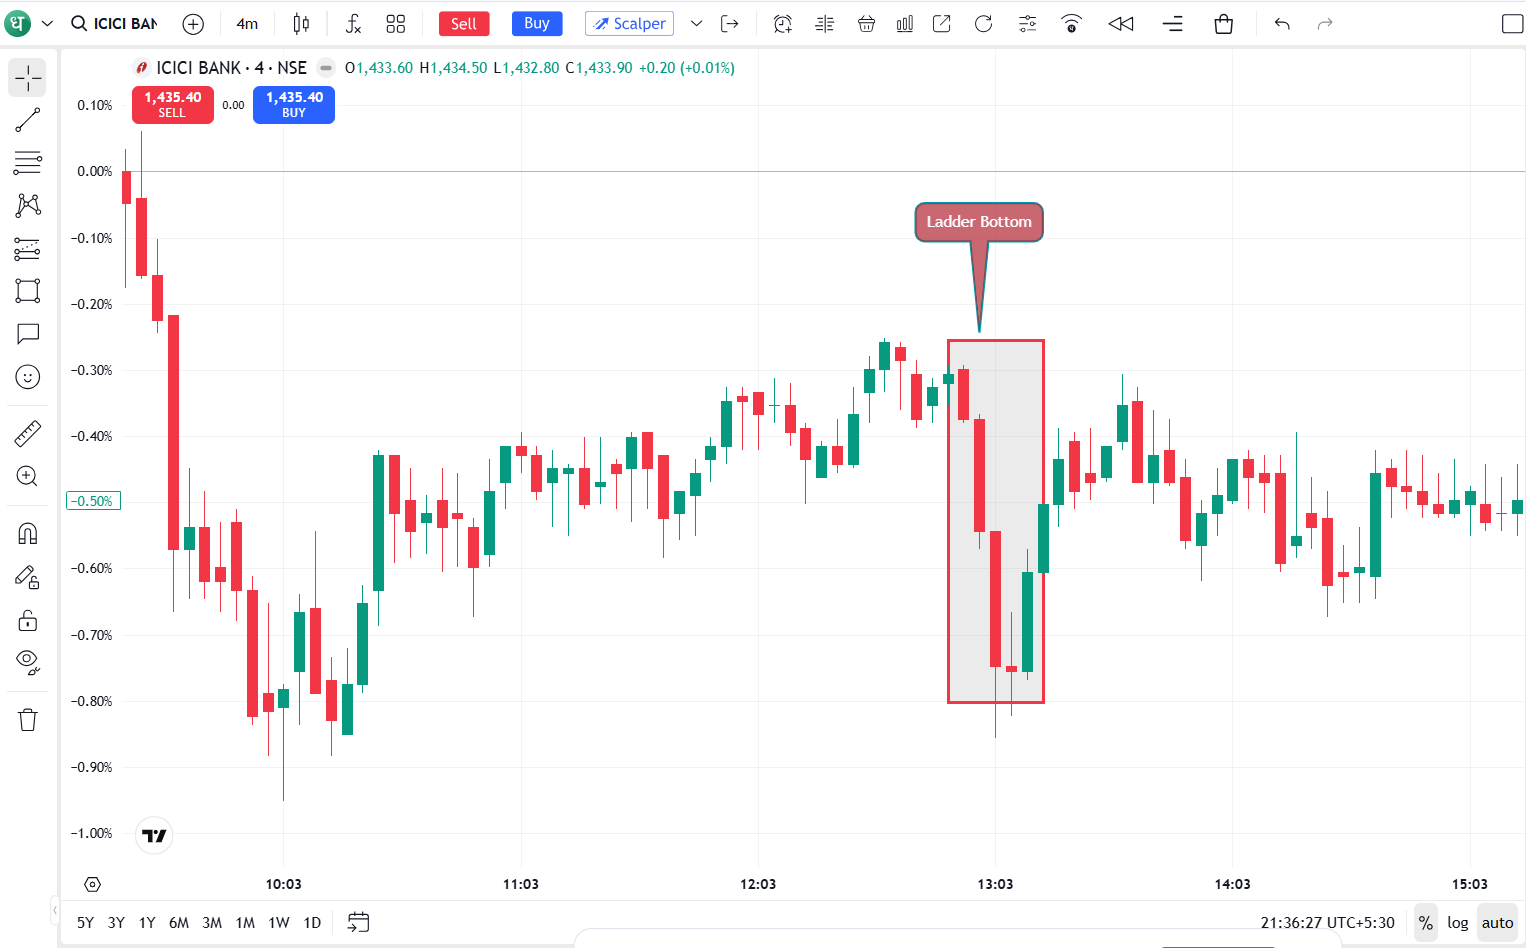
The ladder bottom is a downtrend followed by a five-candlestick bullish reversal pattern. It implies that buyers are starting to take over the market while sellers are progressively losing power, raising the probability of a bullish trend reversal.
Traders should never trade without further confirmation, which could include higher trading volume, momentum indicators, or breaking above a resistance level.
Structure of the Ladder Bottom Pattern
Five consecutive candlesticks, each signifying a slow change in market sentiment, make up the ladder bottom.
Market psychology behind the Ladder Bottom Pattern
A steady change in market sentiment from negative to bullish is shown in the ladder bottom pattern. It indicates that buyers are gradually gaining power while selling pressure is decreasing.
Sellers control the market and keep driving down prices during the pattern's early stages. Bearish momentum starts to decrease as the pattern progresses, and buyers start expressing interest at lower price points. Buyers are trying to recover control when a long upper shadow appears on the fourth candle.
Stronger buying interest is confirmed by the final bullish candle, which also implies that market sentiment may be turning in favour of the bulls.
How to trade the ladder Ladder Bottom Pattern
Even though the ladder bottom indicates that negative momentum might be waning, traders should refrain from taking a position as soon as they notice the pattern. Acting on a false signal can be less likely if you wait for confirmation.
Verifying the pattern, preparing the entry, quantifying the risk, and establishing reasonable profit goals are all part of a disciplined trading strategy.
1. Wait for the bullish confirmation
Only when all five candles have been created is a ladder bottom pattern considered finished.
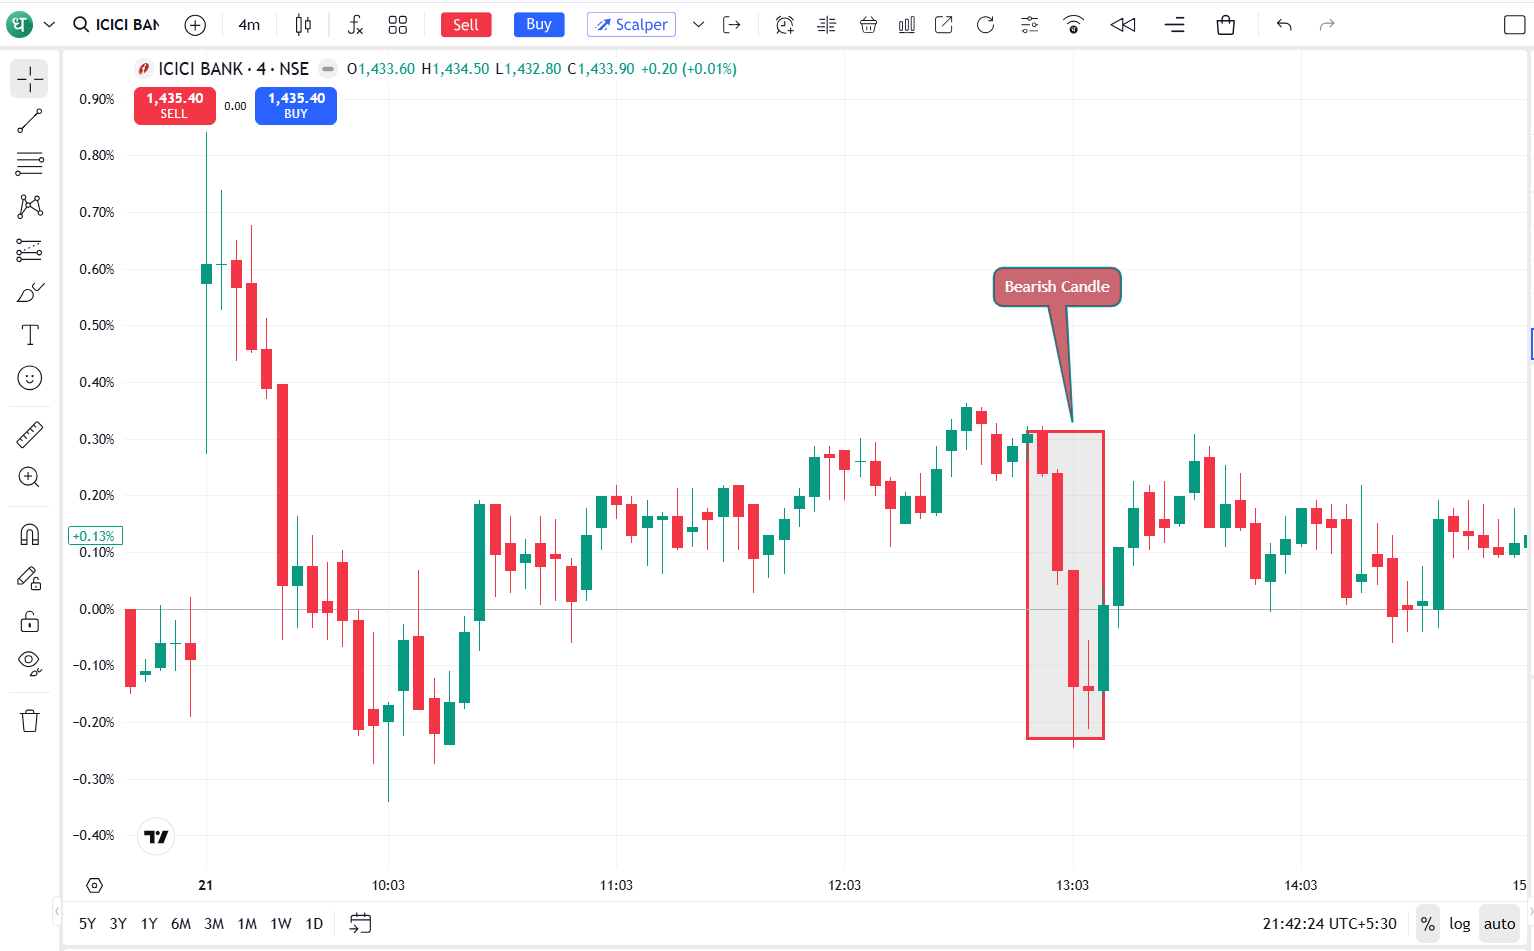
- The first three candles should show persistent selling pressure and continue the existing downtrend.
- The fourth candle shows that buyers are starting to resist lower prices, even if it is still bearish and has a noticeable upper shadow.
- In order to confirm growing purchasing momentum, the fifth candle should be a strong bullish candle that closes above the body of the fourth candle.
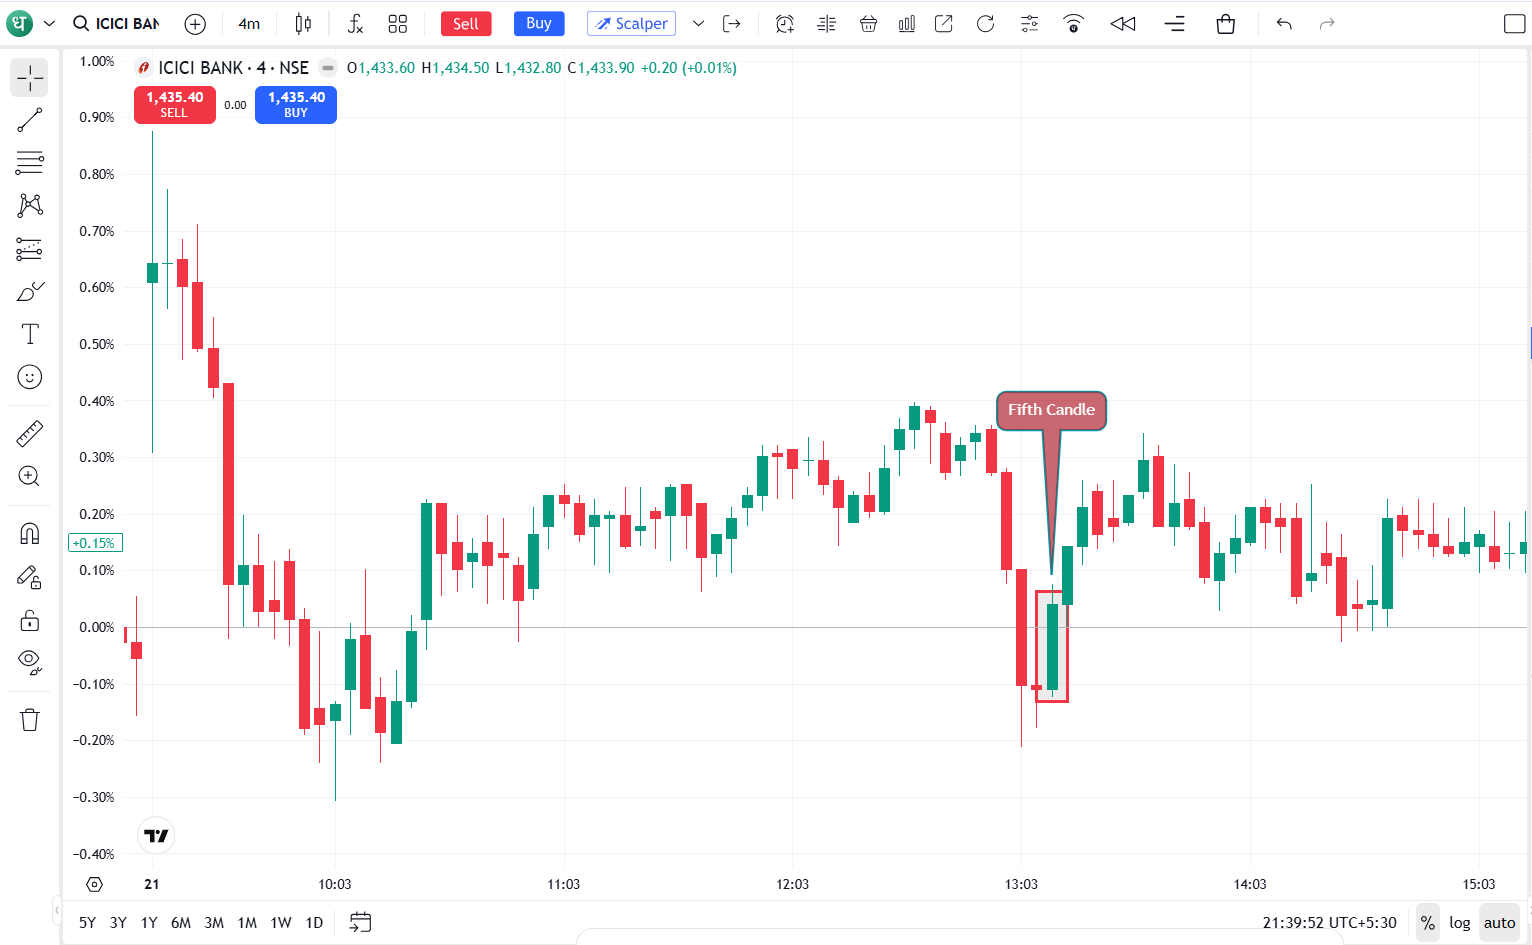
Acting on an incomplete pattern could occur if a trade is entered before the fifth candle closes. When the fifth bullish candle breaks above a close resistance level or is accompanied by increased trading volume, it is a stronger confirmation.
2. Decide your entry
There are two common ways to enter a trade:
- Conservative approach: Trade only when the price breaks above the high of the bullish candle in the next session. This is another way to ensure that buyers are in control.
- Aggressive approach: After the fifth bullish candle closes, enter right away. This increases the risk in the event that the reversal fails but allows an earlier entry.
3. Place your stop-loss
To manage risk, place your stop-loss:
- Below the lowest point of the ladder bottom pattern.
- Below the bullish candle's low if you prefer a tighter stop-loss.
A stop-loss should not be placed too close to the entry because normal price fluctuations could cause an early exit.
4. Plan your exit
It's as essential to have a clear exit plan as it is to have a clear entry plan. Don't keep the trade for as long as it can go on; instead, set a profit target before you enter the trade.
- Booking profits at the next resistance level.
- A trailing stop-loss if the uptrend continues.
5. Strengthen the signal with confirmation
When combined with other technical indicators, the ladder bottom pattern becomes more reliable, such as:
- The bullish candle's increasing trading volume.
- RSI moves out of the oversold zone.
- A bullish MACD crossover.
By using these confirmations, the probability of a successful trade can be increased, and weaker setups can be eliminated.
Advantages of the Ladder Bottom Candlestick Pattern
Many traders regard the ladder bottom pattern because it provides early indications of a possible bullish reversal following an extended downturn. It can assist traders in finding favourable entry opportunities when combined with technical analysis and appropriate risk management.
Some of its key advantages include:
- Helps traders identify potential reductions of bearish momentum.
- Compared to certain single-candle formations, the pattern is easier to understand because of the slow transition from sellers to buyers.
- Trade confirmation can be enhanced by combining the pattern with indicators like RSI, MACD, and volume.
- Intraday, daily, weekly, and monthly charts can all show the pattern.
- The pattern naturally encourages a more structured trading strategy because it calls for confirmation.
Traders should always consider the ladder bottom in the context of the larger market rather than depending only on it, even if it can be a helpful reversal indicator.
Limitations of the Ladder Bottom Candlestick Pattern
By knowing its drawbacks, traders can make better decisions and not use the pattern as a sole basis for their trades.
Some common limitations include:
- The ladder bottom is not as common as patterns like the Hammer or Bullish Engulfing.
- Trades that are entered without confirmation have a higher likelihood of failure.
- When markets are trending, the pattern typically performs better than when they are sideways or extremely volatile.
- Traders must use other technical tools, like support and resistance levels, to identify exit points.
Instead of using the pattern as a guaranteed trading signal, traders can use it in connection with more analysis if they are aware of these limitations.
To wrap up
The ladder bottom candlestick pattern is a bullish reversal pattern that may show a slow transition from selling pressure to buying demand. Its five-candle structure is a valuable addition to technical analysis since it gives traders insightful information about shifting market sentiment.
On its own, though, no candlestick pattern is completely reliable. Before making a trade, traders should always use technical indicators, trading volume, support and resistance levels, and good risk management techniques to confirm the ladder bottom.
FAQs
1. Is the ladder bottom candlestick pattern bullish or bearish?
After a downtrend, the ladder bottom is a bullish reversal pattern that suggests that buyers are starting to gain control and that selling pressure may be waning.
2. How many candles form the ladder bottom pattern?
Five consecutive candlesticks make up the pattern; the first four show a weak downtrend, while the fifth indicates an increase in buying interest.
3. What is the success rate of the ladder bottom candlestick pattern?
There is no success rate for the ladder bottom. As with all candlestick patterns, its effectiveness relies on confirmation by price action, volume and the market trend.
4. Which timeframe is best for the ladder bottom pattern?
The pattern can show up at any point in time. However, a lot of traders believe that signals on weekly and daily charts are more reliable than those on shorter intraday charts.
5. Can beginners use the ladder bottom pattern?
Yes. As long as they understand how the pattern is formed, wait for confirmation, and adhere to appropriate risk management procedures, beginners can use it.







