


How to find breakout stocks?




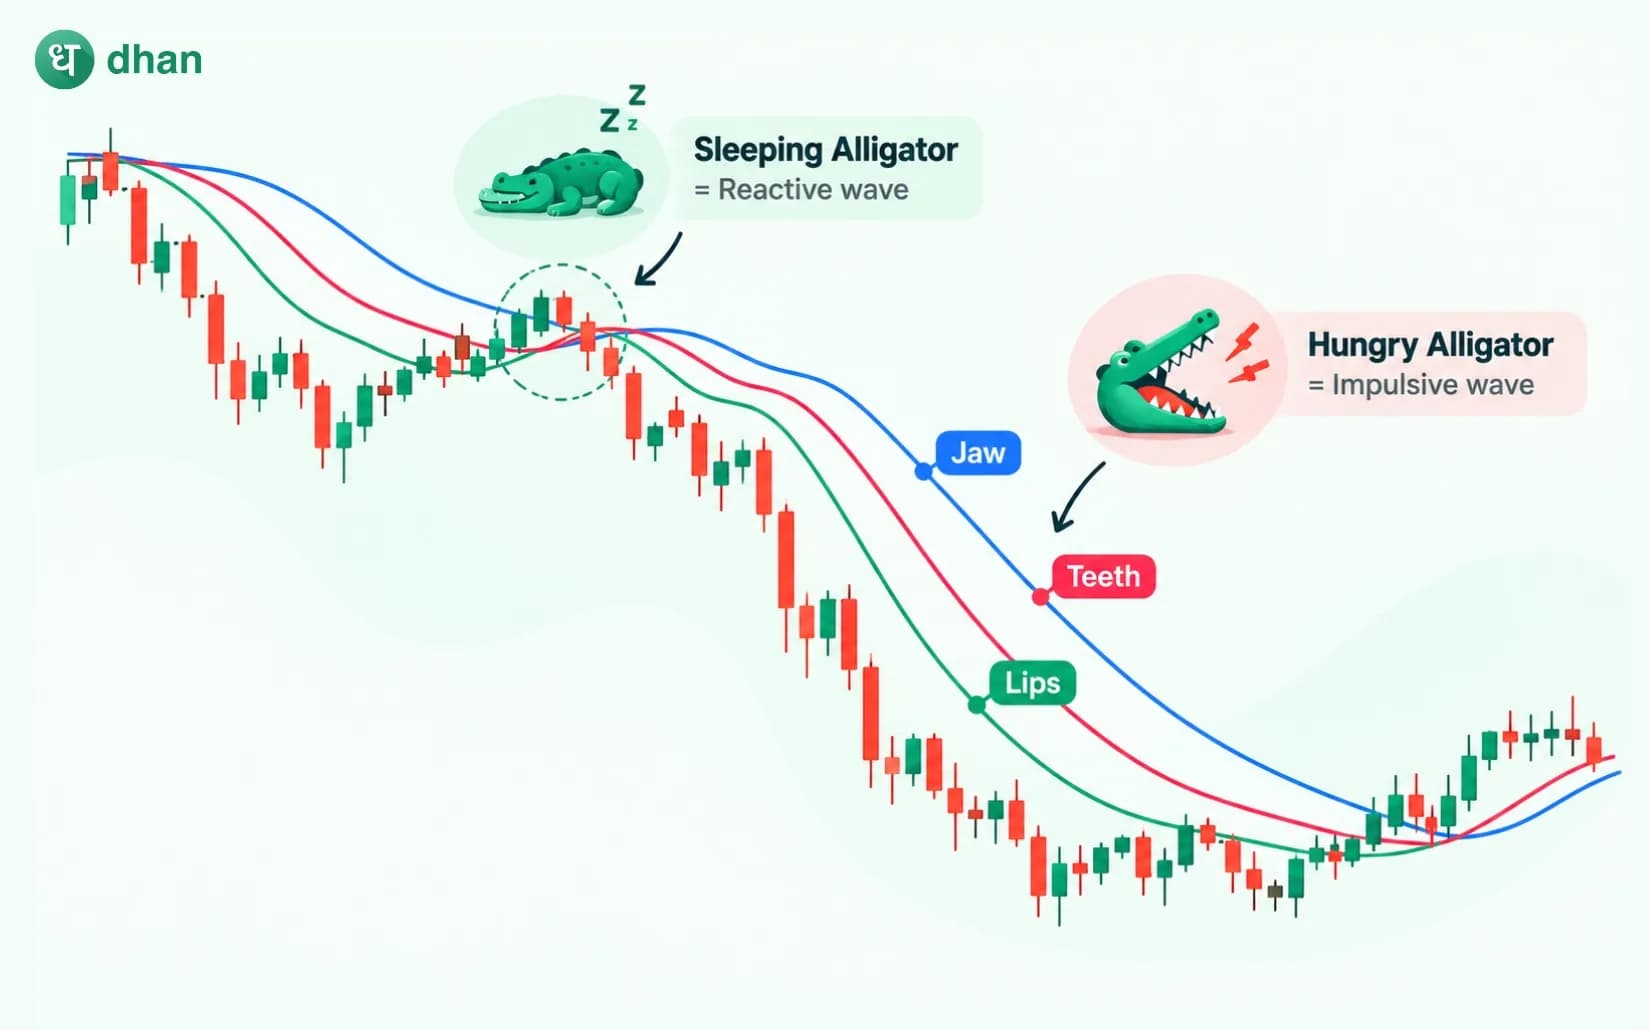
In the dynamic landscape of stock trading, the ability to identify early breakout stocks can be an absolute game-changer for traders. A breakout occurs when the price of a stock breaks above a specific level of resistance or below a support level with an increase in trading volume. It signals the potential start of a new trend. Traders are always keen on such opportunities as they are often signs of significant price movements.
However, it's not enough to spot a price moving above or below a specific price level; it is crucial to be sure of the validity of the breakout to be able to separate real opportunities and false signals. In this blog, we will explore the ways to find high volume breakout stocks.
What is a breakout?
A breakout in the stock market is when the price of a stock moves strongly above a specified resistance or support point.
This event, with high trading volume, marks a potential change in supply and demand dynamics and signals the beginning of a new trend. As stock prices move in patterns within support and resistance ranges. The constituents that constitute a potential breakout are:
- Resistance: This is a price level where upward momentum has previously stalled out, and where selling pressure has historically been able to overcome buying pressure, preventing further increases in that price. This level acts like a ceiling.
- Support: On the other hand, this is a price level at which there is usually a bottom to downward momentum, and buying pressure has historically been stronger than selling pressure, which has prevented further price declines. This acts like a floor.
How to confirm a breakout stock with volume
Volume is the most important indicator in confirming a true breakout stock on Scanx. It represents the number of shares traded during a specific time period. Trading volume provides insights like:
Upside breakout: A strong upside breakout stock should be accompanied by a significant surge in trading volume. This means that there is a large number of buyers taking part in the move, thus giving the conviction and momentum needed to push the price higher. If a stock breaks above resistance but with low trading volume, this signals that there is a lack of investor participation, and it is more likely to be a false breakout.
Downside breakout: Similarly, a downside breakout stock (breaking below support) should ideally be confirmed by increased selling volume. This means that the sellers are aggressively liquidating their positions, which is driving the price down. A downside breakout, which occurs with a significant uptick in volume, adds more conviction to the authenticity of breakout stocks.
How to interpret trading volume levels?
- Compare the current trading volume of the stocks to their average trading volume over the last 20-50 periods.
- Look for trading volume that is at least 1.5x to 2x (or even higher) than the average trading volume on the breakout day.
- Analyse high volume breakout stocks volume activity leading up to the breakout. Reducing trading volume throughout the consolidation phase and a sudden burst of trading volume on the breakout day is a strong signal.
Support and resistance as breakout triggers
Support and resistance levels are the foundation of breakout trading. These are price levels where the stock has historically struggled to move beyond.
Resistance Becomes Support: In the case of a bullish breakout, the former resistance level of a stock will often become a new support level once the stock breaks decisively above it. This flip is a powerful confirmation. Traders often look for a retest of this newly formed support, which involves price pulling back to the breakout level and then bouncing off it, as a secondary confirmation. A strong retest confirms the strength of the breakout stock.
Support Becomes Resistance: On the other hand, in the case of a bearish breakout, once a stock breaks below a key support level, that previous support level often becomes a new resistance level. A retest where the price rallies back towards this level but is rejected is further confirmation of the downside trend.
Other confirmation triggers
While volume levels are paramount indicators, there are other indicators that traders can also consider to enhance their breakout stock conviction. Some of these are:
Candlestick patterns
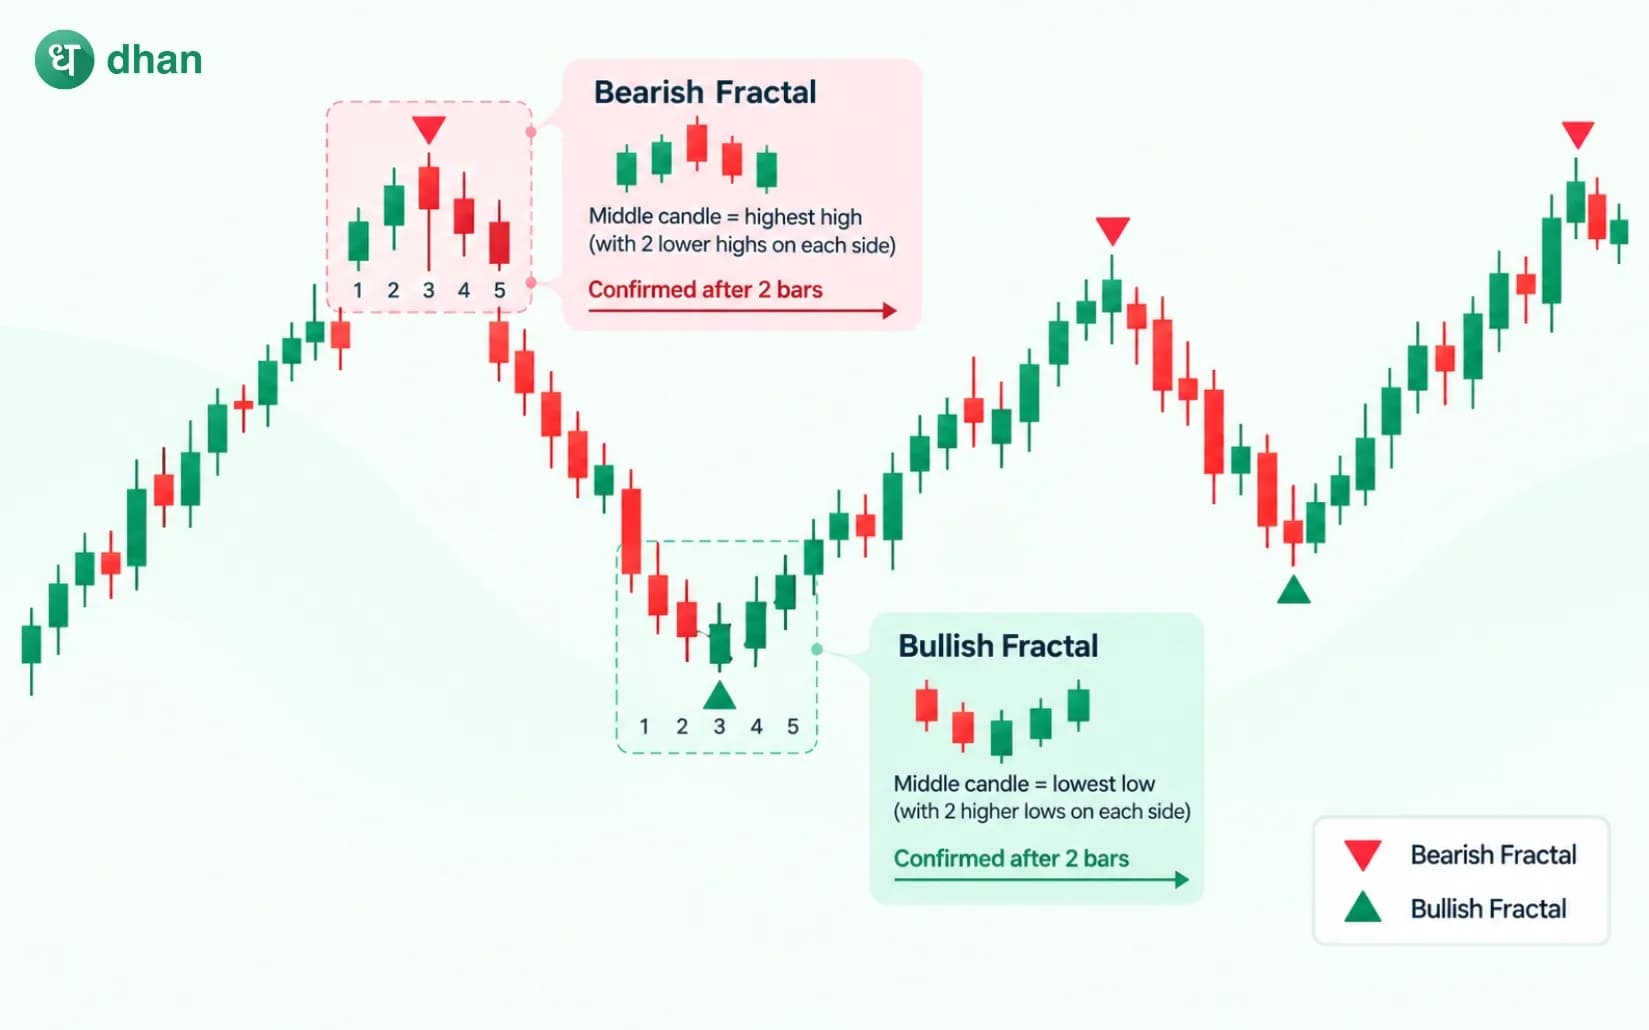
Several candlestick patterns can signal the potential of a market breakout by indicating a shift in momentum or market indecision, which is often followed by a strong move once a key level is breached. The most relevant patterns for breakout stock are usually formed as part of larger chart formations, such as triangles or flags, or single/multiple candle reversal signals at key levels of support/resistance.
Technical indicators
Traders can use technical indicators like:
- Use moving averages such as the 50-day or 200-day to detect the direction of the trend.
- Watch RSI (Relative Strength Index) for overbought or oversold conditions.
- MACD (Moving Average Convergence Divergence) is used to confirm the strength of trends.
Overall market sentiment
Consider broader market sentiment, whether it is bullish, bearish, or consolidating. Upside breakouts are more reliable in a bullish or neutral market. Downside breakouts are more reliable in a bearish or neutral market. Trading against the market trend increases the risk of a false breakout stock.
Sector performance
Examine the sector to which the stock belongs; if it also shows the same strength (upside breakouts) or weakness (downside breakouts) as the stock, then it is a genuine breakout stock. A sector-wide move adds credibility to the individual stock's breakout.
Multiple timeframe confirmation
If the stock breaks out on a daily chart, look for similar bullish signals on a weekly chart. This provides a broader perspective and validates the strength of the trend. On the other hand, if a stock breakout occurs on the daily chart but that contradicts the weekly patterns, proceed with caution, as it may be a false breakout stock.
The retest or pullback
Often, after an initial breakout, the stock price will retreat to retest the breached level. For an upward breakout, the former resistance becomes new support. If the stock price manages to hold this retested level and bounces higher, this gives strong confirmation that the breakout is valid. This retest gives a second chance for entry to traders with potentially less risk, as the broken level has shown itself to be a strong new support or resistance.
- Successful Retest: Stock price touches or nears the broken level and continues moving in the direction of the breakout.
- Failed Retest (False Breakout): Stock price breaks the retested level and moves back into the old range.
- Absence of Immediate Rejection: On the occurrence of a breakout, the stock price should not immediately reverse and fall into the previous trading range on the subsequent trading days. Continued price action beyond the breakout level is a sign of sustained breakout in a stock.
Identification of false breakouts
False breakouts are the biggest traps for traders on Scanx, resulting in significant losses. Here's how traders identify and avoid false breakouts:
- Low volume breakouts: The most common sign of a false breakout stock is low trading volume. If the stock price pushes through a level without significant volume, these breakouts are often false breakouts.
- Lack of follow-through: A true breakout stock should exhibit continued momentum in the direction of the breakout. If the price reverses or consolidates back immediately after the breakout, it may be a false signal.
- Weak closing price: For an upside breakout, if the stock price breaks above resistance but then sharply reverses to close below or barely above the resistance level, this is a sign of weakness and suggests a false breakout.
- Whipsaws: Stock price moves above resistance but falls back below it instantly, usually with high volume, trapping buyers, and is an indicator of a false breakout.
To wrap up
Finding and validating breakout stocks could be an effective way to take advantage of significant movements in price. By analysing price movements together with high trading volume and confirming by re-tests, traders might enhance their likelihood of being successful at finding genuine breakout trading opportunities.
Although every strategy comes with its risks, with an understanding of the nuances of breakout confirmation and using stop loss orders, traders can successfully navigate this dynamic Indian stock market, while capitalising on potential signals into attractive returns.
FAQs
1. What is a false breakout?
A false breakout occurs when the price of a stock breaks through a key level of support or resistance but then reverses itself and returns to its original range. It can be gauged based on lack of volume confirmation, along with the breakout or weak close past the breakout level, or a quick reversal after the breakout.
2. How important is the volume in breakout trading?
Volume is a key metric to determine breakout stocks, since breakouts with high trading volume are more likely to be genuine, as there is high market interest in the breakout. A large increase in trading volume confirms that the market is in agreement with the price movements, which is a vital component in confirming breakout stocks.
3. What are the risks associated with trading breakout stocks?
Trading breakout stocks involves many risks, including false breakouts, which can lead to significant losses. Additionally, even when breakouts retest the breakout level, it results in emotional stress.
4. Are breakouts always reliable indicators of trend changes?
Not always, some breakouts are false, where the stock price moves beyond a specific level for a short period of time, but quickly moves back to previous levels. Thus, in order to identify true breakout stocks and sustained changes in the market trend, traders should use several indicators to verify the sustainability of the trend change.
5. How can I mitigate risk when trading breakout stocks?
To reduce the risk, use stop-loss orders to limit potential losses if a breakout doesn’t occur. Check for strong trading volume and a solid close above the breakout level to avoid false signals.