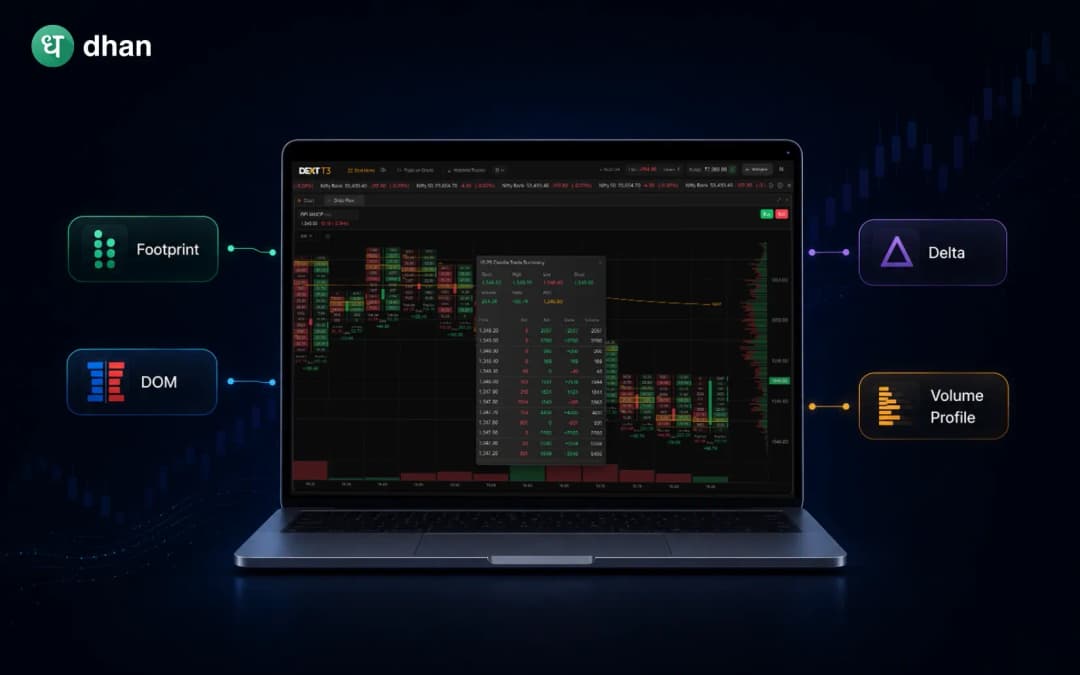
How to Read Footprint Charts? Imbalances, Absorption, and Delta Explained
Once traders understand the basic concepts, footprint charts can provide deeper insight into market behavior. In this article, we will break down how footprint charts work and explain important concepts like imbalances, absorption, and delta.

Shriram Shekhar
|Jun 16, 2026, 03:02 PM
Shriram Shekhar
|Jun 16, 2026, 03:02 PM