



Inverse Head and Shoulders Pattern








Key takeaways
- The inverse head and shoulders pattern is a bullish reversal chart pattern that can signal a possible shift from a downtrend to an uptrend.
- It has three lows: a left shoulder, a deeper head, and a right shoulder, with a neckline acting as the breakout level.
- A confirmed breakout usually occurs when the price closes above the neckline.
- Traders commonly use the neckline breakout for entries and the pattern’s height for estimating price targets.
Chart patterns help traders interpret market psychology through price movement. Among reversal patterns, the inverse head and shoulders is one of the most widely recognised because it provides a structured way to identify when bearish momentum may be weakening, and buyers may be taking control.
If you have ever watched a stock fall for several sessions, appear to stabilise, and then suddenly reverse sharply upward, there is a good chance some form of reversal structure was developing underneath that move. The inverse head and shoulders pattern is designed to capture exactly that transition.
In this guide, we will learn about the inverse head and shoulders pattern, how it works, why it forms, how to identify it correctly, and how traders commonly use it in real market conditions.
What is the inverse head and shoulders pattern?
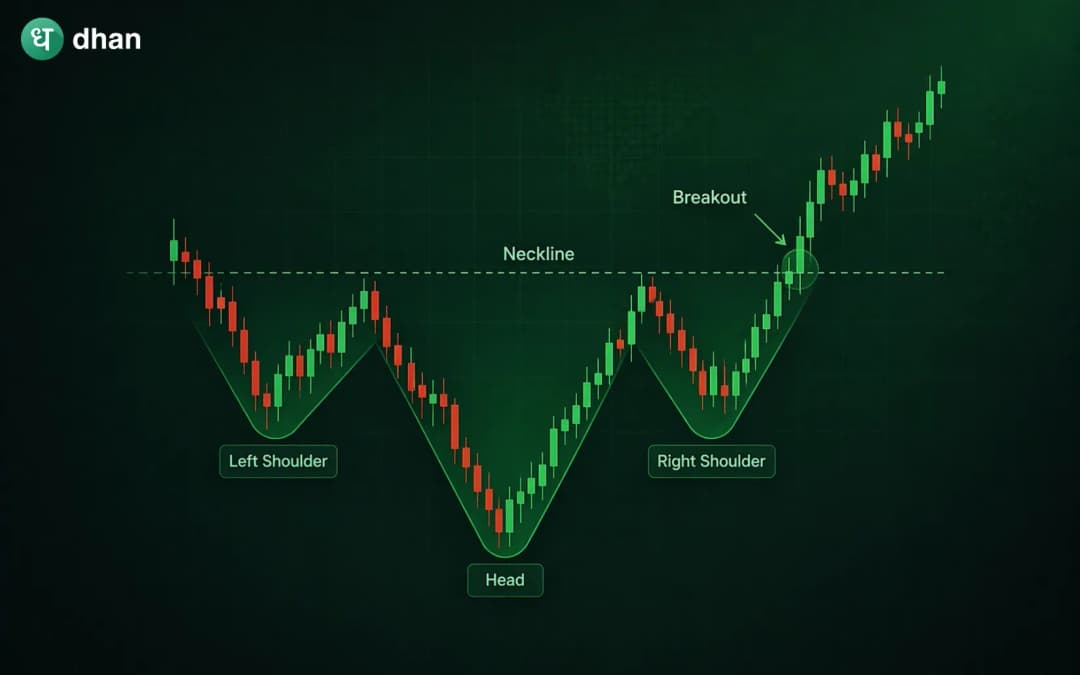
The inverse head and shoulders is a bullish reversal chart pattern that appears after a downtrend. This suggests that sellers are losing power and buyers are beginning to soak up supply and take control.
The inverse head and shoulder structure contains three different swing lows:
- Left shoulder: the first decline followed by a rebound
- Head: a deeper decline followed by another recovery
- Right shoulder: a shallower decline showing reduced selling pressure
- Neckline: resistance formed by connecting the highs between the shoulders and head
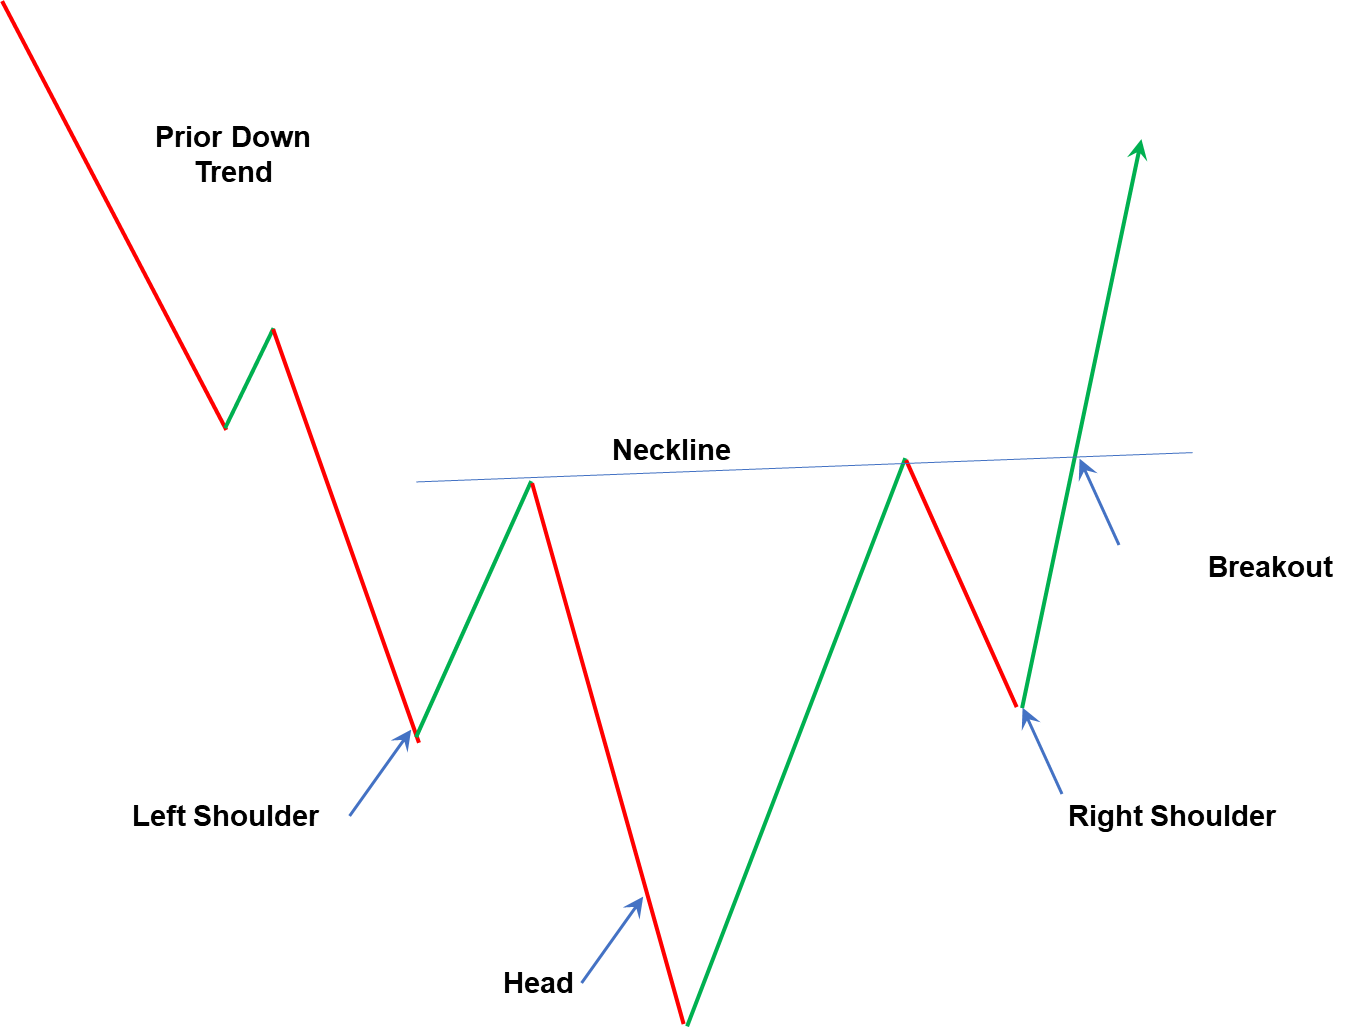
Once price breaks above the neckline, it usually confirms that the prior downtrend may be reversing. The shape resembles an upside-down human head with shoulders, which is where the name comes from.
Understanding the structure
The pattern has three primary components. These components represent the psychology of the traders.
Left shoulder
The left shoulder forms during an existing downtrend. Price falls, reaches a temporary low, and then rebounds. The market still appears bearish because pullbacks during downtrends are normal. But this pullback alone does not signal a reversal.
Head
After the rebound, sellers again push the price down. But this time, the price falls below the previous low. This deeper low usually shakes out weak hands and reinforces bearish sentiment.
However, if the price recovers again instead of continuing lower aggressively, it hints that selling momentum may be weakening.
Right shoulder
After the formation of a head, buyers push the price to the previous high, where sellers again come into play. They try to push the price downward, but the price fails to make a new low. Instead, the decline remains shallower than the head. This suggests reduced bearish conviction.
Neckline
The neckline is the resistance level formed near the peaks between the shoulders and head. A breakout above this level is treated as pattern confirmation. The neckline can be:
- Horizontal
- Slightly upward sloping
- Slightly downward sloping
All three can be valid depending on the price structure.
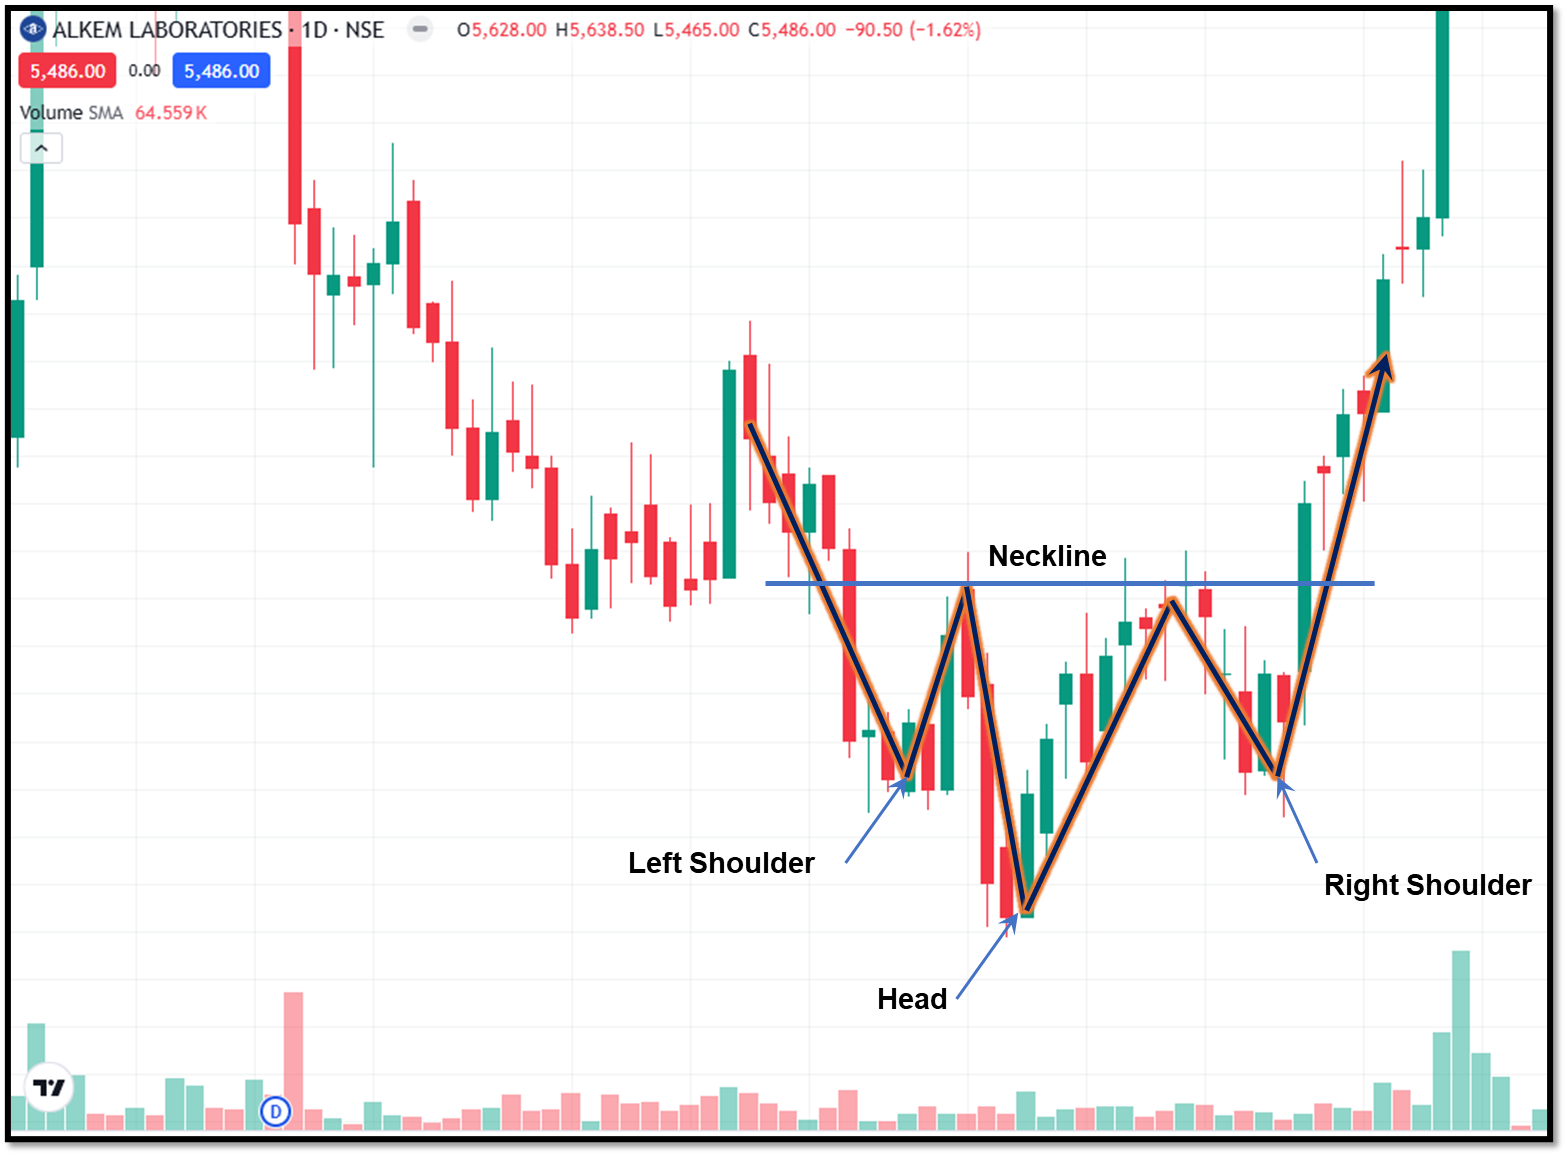
The psychology behind the pattern
Chart patterns are visual representations of trader behaviour. The inverse head and shoulders reflect a gradual shift in control.
Before the formation of the left shoulder, the market was in a downtrend. Sellers were confident, but buyers stepped in and pushed the price upward. But sellers are still confident as the pullbacks happen during large trends.
Sellers again pushed the price downward, making a deeper low (the head). For a normal trend, it could have triggered a major downside move. But here, buyers feel the attractive pricing. Hence, buyers absorb supply and push the price back upward.
After prices move upward, sellers attempt another decline but fail to create a lower low. This suggests downside momentum is weakening. Buyers step in and try to push the prices above the neckline. When the breakout occurs, momentum traders may jump in, short sellers may get out, and new bullish interest can accelerate the move.
How traders use the inverse head and shoulders pattern
Traders use different strategies while trading with an inverse head and shoulder pattern. You can use the following approach:
Entry
The safest entry point is after the breakout. Enter once the price breaks the neckline. This entry point gives confirmation, but it also makes the entry too late when almost half of the move is completed.
Sometimes price breaks out, then returns to the neckline before moving higher. Enter when the retest happens. It gives a better risk-to-reward ratio, but you may lose the trade if the retest never happens.
Target
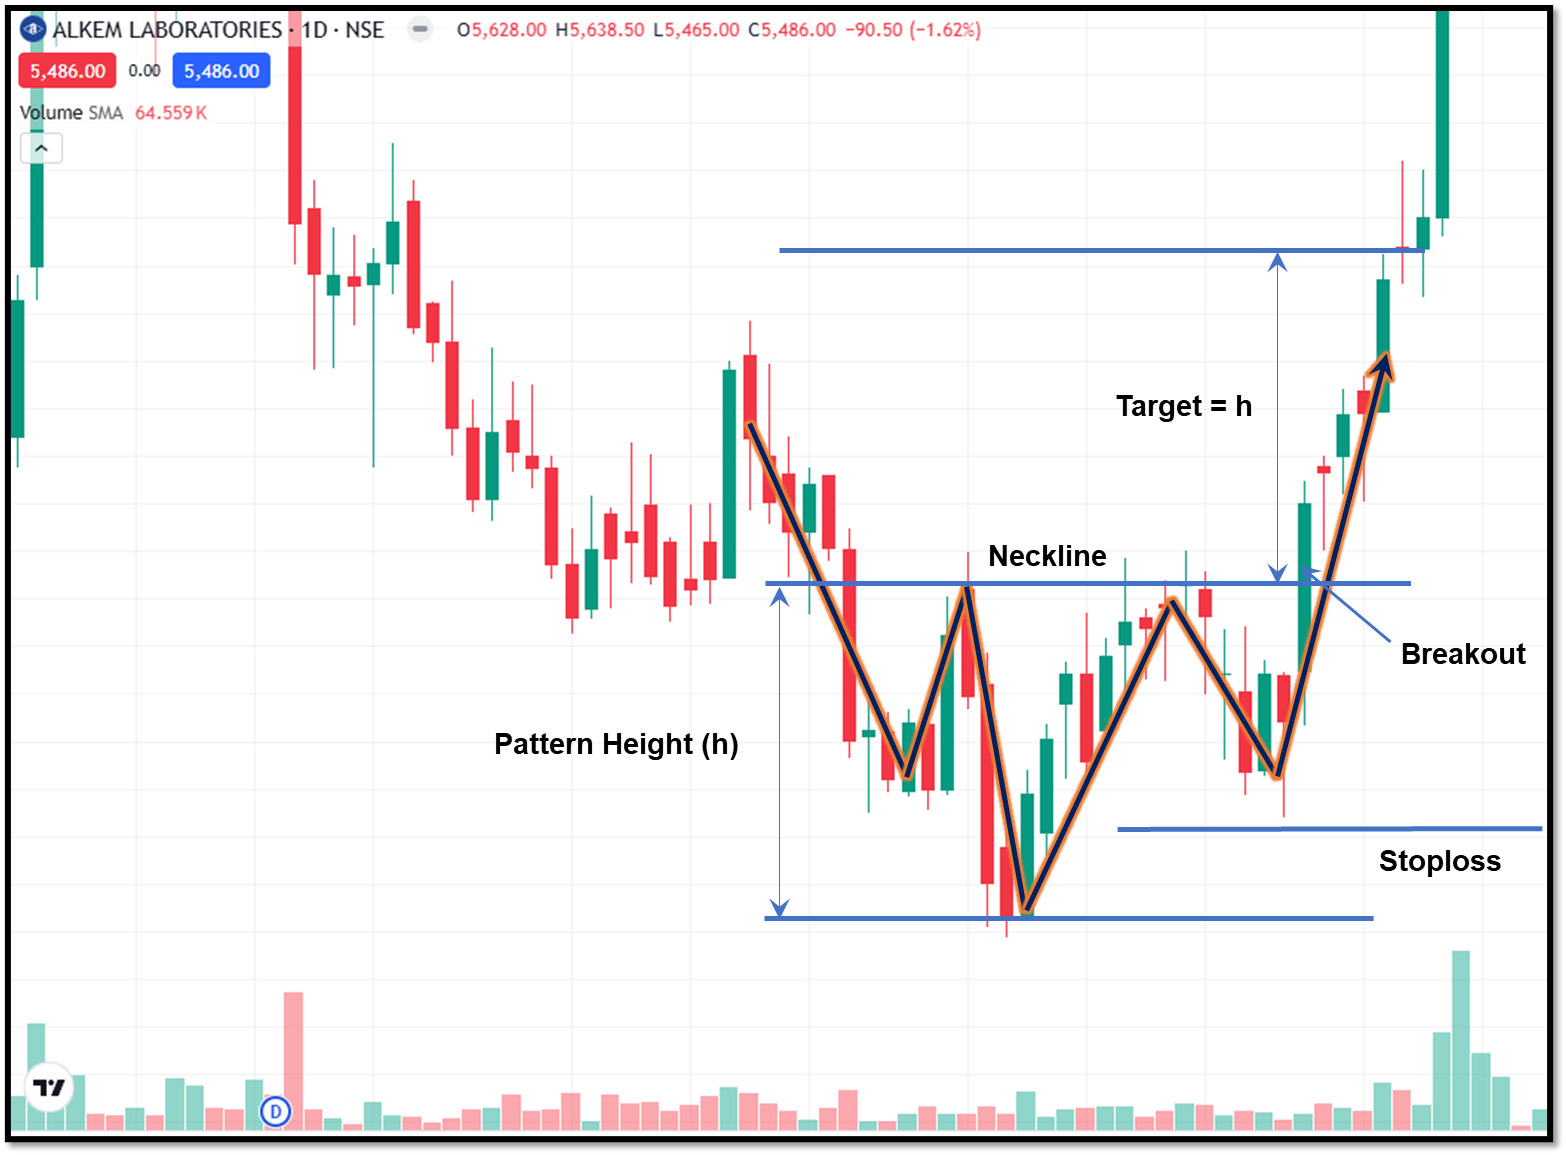
Traders use a common projection method where they project the pattern’s height above the breakout. Measure the distance between the neckline breakout and the head low, project that height above the breakout. This is not a guaranteed move, but it gives a possible target.
Stop-loss placement
Risk management matters more than pattern recognition alone. Common stop-loss placements are below the right shoulder. This stop-loss placement is popular because it aligns with the recent structure.
Some traders place the stop loss below the head as it gives more room. But it increases the risk. Suitable only if position sizing is adjusted.
Common mistakes traders make
The following are some common mistakes that traders make while trading with an inverse head and shoulder pattern.
- To increase profits, many traders anticipate the move and enter the trade before the breakout. This increases the unnecessary risk.
- Traders usually ignore the broader trend. A weak reversal inside a strong, larger downtrend can fail quickly. Always check higher timeframes.
- Ignoring volume confirmation can lead to a quick reversal after the breakout.
- Position sizing is important. Risking too much on a single trade can cost you more.
Advantages of the inverse head and shoulders pattern
The inverse head and shoulder pattern offers the following advantages:
- Once you get the structure, it’s pretty easy to see the pattern. It is beginner-friendly because the left shoulder, head, right shoulder and neckline form an easy-to-recognise pattern.
- The pattern helps traders spot a possible shift from a bearish trend to a bullish one before a larger upward move develops.
- The pattern has almost well-defined entry, exit and stoploss points. Also, you can use the common height projection method for target selection.
- The pattern has proved itself in many markets like Forex, commodities, indices, stocks and cryptos.
Limitations of the inverse head and shoulder pattern
Along with the above advantages, the pattern has some limitations as well:
- Sometimes the pattern generates false breakouts, which trigger the entries and then quickly reverse.
- Some breakouts may lack participation. This creates a smaller move than expected.
- News or events can disrupt the setup quickly.
- The pattern takes multiple sessions to complete. Traders need to be patient for the breakout.
Conclusion
The inverse head and shoulder pattern is a bullish reversal pattern that appears after a downtrend. It represents the shift in market psychology. The pattern is easy to identify and provides plenty of time to plan the trade before the breakout happens.
Although the pattern should not be used alone, tools like RSI divergence, volume and key levels can be combined to increase its effectiveness.
FAQs
Is inverse head and shoulders bullish?
Yes. It is generally considered a bullish reversal pattern because it suggests a transition from seller control to buyer control after a downtrend.
What timeframe works best for this pattern?
The pattern can appear on intraday, daily, weekly, and even monthly charts. Higher timeframes give stronger signals.
Is volume necessary for confirmation?
Volume confirmation is not mandatory, but it helps improve confidence. A clean breakout with a strong price move is worth paying attention.
Can beginners trade this pattern?
Yes, but waiting for confirmed breakout entries is generally safer than aggressive anticipation trades.
What is the difference between inverse head and shoulders and double bottom?
Both are bullish reversal patterns, but their structures area different. A double bottom has two similar lows and an inverse head and shoulders has three lows with the middle one being lower than the other two (the head).







