Rectangle Pattern








Key takeaways
- The rectangle pattern is a price consolidation pattern formed between horizontal support and resistance levels.
- The pattern can act as a continuation pattern or a reversal pattern depending on the prevailing trend and breakout direction.
- The pattern reflects a temporary balance between buyers and sellers.
- Traders usually wait for a confirmed breakout before taking a position.
Financial markets rarely move in a straight line. Even during strong trends, prices usually pause before making their next significant move. These pauses can create recognisable chart formations that provide valuable information about market sentiment and potential future direction.
One of the most frequently observed consolidation formations is the rectangle pattern. It appears across stocks, indices, commodities, and cryptocurrencies.
The pattern looks simple. Price moves repeatedly between a horizontal resistance level and a horizontal support level, creating a box-like structure on the chart. However, behind this seemingly straightforward formation lies an important story about the ongoing battle between buyers and sellers.
What is a rectangle pattern?
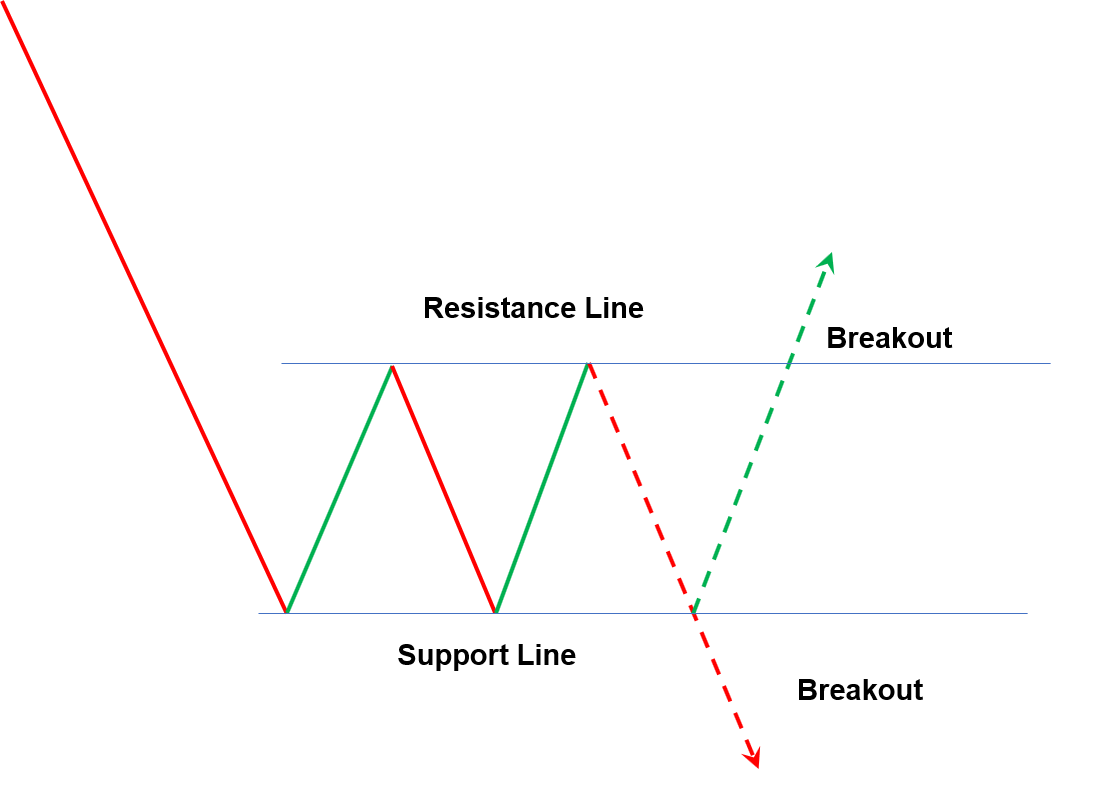
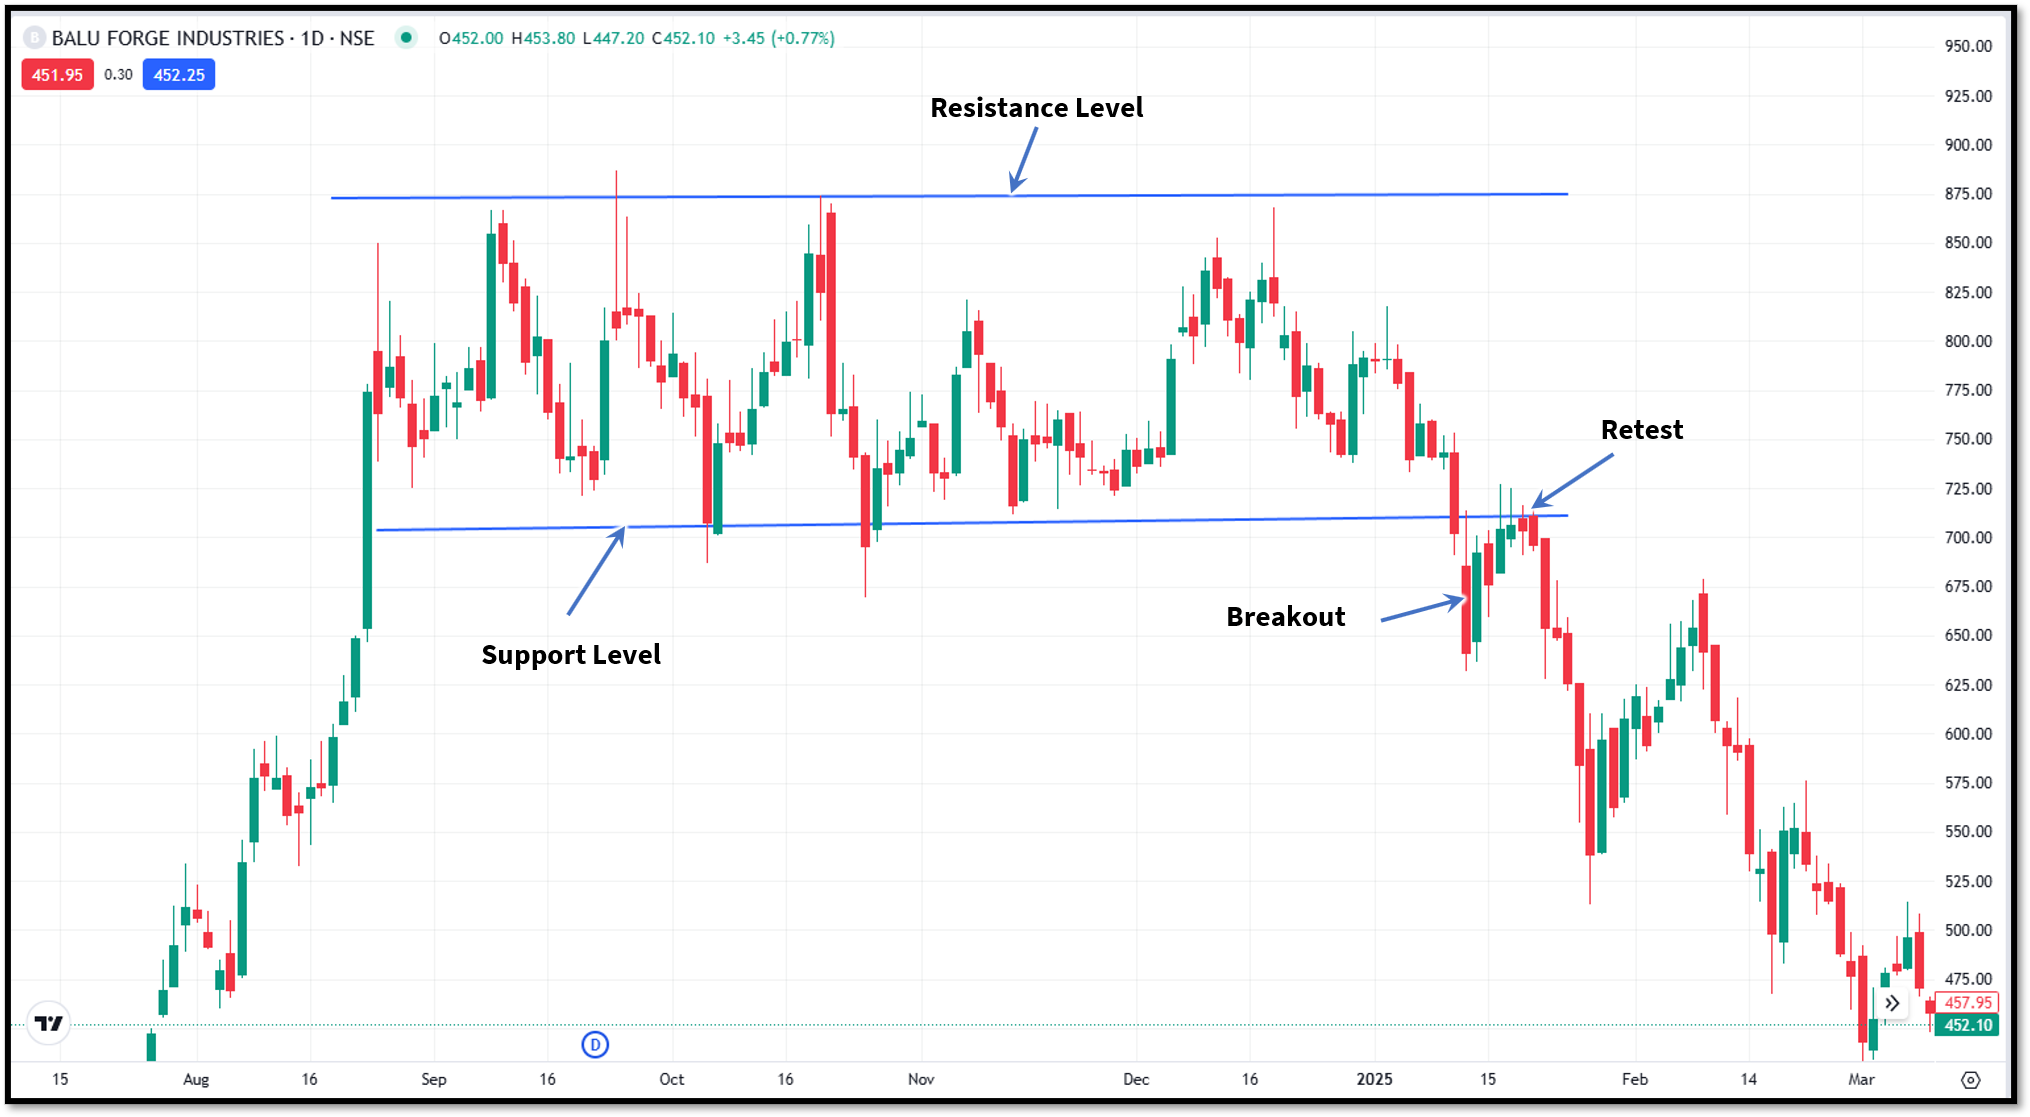
A rectangle pattern is a chart pattern that develops when the price oscillates between two parallel horizontal levels for a period of time. The upper boundary acts as resistance, where selling pressure repeatedly emerges. The lower boundary acts as support, where buying interest consistently appears.
As the price continues to bounce between these two levels, a rectangular shape forms on the chart.
The rectangle pattern represents a temporary equilibrium. It shows that neither buyers nor sellers have the strength to establish a new trend.
Eventually, this balance is broken. Price moves beyond either support or resistance, creating a breakout that determines the next significant move.
Why rectangle patterns form
To understand the rectangle pattern, you have to understand what is happening behind the scenes. Imagine a stock that has rallied sharply over several weeks. Some traders begin taking profits while others remain optimistic about further gains.
This keeps the buying and selling pressures relatively balanced. Whenever the stock approaches resistance, sellers become active and push prices lower. When the stock nears support, buyers step in and absorb selling pressure.
The pattern takes several sessions to complete. It may take multiple days, weeks, or even months to form. The rectangle pattern shows that the buyers and sellers are waiting for new information or a catalyst that could be helpful for defining the next price direction.
Once one side gains control, the market typically exits the range and starts a directional move.
Types of rectangle patterns
Although the structure remains the same, rectangle patterns can appear in different market situations.
Bullish rectangle
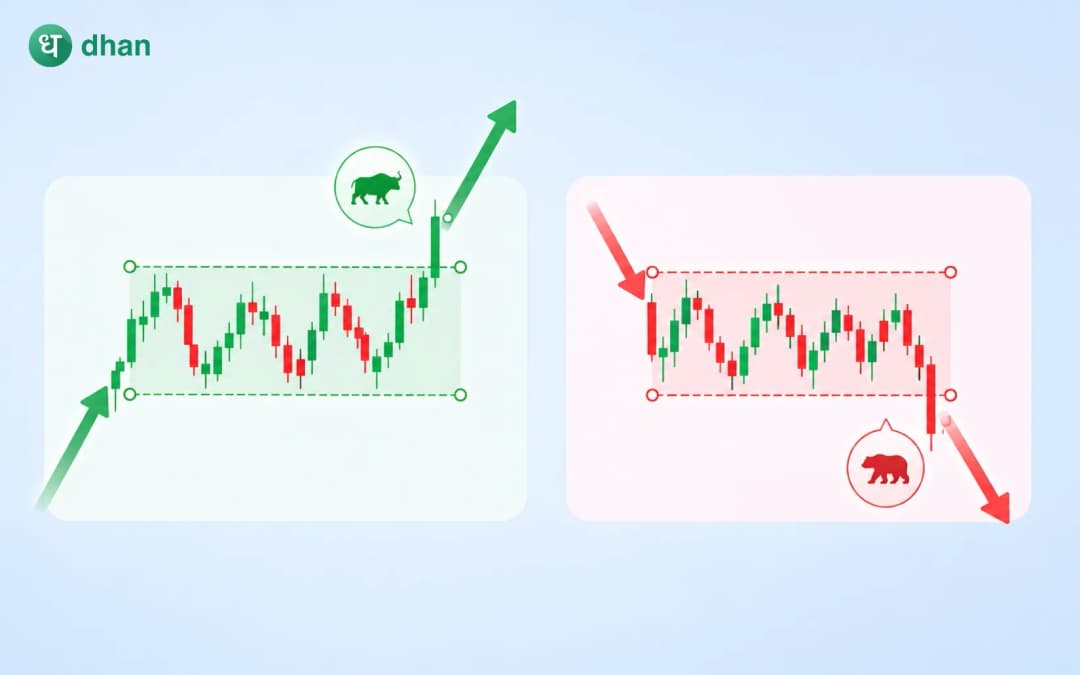
A bullish rectangle develops after an existing uptrend. After a strong uptrend, the market enters a consolidation phase and begins trading sideways. If buyers eventually push the price above resistance, the pattern is considered a bullish continuation pattern. In this situation, the rectangle serves as a temporary pause before the uptrend resumes.
Bearish rectangle
A bearish rectangle forms after a downtrend. Price consolidates within a horizontal range before sellers regain control and push the market below support.
The downside breakout signals the potential continuation of the existing bearish trend.
Reversal rectangle
Rectangles are typically continuation patterns, but they can also sometimes indicate reversals. This is why traders usually focus on the breakout direction, rather than presuming the outcome.
Characteristics of a valid rectangle pattern
Every sideways movement does not qualify for a rectangle pattern. To be a rectangle pattern, it must show certain characteristics.
Clear support and resistance levels
The pattern should clearly show the boundaries. Multiple price reactions at both support and resistance levels increase the reliability of the pattern.
Multiple touches
Price should test both support and resistance several times. Repeated touches indicate that market participants recognise and react to those levels.
Horizontal structure
The rectangle patterns have relatively flat upper and lower boundaries. The more horizontal these levels appear, the more recognisable the pattern becomes.
Temporary consolidation
The pattern should represent a pause within the market rather than random price fluctuations. A meaningful consolidation typically develops after a noticeable trend or directional move.
Psychology behind the rectangle pattern
Every chart pattern reflects market psychology, and the rectangle pattern is no exception. During the formation stage, buyers and sellers reach a temporary balance.
Buyers view support as an attractive entry point and step in whenever prices decline. Sellers view resistance as an opportunity to take profits or initiate short positions.
Due to this, the price trades within the range. With each swing inside the rectangle, pressure gradually builds. At the end, one side becomes stronger than the other. If buyers gain the upper hand, resistance breaks, and the market moves higher. If sellers gain control, support gives way and prices decline.
The breakout itself represents the moment when the balance shifts decisively.
Trading the rectangle pattern
There are several ways traders approach rectangle patterns.
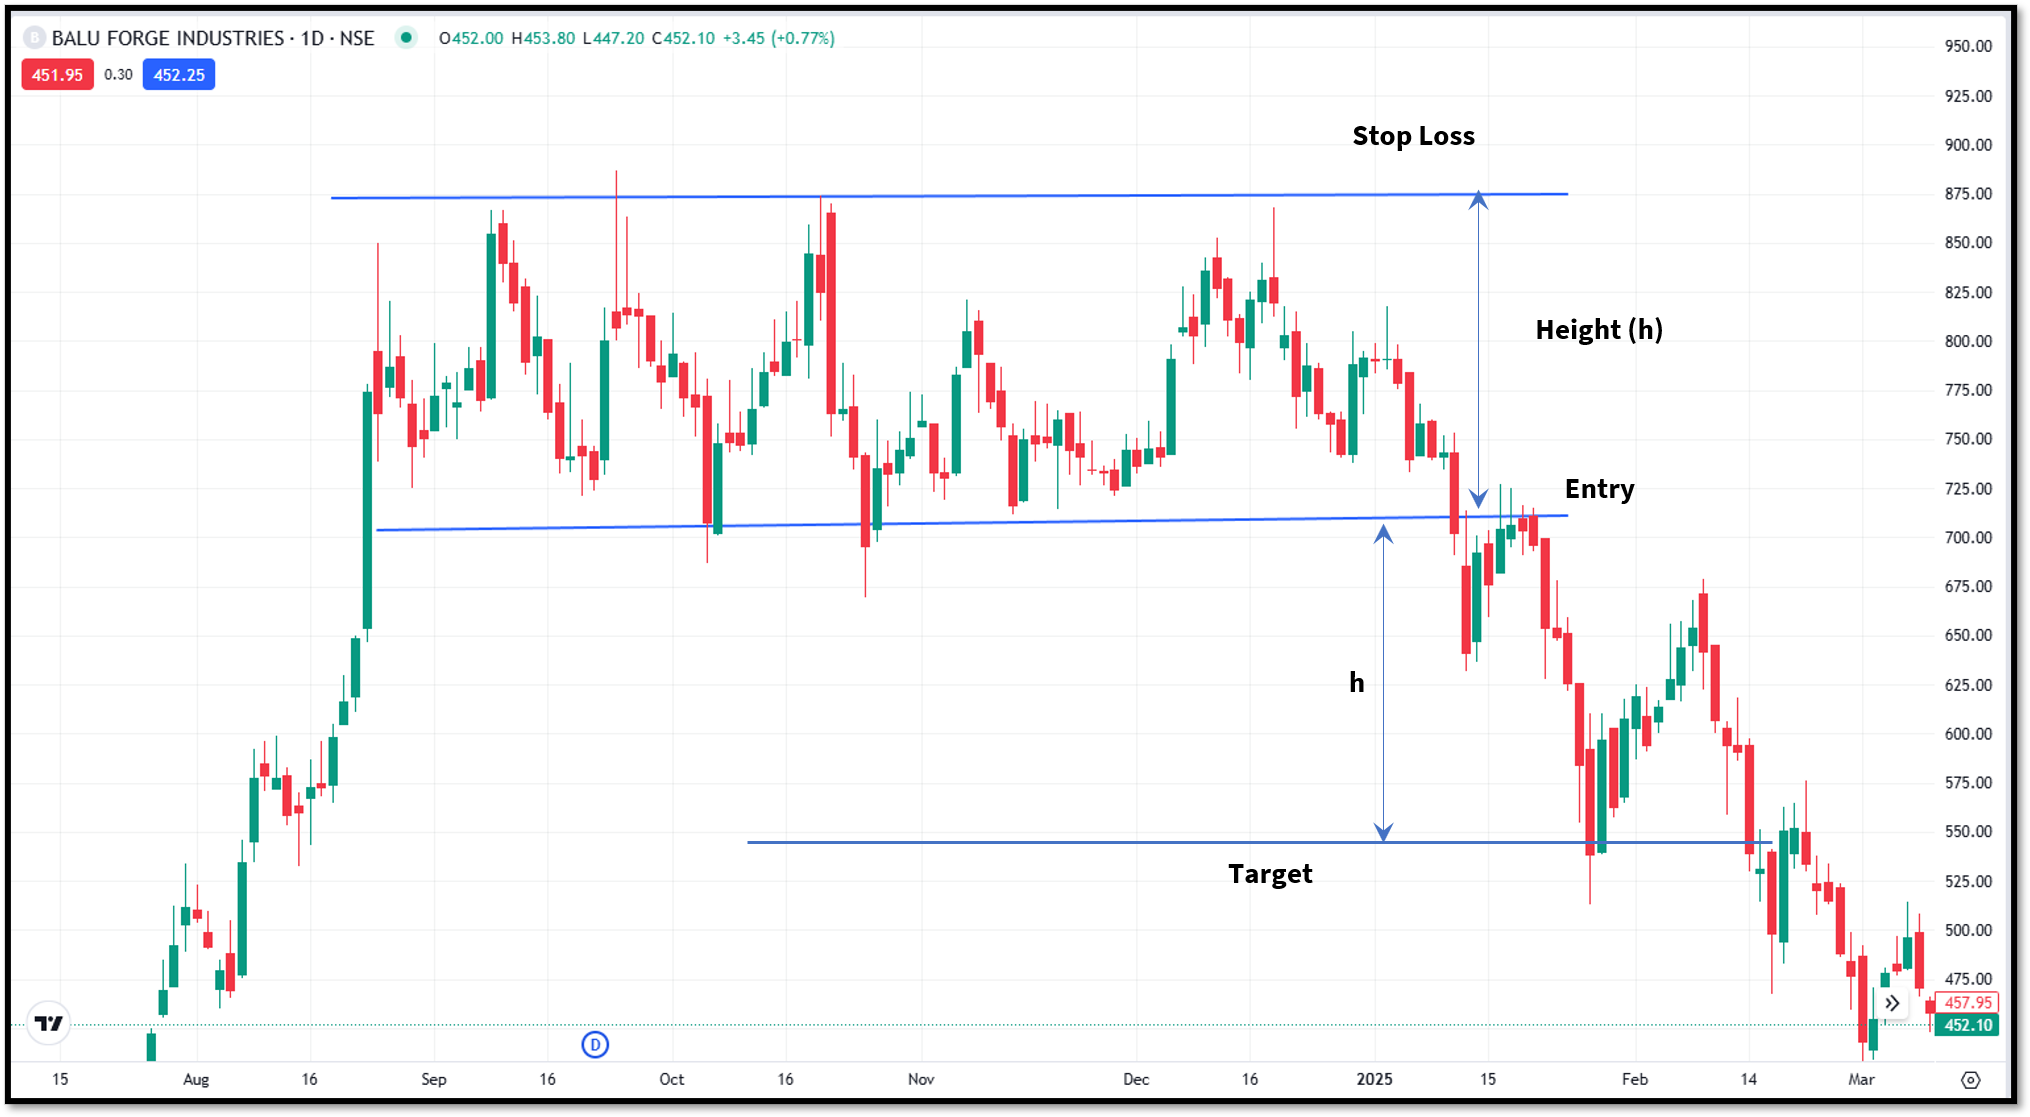
Entry
Traders usually enter the trade with the following strategies:
- Breakout Trading - Traders wait for the price to break above resistance or below support before entering a position. The breakout direction determines whether the trade is bullish or bearish.
- Retest trading - Instead of entering immediately after the breakout, they wait for the price to retest the broken level. If the former resistance becomes support, or the former support becomes resistance, the breakout may gain credibility.
- Range trading - Some traders choose to trade within the rectangle itself. They buy near support and sell near resistance while the range remains intact. In this approach, profits are generally smaller and sudden breakouts can create risk.
Target
One popular technique involves measuring the height of the rectangle. The vertical distance between support and resistance is calculated and then projected from the breakout point.
Stop Loss
You can place the stoploss above or below the resistance or support level, depending upon the breakout direction. If the price breaks out above the resistance level, place the stop loss below the support level. If the price breaks below the support level, place the stop loss above the resistance level.
Advantages of the rectangle pattern
The advantages of the rectangle patterns are as follows:
- The pattern provides clearly defined support and resistance levels. This allows traders to monitor exactly where buyers and sellers are defending prices, making trade planning more structured than many other chart patterns.
- Rectangle patterns help traders identify periods of accumulation or distribution before a significant move.
- Unlike some continuation patterns that develop quickly, rectangle formations give traders time to observe market behaviour. Multiple tests of support and resistance allow traders to evaluate the strength of both buyers and sellers before a breakout occurs.
- Since the height of the rectangle can be projected from the breakout point, traders have a practical framework for estimating potential upside or downside movement.
- Rectangle patterns can support multiple trading approaches. Breakout traders can focus on the eventual directional move, while experienced range traders may find opportunities by trading repeated reversals within the consolidation zone.
Disadvantages of the rectangle pattern
The rectangle pattern has several benefits, but it also has some limitations as follows:
- The breakout occurs after an extended period of consolidation, which can test a trader's patience. Many participants enter prematurely before confirmation and get caught in continued sideways price action.
- False breakouts are a common challenge with rectangle patterns. Price may briefly move beyond support or resistance, attracting traders into positions.
- The pattern does not provide a directional clue while it is forming. Until support or resistance is decisively broken, traders must remain open to both bullish and bearish outcomes.
- In highly volatile markets, support and resistance levels may become less precise. Spikes beyond the boundaries can make it difficult to determine whether a genuine breakout has occurred.
To wrap up
The rectangle pattern is a neutral pattern that can form after a strong uptrend or downtrend. It represents a balance of power between the buyers and sellers. The breakout is usually unpredictable. Traders usually enter the position after a breakout.
The pattern gives defined entry, exit and stoploss placement, which makes it easy for beginners. But you should not trade the pattern alone; confirmation from other indicators increases its effectiveness.
FAQs
How many touches are needed to form a rectangle pattern?
Traders want at least two touch points on both resistance and support. The more touch points there are, the stronger the pattern and the more reliable it is.
Can rectangle patterns appear in intraday trading?
Yes. Rectangle patterns can form on intraday, daily, weekly and monthly charts. But, more reliable signals usually arise from higher timeframes.
What is the difference between a rectangle and a channel?
A rectangle has resistance and support levels horizontally. A channel typically has an up-sloping or down-sloping nature.
Should beginners trade the breakout or the range?
The pattern is easy to identify and has defined entry, exit and stoploss positions. This makes the pattern beginner-friendly. But beginners should always use other confirmation tools before entering the position.
Is the rectangle pattern bullish or bearish?
The rectangle pattern is usually considered a neutral pattern. It can be bullish or bearish depending on the breakout direction.