



Rounding Bottom Pattern








Key takeaways
- The rounding bottom pattern is often a sign of a possible shift to bullish momentum.
- The rounded U-shape captures the slow build-up of market sentiment.
- Breakouts of the neckline are often used by traders to identify potential entry opportunities. The breakout can be significantly improved by the increased trading volume.
A bull market often starts with a change in market sentiment. After a long decline, there comes a point where the selling pressure starts to ease, the buyers come back slowly, and a stock starts to build a base for its next move.
Catching this transition can help traders identify potential opportunities before the new trend forms. The Rounding Bottom pattern is an example of a chart pattern that captures this change.
The pattern’s smooth, bowl-like shape symbolises a slow transition from bearish sentiment to bullish strength. While sharp reversals do develop, it is over time as the buyers slowly take over and confidence comes back to the market.
Knowing this pattern allows traders to predict trend reversals and potential entry points.
What is a Rounding Bottom Pattern?
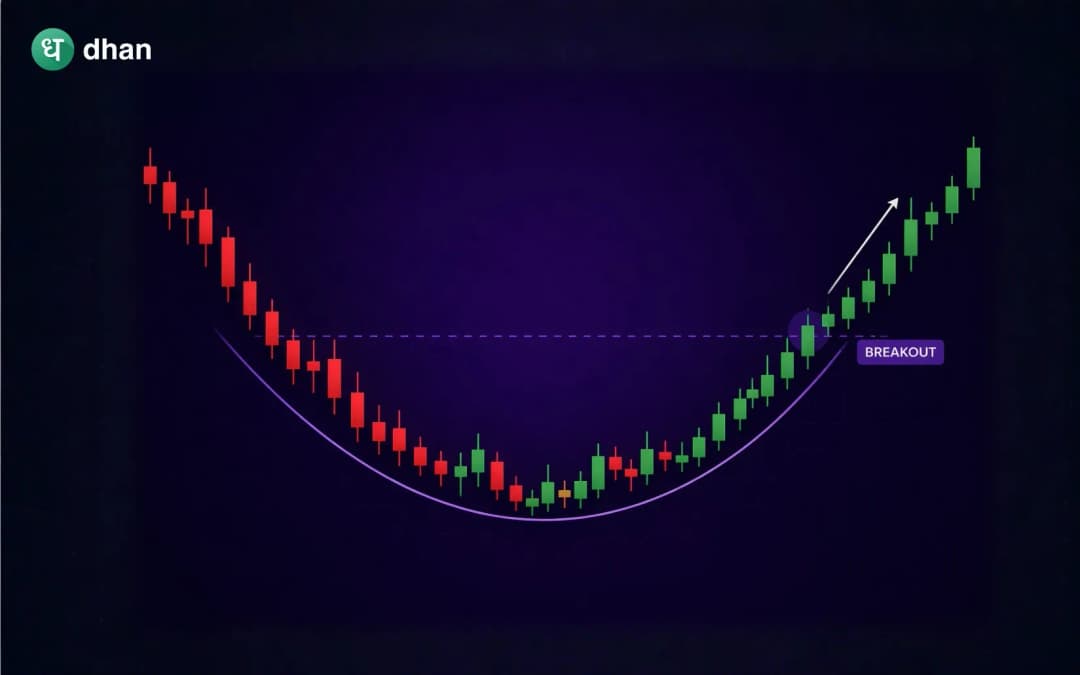
A Rounding Bottom Pattern is a bullish reversal pattern that occurs after a downtrend. It happens when the price of a stock drops slowly, levels off and then starts to increase slowly.
Instead of a sharp “V” reversal, the pattern forms a rounded “U” shape on the price chart.
Such a slow transition indicates that selling pressure is easing and buying interest is increasing. When the price breaks above the resistance level near the pattern’s peak, it may signal the start of a new uptrend.
How does a Rounding Bottom Pattern form?
A rounding bottom usually progresses in three stages.
Downtrend Phase
The stock is already in a downtrend. The market remains under heavy selling pressure, and investors are still not optimistic. Prices continue to slip slowly.
Consolidation Phase
The decline begins to level off. The stock will trade within a rather tight range as buyers and sellers reach a temporary equilibrium. This constitutes the lower part of the pattern.
Recovery Phase
As the market sentiment begins to turn positive, the buying interest gradually increases. The stock begins to rise and creates the right side of the U-shaped pattern. The pattern is confirmed, and a fresh bullish trend may be beginning when the price breaks out above the resistance level.
What does a Rounding Bottom Pattern indicate?
A rounding bottom pattern indicates a move in the market sentiment from bearish to bullish.
The pattern suggests that:
- Sellers are losing their grip.
- Buyers are slowly coming into the market
- Demand increasing
- We may be seeing a potential trend reversal
- There is long-term accumulation taking place
But traders should always combine other indicators and risk management techniques before making trading decisions.
How to identify a Rounding Bottom Pattern?
To identify a rounding bottom pattern, do the following:
Step 1: Look for an existing downtrend
The pattern should develop after a big price drop. If there is no prior downtrend, then the pattern may not have the same bullish significance.
Step 2: Observe the rounded shape
Look for a smooth U-shaped curve, not a sharp reversal. The formation must be gradual and symmetrical in appearance.
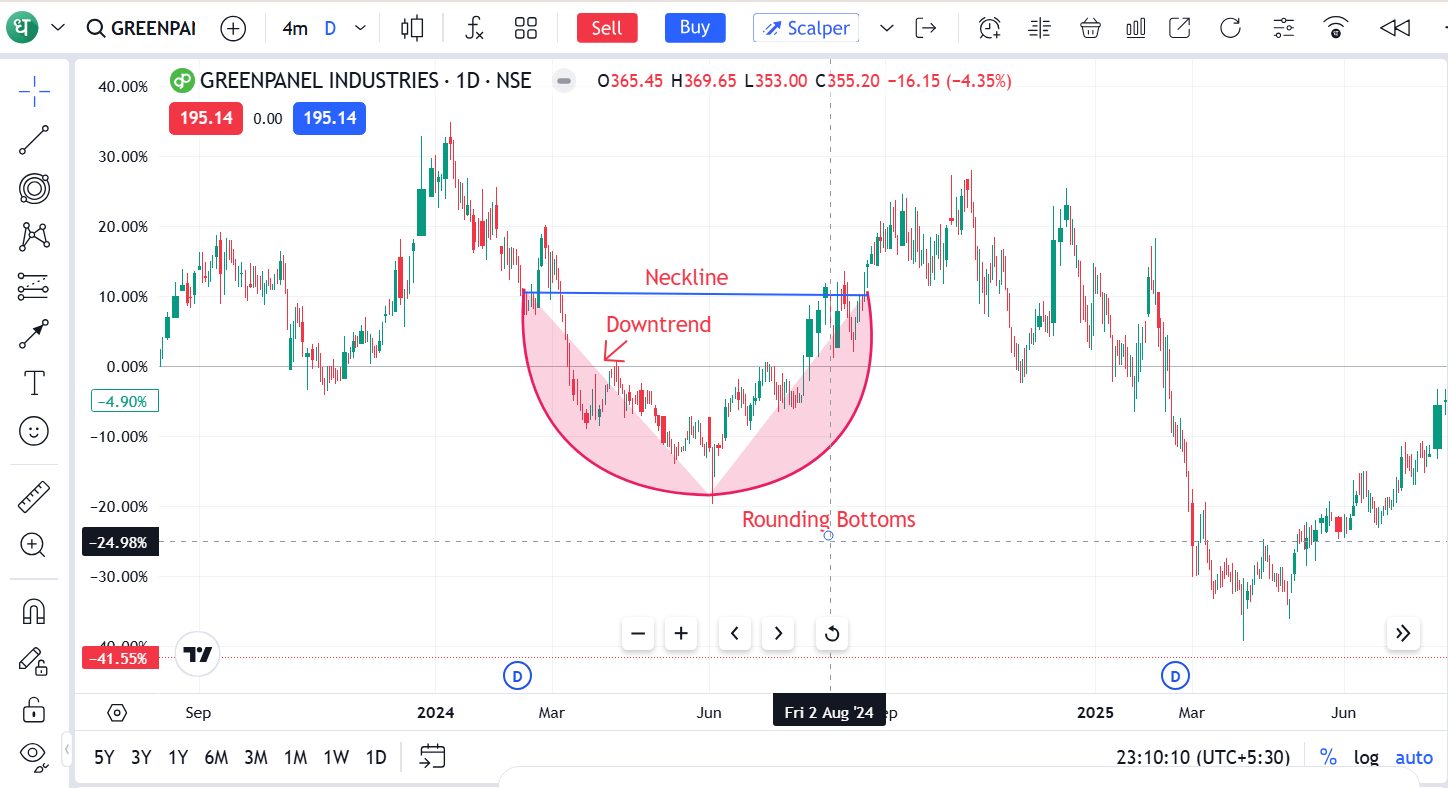
Step 3: Identify where the downtrend began
See the point where the stock began to fall before forming the rounded shape. When the stock recovers, the price will often move back towards this area, and so this is an important level to watch.
Step 4: Watch for volume confirmation
During the formation period, the volume of trading may decrease. The validity of the pattern can be increased if there is a large increase in volume during the breakout.
Step 5: Confirm the breakout
Watch the stock action near the resistance level. If the price moves above this level and manages to stay there, it could indicate that buyers are gaining strength.
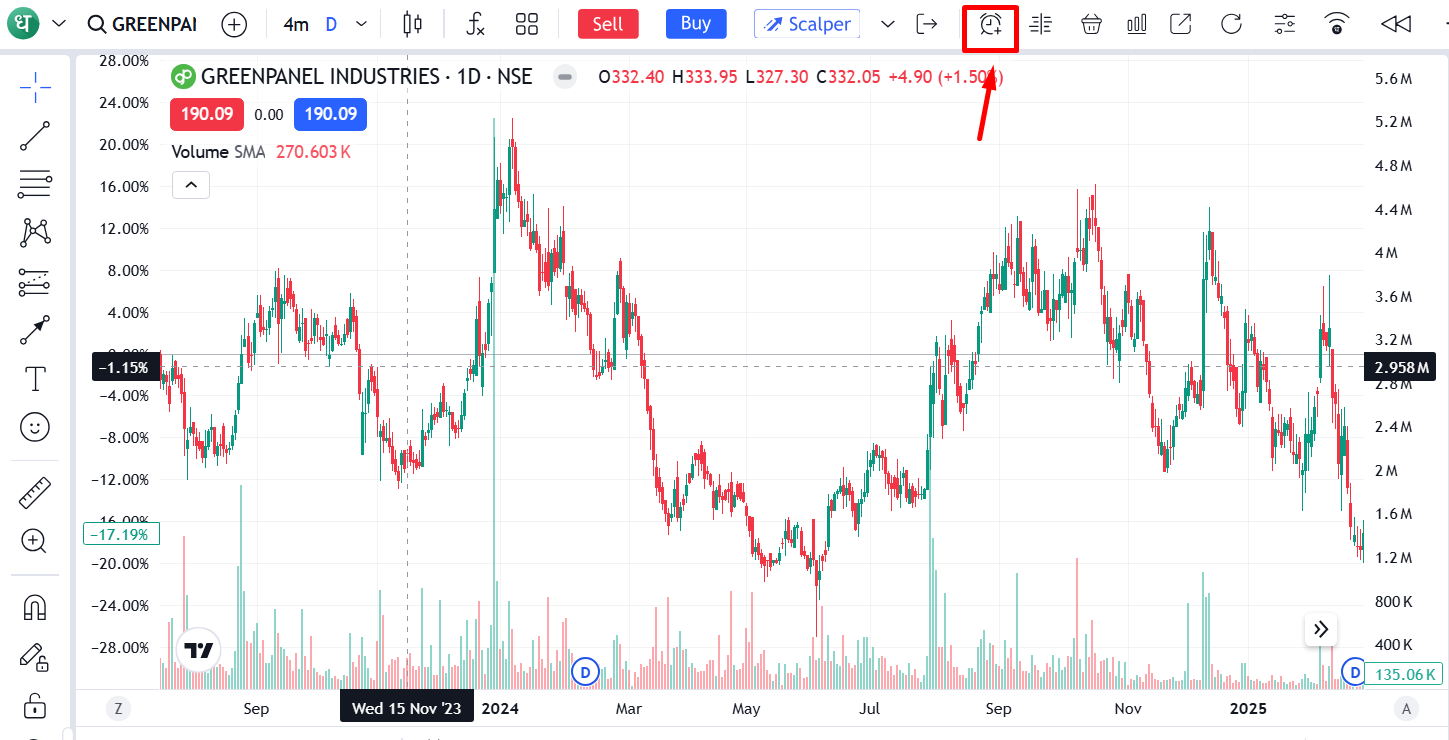
Step 6: Set alerts for price levels
Dhan has a price alert feature that you can use to track breakout levels without having to keep a hawk eye on the chart. This gives you an early warning when the stock is approaching important resistance levels.
The rounding bottom pattern is usually considered over once the price breaks above it. Many traders want to see a confirmed breakout (with higher volume) before they start looking for an entry.
How to trade with Rounding Bottom Pattern?
It’s common for traders to take a systematic approach to trading this pattern.
Entry point
The normal procedure is to buy when the stock closes above the neckline (resistance level) with volume greater than average. A higher volume can be a sign of higher buying interest and can make the breakout more reliable.
Some traders prefer to wait for the retest of the breakout level and for it to hold above the level before entering a position.
Stop-loss placement
Traders often use a stop-loss to manage risk, and place it below:
- Exit level following a successful retest
- The latest swing low
- A major support level of the pattern
Where to place the stop-loss is dependent on the trader's risk tolerance and market conditions.
Profit target
The measured move method is a popular approach. Traders measure the depth of the rounding bottom and add that to the breakout level to project a possible price target.
Example:
- Neckline (breakout level): Rs 500
- Lowest point of the pattern: Rs 400
- Pattern depth: Rs. 100
Estimated target:
500 + 100 = ₹600
This is a technique that can set a possible target, but actual price action can be different. Many traders also use trailing stop losses or watch key resistance levels to manage their positions as the trend develops.
Advantages and Limitations
The rounding bottom pattern can be useful for traders in spotting potential bullish reversals, but like any technical pattern, it has its strengths and weaknesses.
By learning these, you will be able to use the pattern more effectively in your trading strategy:
Advantages of Rounding Bottom
- Signals a potential trend reversal from a downtrend to an uptrend.
- Provides a clear breakout level for identifying possible entry points.
- Can be applied across multiple markets, including stocks, indices, and commodities.
- Works across different time frames, making it suitable for both traders and investors.
- Supports risk management by helping define stop-loss and target levels.
Limitations of Rounding Bottom
- Takes time to develop and may require weeks or months to form.
- False breakouts can occur, resulting in unsuccessful trades.
- Performance can be affected by overall market conditions and sentiment.
- Requires patience, as entering before confirmation increases risk.
- Should be combined with volume analysis and other indicators for stronger confirmation.
Tips for trading the Rounding Bottom Pattern
Before trading, consider these practical tips:
- Wait for breakout confirmation before thinking of any trading position.
- Watch the volume of the trading to confirm the strength of the breakout.
- Always protect downside risk with stop loss orders.
- Don’t ever make a decision based on just one chart pattern.
- Always check the overall market trends before taking any trade.
- Use RSI or moving averages for confirmation.
To Conclude
The rounding bottom pattern is a popular bullish reversal pattern that helps traders identify potential trend reversals after a long-term downtrend.
Its gradually developing U-shape suggests a transition from selling pressure to buying strength. The pattern can provide good trading opportunities, but it should always be used with proper technical analysis, volume confirmation and risk management.
FAQs
Is the rounding bottom pattern bullish?
Yes. It is a very common bullish reversal pattern, and it shows the possibility of a downtrend reversing into an uptrend.
How long does a rounding bottom pattern take to form?
Depending on market conditions and the stock being analysed, it may take several weeks or even months for the pattern to develop.
Is volume important in a rounding bottom pattern?
Yes. The higher volume you have during the breakout phase, the more reliable the pattern usually is.
Can beginners use the rounding bottom pattern?
Yes. It is relatively easy to spot, but traders should use additional confirmation tools before taking positions.
What is the difference between a rounding bottom and a V-shaped reversal?
A gradual rounding bottom will form a U shape, whereas a V-shaped reversal will see a quick recovery in price.







