Simple Moving Average Indicator (SMA Indicator)








Key takeaways
- The Simple Moving Average (SMA) is one of the most widely used trend-following indicators in technical analysis.
- The SMA is calculated by adding the closing prices over a defined period and dividing by the number of periods. It smooths out short-term price fluctuations.
- With SMA, you can identify trends, potential support and resistance levels, and trading signals.
Technical indicators can sometimes appear complicated, especially for traders who are just beginning their journey in the markets. However, some indicators have remained popular for decades because of their simplicity and effectiveness. The Simple Moving Average or SMA is one of them.
Traders use SMA while analysing stocks, indices, or commodities. It helps simplify price movements by filtering out short-term market noise and highlighting the broader trend.
Although the SMA is relatively simple, it remains a valuable tool for many professional traders and investors. It can help identify trend direction, confirm momentum, and provide insights into potential support and resistance levels.
This article dives into the SMA indicator and will help you understand how the SMA works, what it can do, and how traders apply it in different market conditions. SMA is one of the foundational indicators for developing other advanced indicators. Understanding the SMA will help you in the long run.
What is the SMA indicator?
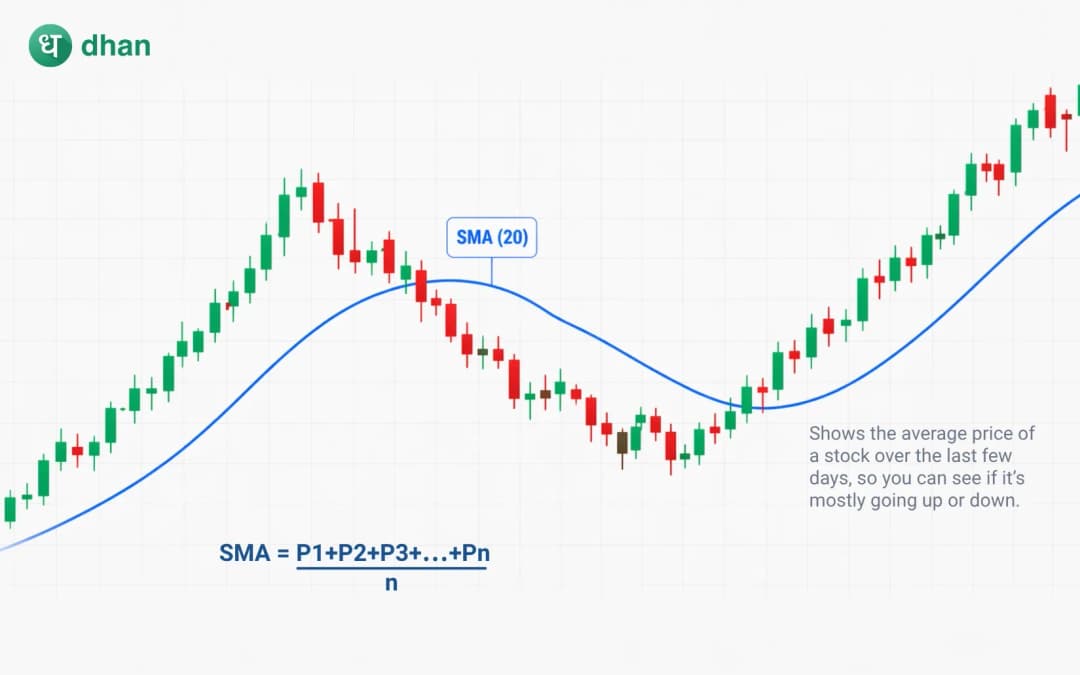
The Simple Moving Average (SMA) is a technical indicator that calculates the average price of an asset over a defined period. The SMA combines a defined number of closing prices and divides them by the chosen period.
This creates a smooth line on the chart that helps traders identify the overall market direction.
For example, a 20-day SMA represents the average closing price over the last 20 trading sessions. As each new trading day is added, the oldest data point is removed, causing the average to "move" along with price action. This continuous updating process is why it is called a moving average.
How is the SMA calculated?
The formula for SMA calculation is as follows:
SMA = P1 + P2 + P3 +........+ Pnn
Where,
- P = Closing price for each period
- n = Number of periods
For example, suppose a stock closes at ₹100, ₹102, ₹104, ₹106, ₹108, then the 5-day SMA would be calculated as follows:
SMA = 100 + 102 + 104 + 106 + 1085
SMA = 5205= 104
As new prices are added and older prices drop off, the SMA changes accordingly. But you don’t need to calculate the SMA manually. Modern trading platforms like Dhan calculate the SMA values automatically and plot them on the chart.
Why traders use the SMA indicator
The SMA remains popular because it serves multiple purposes. The following are some of the most common uses of the SMA.
Trend identification
One of the primary uses of the SMA is identifying market trends.
General interpretation of the SMA indicator is as follows:
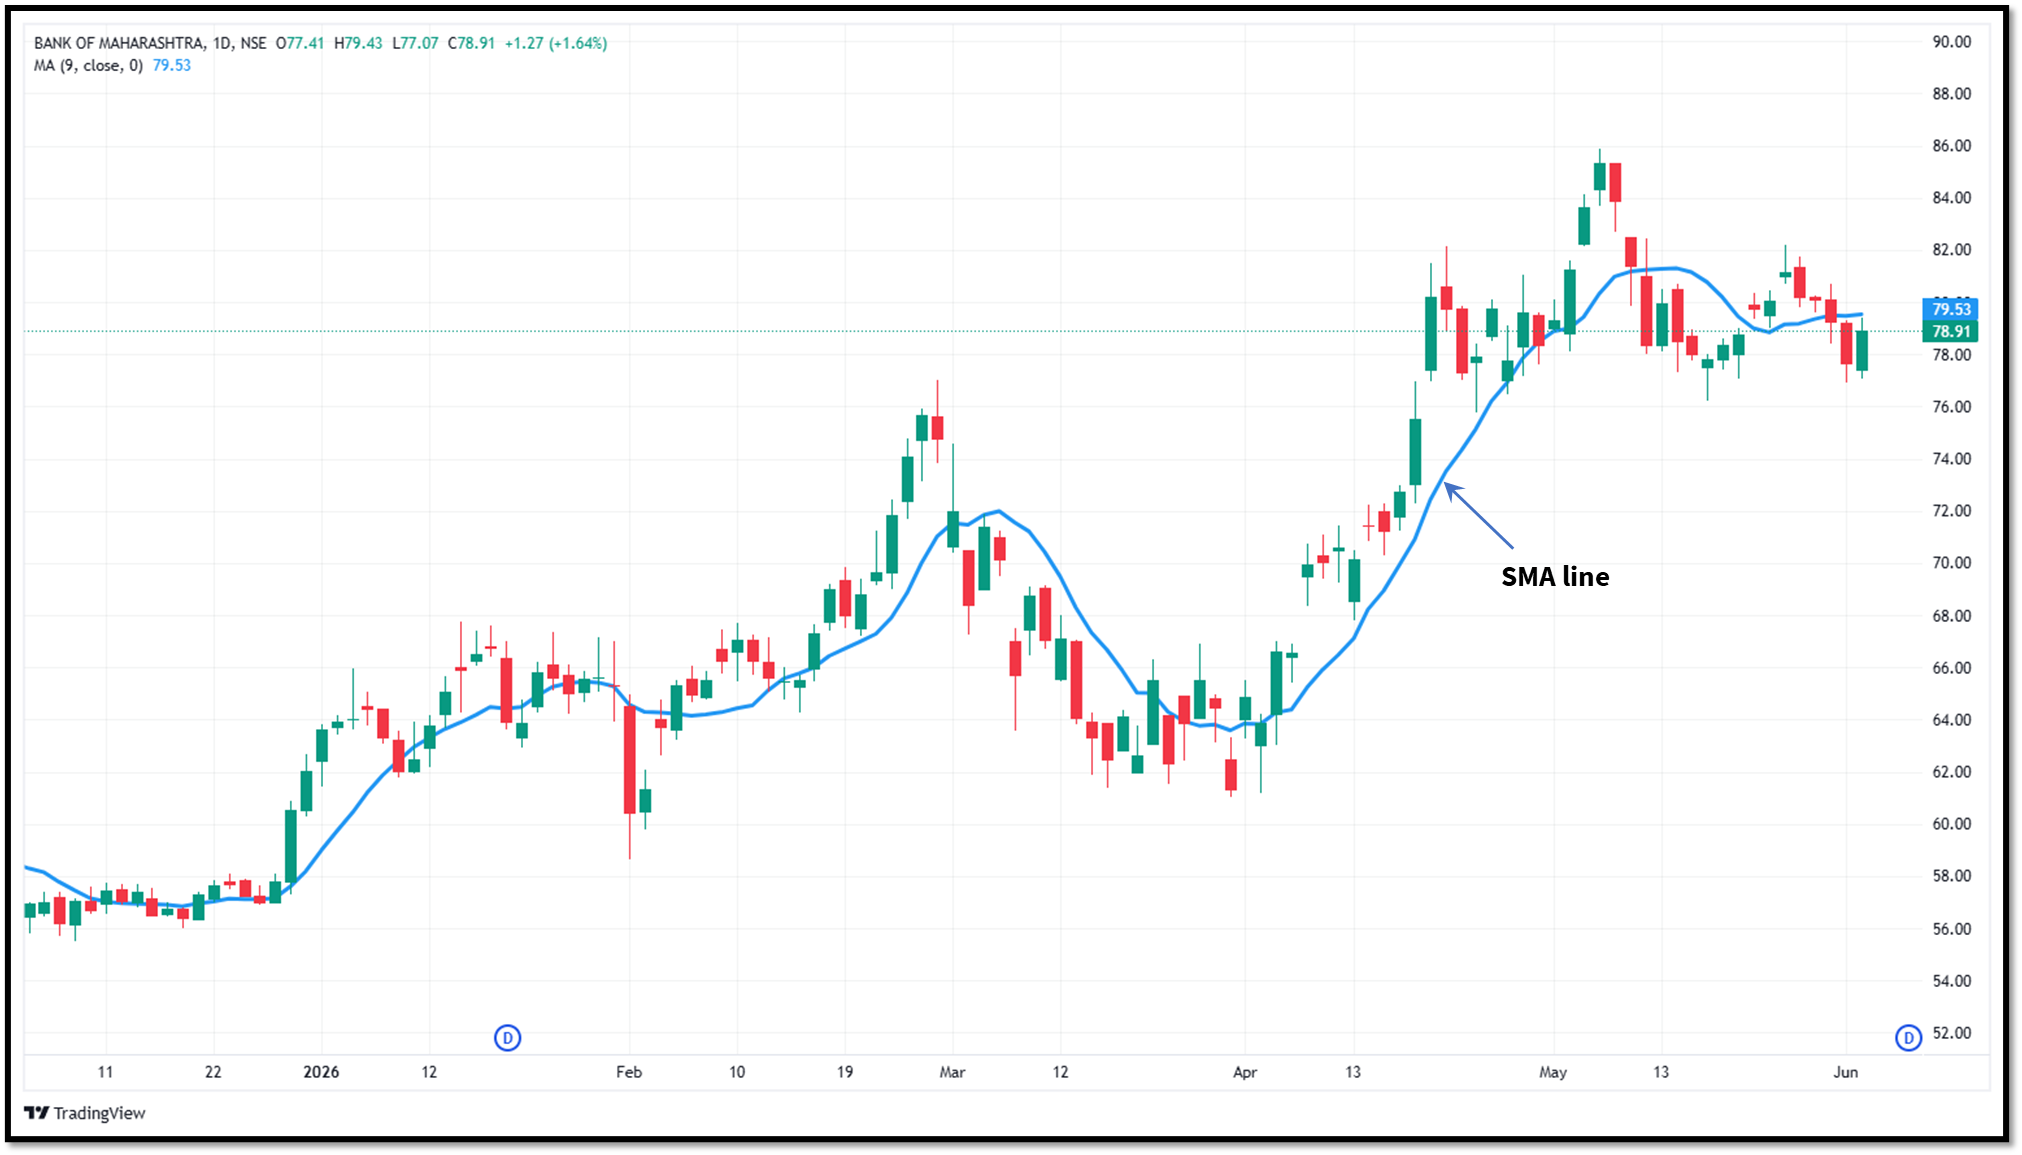
- Price above the SMA suggests an uptrend.
- Price below the SMA suggests a downtrend.
- A rising SMA indicates strengthening bullish momentum.
- A falling SMA indicates weakening price action.
Noise reduction
Charts are not easy to read because the financial markets are often subject to short-term fluctuations. The SMA helps smooth out these smaller moves and enables traders to focus on the bigger trend rather than responding to every small swing in price.
Support and resistance analysis
Many times, SMA levels act as a dynamic support and resistance level for trending stocks.
For example, during an uptrend, the price may repeatedly bounce from the 50-day SMA. This behaviour can signal that buyers continue defending the trend. Similarly, in a downtrend, the SMA may act as dynamic resistance.
Common SMA periods used by traders
Different SMA periods serve different purposes. The following SMA periods are used by professional traders while trading.
20-day SMA
The 20-day SMA is used for short-term trend analysis. Swing traders frequently monitor this average to identify near-term market direction. It reacts relatively quickly to price changes compared to longer-term averages.
50-day SMA
The 50-day SMA is one of the most popular moving averages. It strikes a balance between responsiveness and dependability. It is considered by many traders to find medium-term trends.
100-day SMA
The SMA of 100 days provides a bigger picture used by positional traders. It assists in detecting mid-term movements while filtering out briefer price fluctuations.
200-day SMA
The 200-day SMA is a key long-term trend indicator for investors and institutions. They keep close watch on it. When price trades above the 200-day SMA, the asset is generally considered to be in a long-term uptrend.
How traders interpret SMA signals
The following are some common interpretations drawn from the SMA.
Price crossing above the SMA
When the price crosses above an SMA, it can indicate the stock is gaining bullish momentum. Some traders see this as a potential buy signal when validated by volume and other indicators.
Price crossing below the SMA
When the price falls below an SMA, it may suggest increasing bearish pressure. This is a warning that the trend is weakening.
SMA slope
The direction of SMA also provides some valuable information regarding the trend. A rising SMA generally shows an upward momentum, while a falling SMA indicates declining market strength.
What is SMA crossover strategy
SMA crossover strategies are the most popular strategies among traders and investors. In this strategy, traders look for the crossover between a long-period SMA and a short-period SMA.
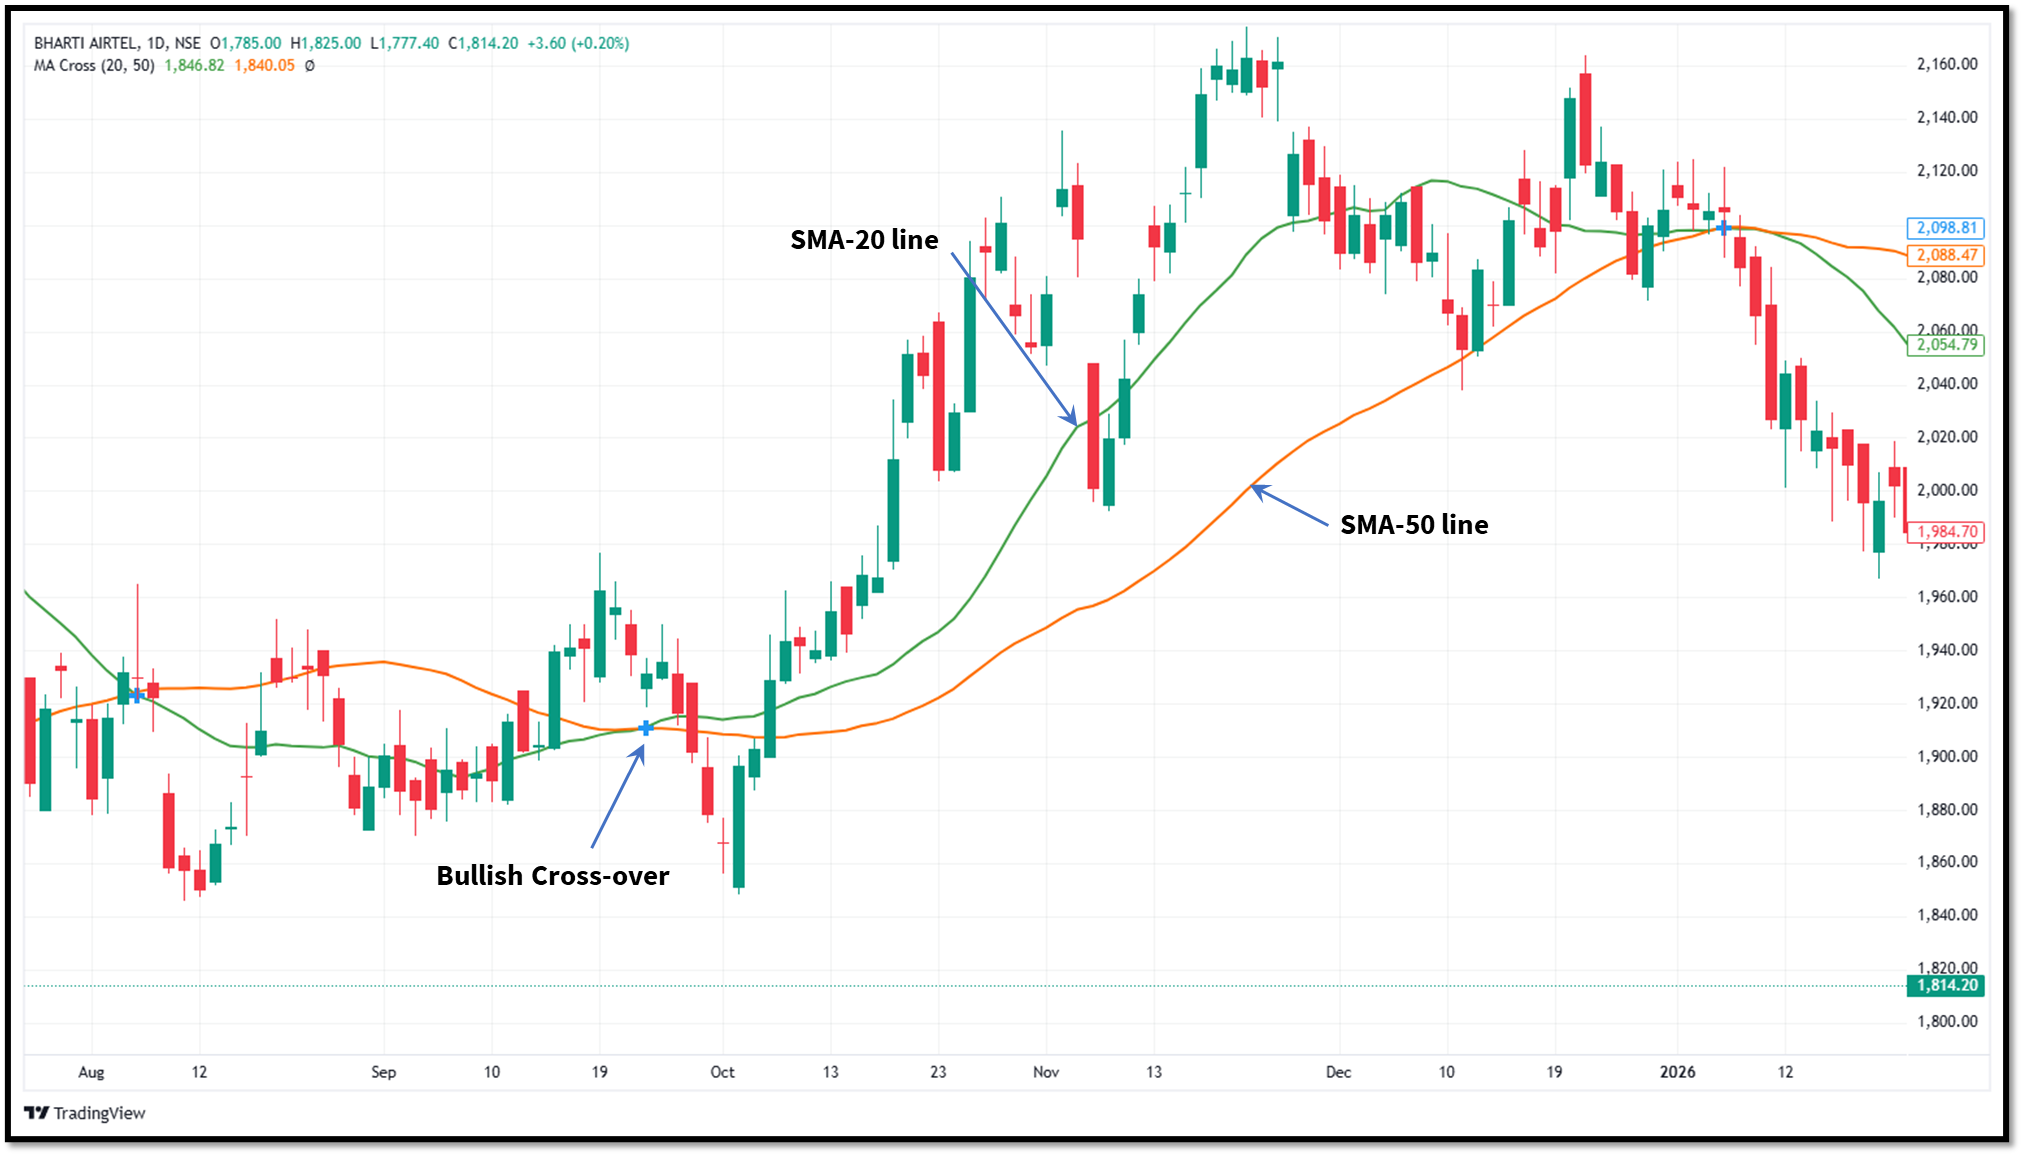
Bullish crossover
A bullish crossover occurs when a shorter-period SMA moves above a longer-period SMA. For example, a 20-day SMA crossing above a 50-day SMA suggest that the upward momentum is increasing.
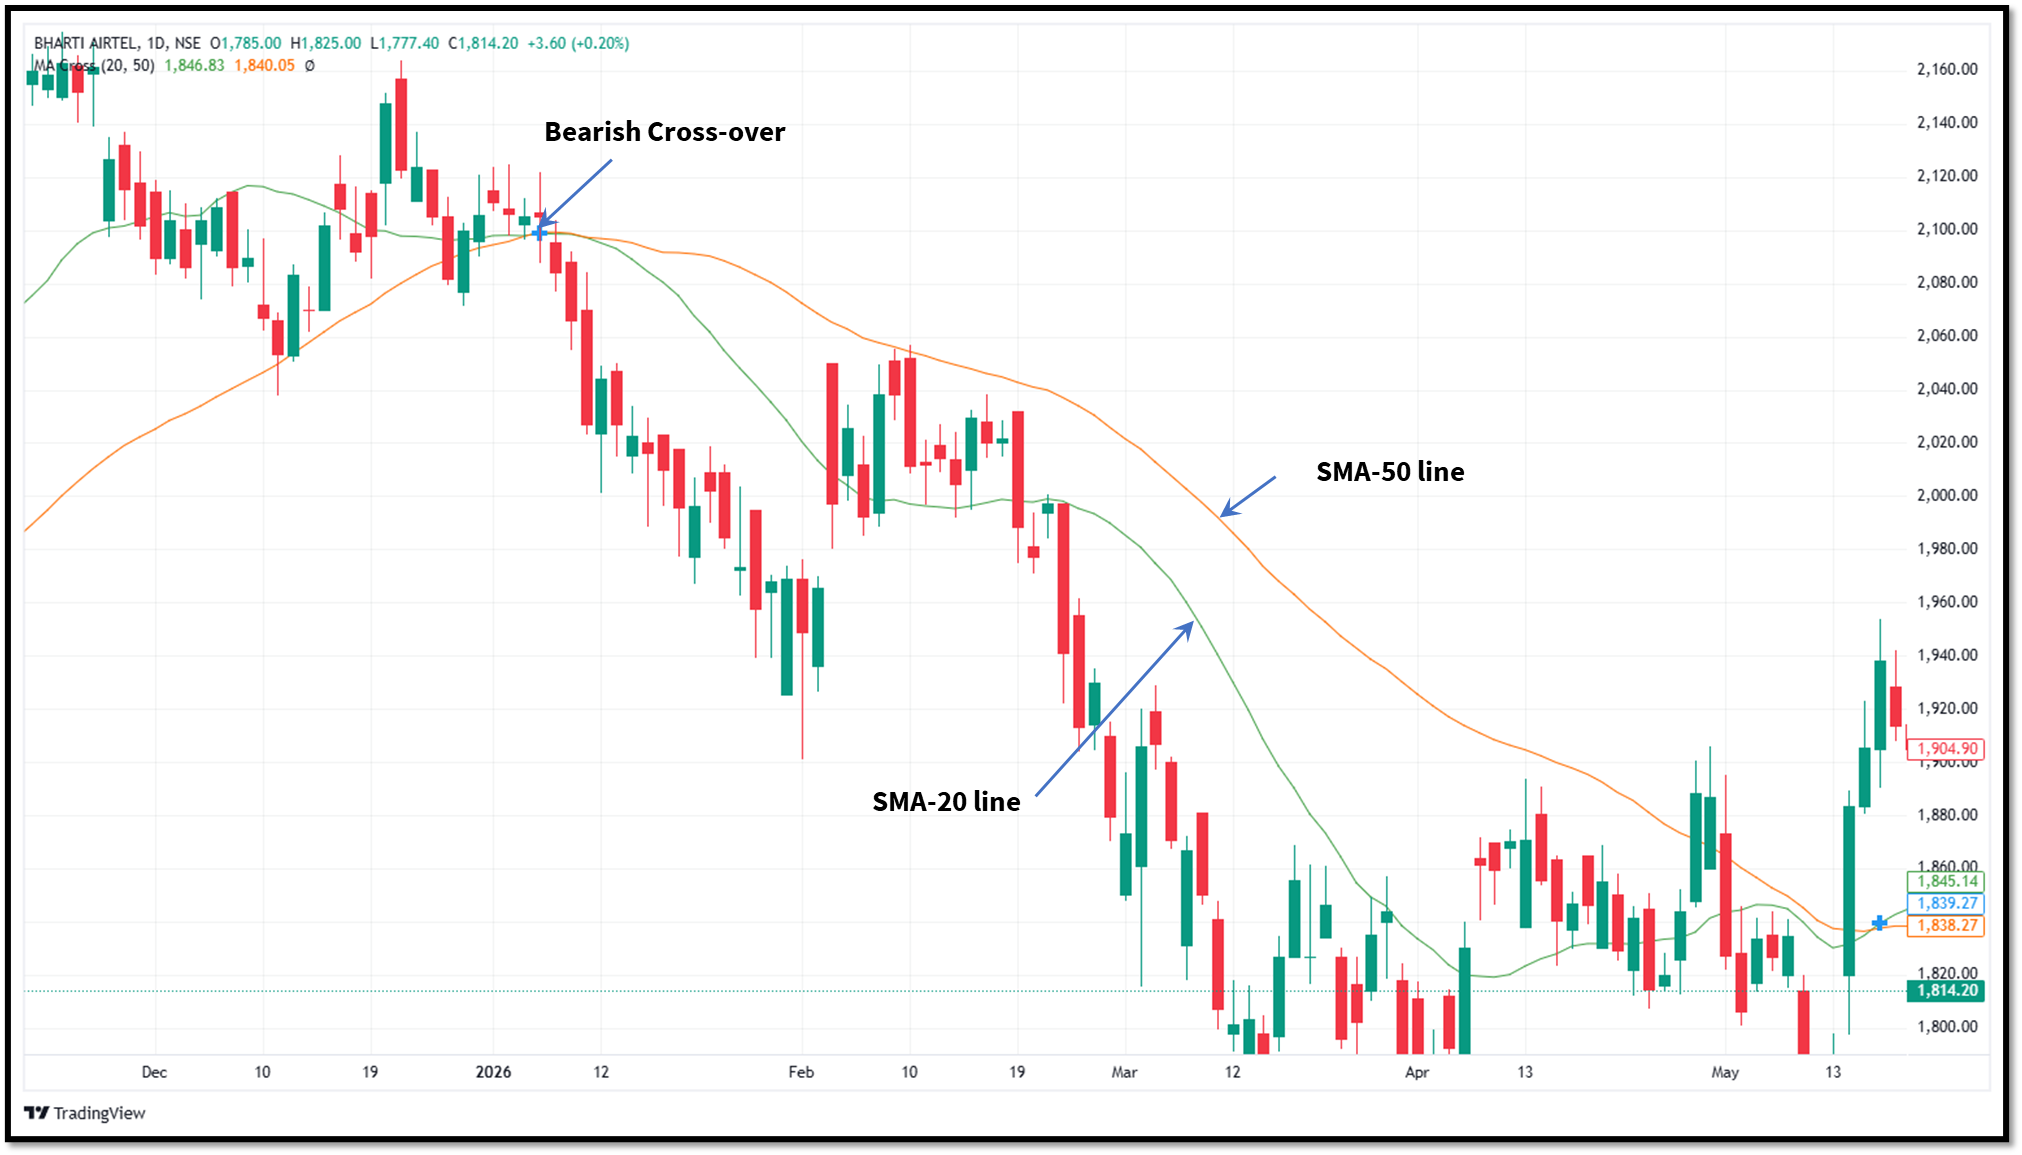
Bearish crossover
A bearish crossover occurs when a shorter-period SMA falls below a longer-period SMA. For example, if the 20-day SMA crosses below the 50-day SMA, then it indicates bearish momentum.
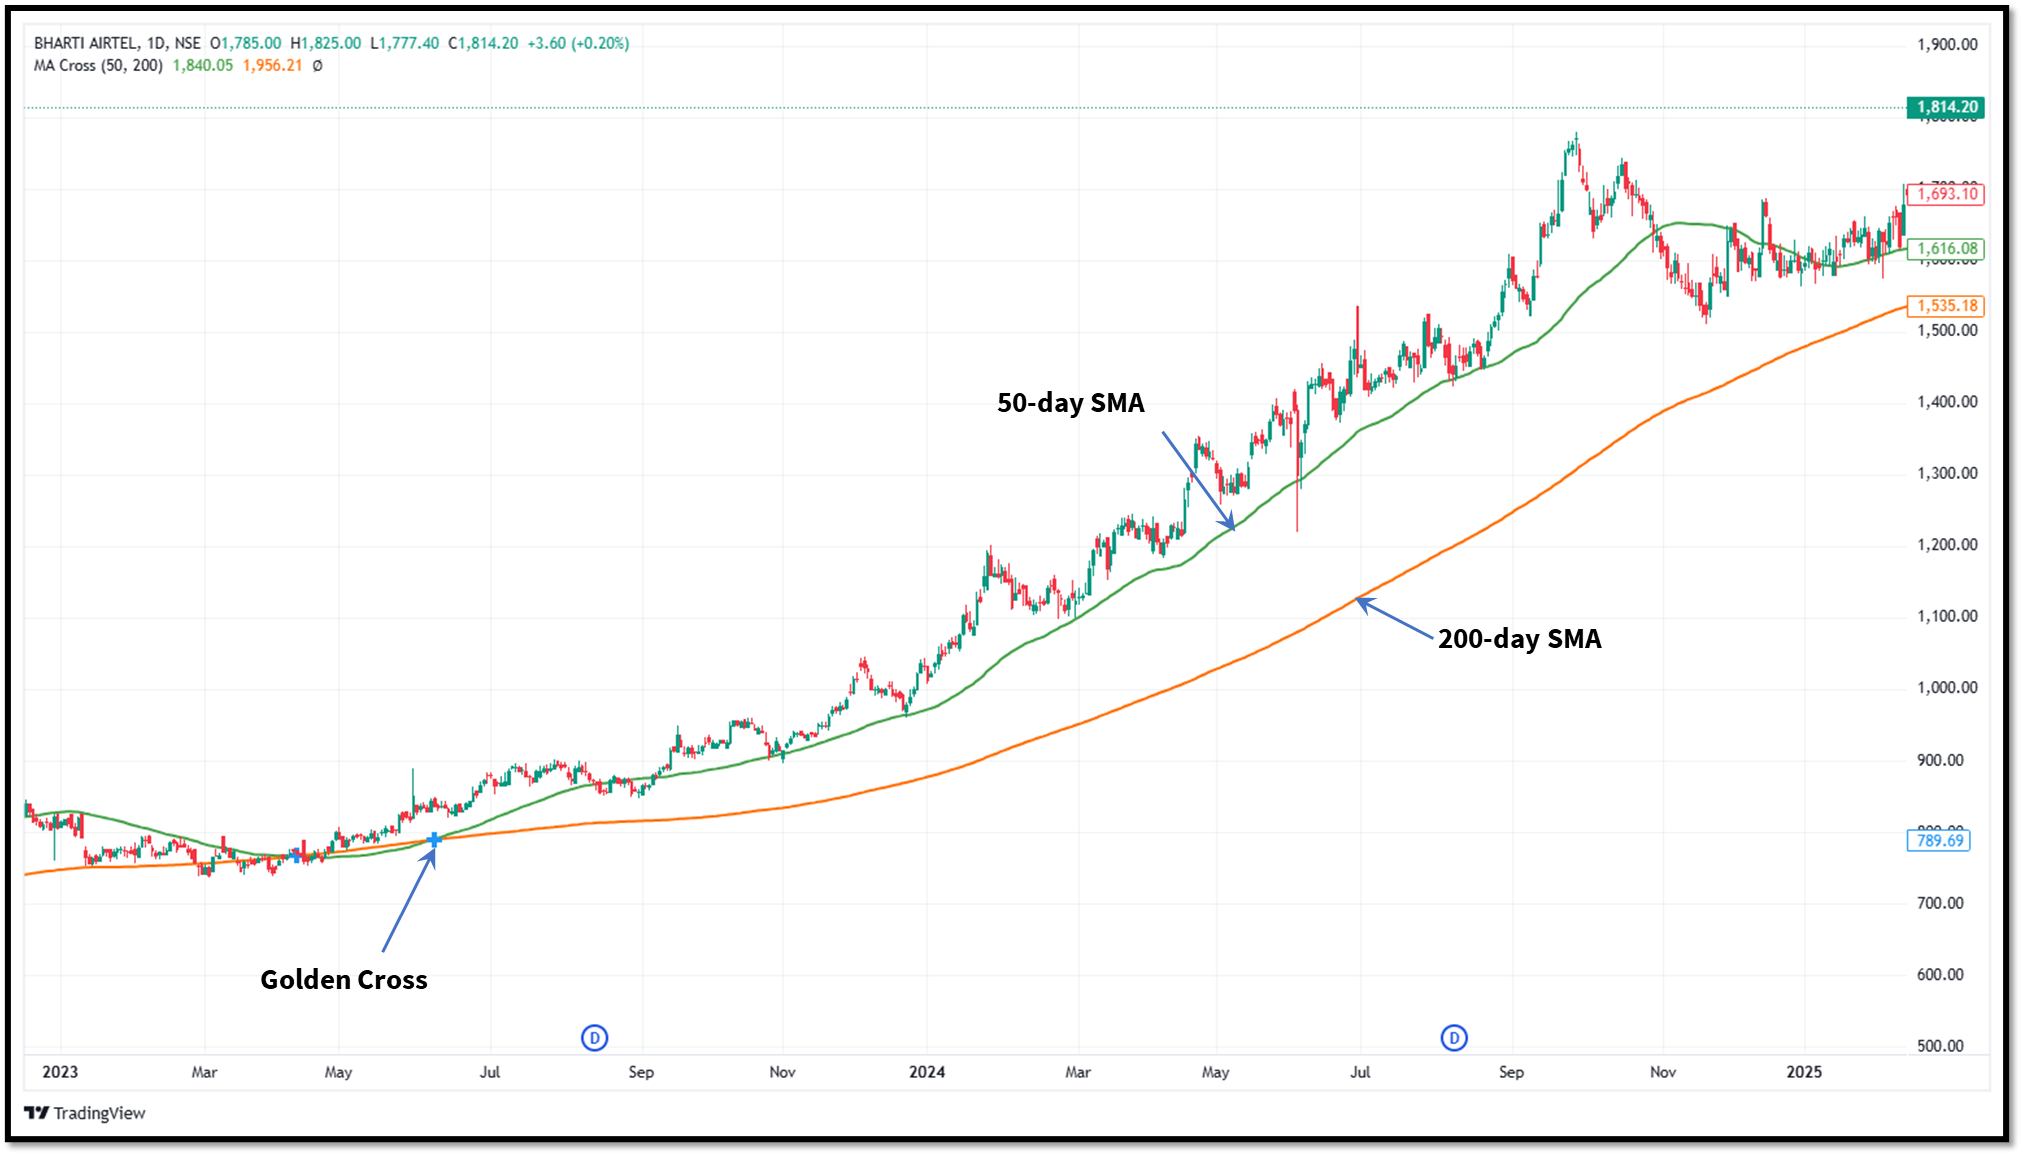
Golden Cross
A Golden Cross occurs when the 50-day SMA crosses above the 200-day SMA. Many traders view this as a significant long-term bullish signal.
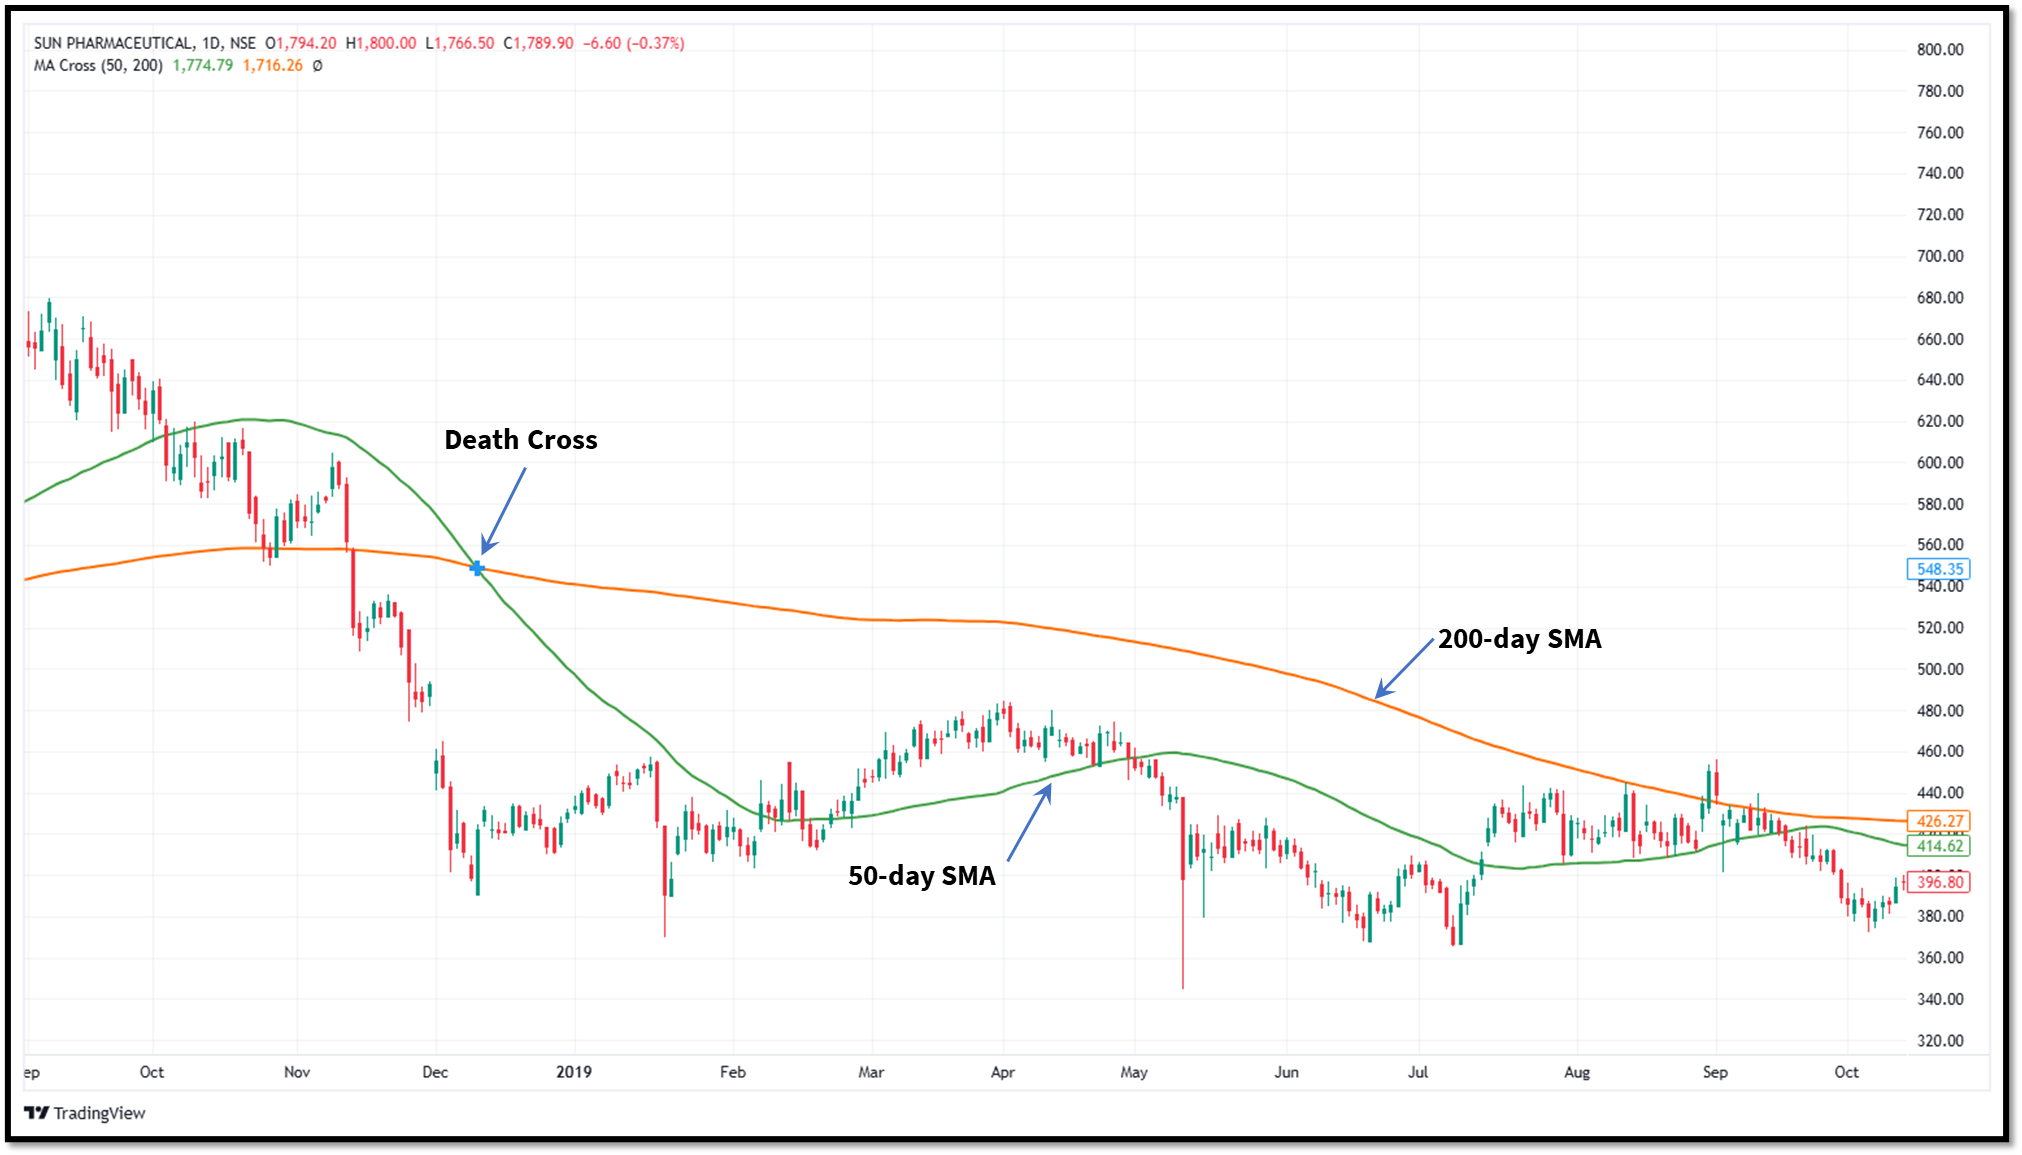
Death Cross
A Death Cross occurs when the 50-day SMA crosses below the 200-day SMA. This is usually considered a bearish long-term signal.
Advantages of the SMA indicator
The advantages of the SMA indicator are as follows:
- The SMA is one of the simplest technical indicators available, making it ideal for beginners.
- It helps traders quickly determine whether the market is moving higher, lower, or sideways.
- Because many market participants watch key SMA levels, they can sometimes become self-reinforcing support and resistance zones.
- The SMA works across multiple markets and timeframes, including stocks, commodities, forex, indices, and cryptocurrencies.
Limitations of the SMA indicator
Even though the SMA indicator has several advantages, it has some limitations as follows:
- The SMA indicator is a lagging indicator. Meaning it is based on historical data, it reacts after the price has already moved.
- When markets lack a clear trend, SMA crossovers can generate multiple false signals.
- The SMA gives equal importance to all price points within the calculation period. As a result, recent price changes may not influence the indicator as quickly as some traders would like.
- The SMA works best when combined with other technical analysis methods rather than used in isolation.
Wrapping up
The SMA is one of the most popular trend-following indicators that helps traders and investors to determine the broader market trend. It calculates the simple average of closing prices of defined periods. The traders and investors usually use SMA for trend identification, potential support and resistance and trading signals.
SMA smooths out the price fluctuations, but it is not suitable for short-term trading. It is a lagging indicator, and it is also less sensitive to sudden price moves. For short-term trading, traders usually prefer EMA as it is more sensitive than the SMA and gives more weight to recent prices.
FAQs
Which SMA period is best for trading?
There is no best SMA period, but traders use one according to their trading style. Short-term traders can use a 20-day SMA, while swing traders may prefer a 50-day SMA. Long-term investors often use the 200-day SMA to track trends.
Is SMA better than EMA?
We cannot say which is better as they perform better with respect to the strategy and timeframe. Long-term investors usually prefer SMA, while traders use EMA as it reacts quickly to price changes.
Can beginners use the SMA indicator effectively?
Yes, the SMA is one of the most beginner-friendly indicators because of its simple calculation and easy interpretation.
Can SMA be combined with other indicators?
Yes, SMA is commonly combined with indicators such as RSI, MACD, Bollinger Bands, and volume analysis. Combining SMA with other indicators increases its effectiveness.
Is SMA useful for long-term investing?
Yes, long-term investors frequently use the 100-day and 200-day SMA to assess the overall market trend and identify whether an asset is trading in a long-term bullish or bearish phase.