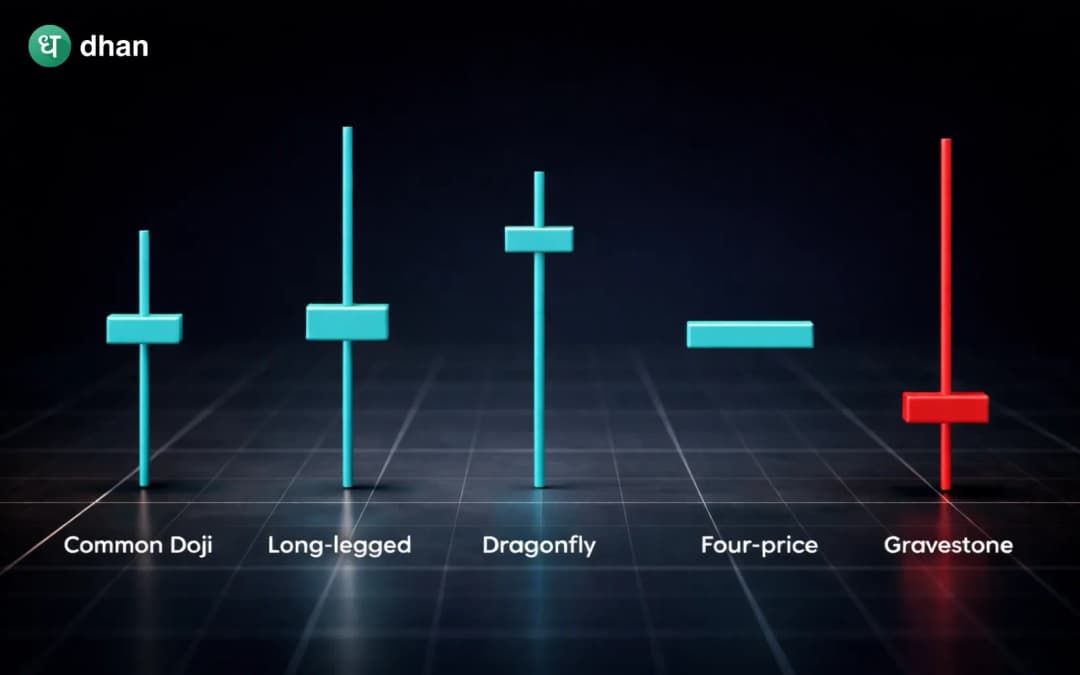
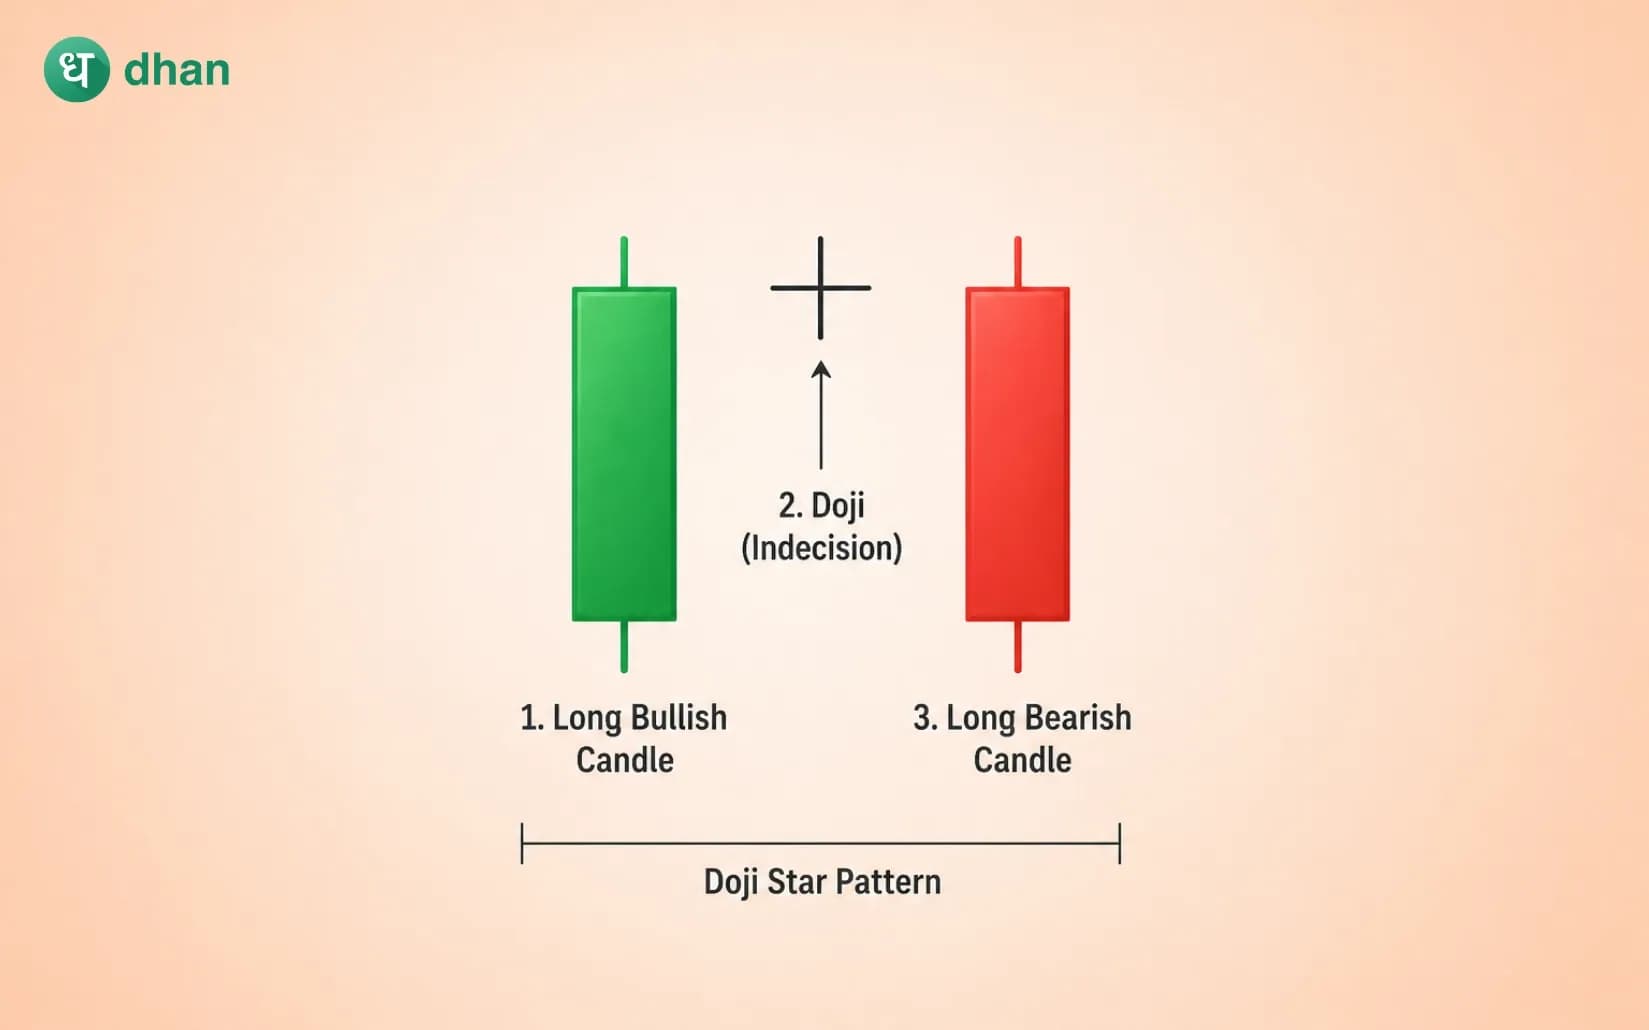
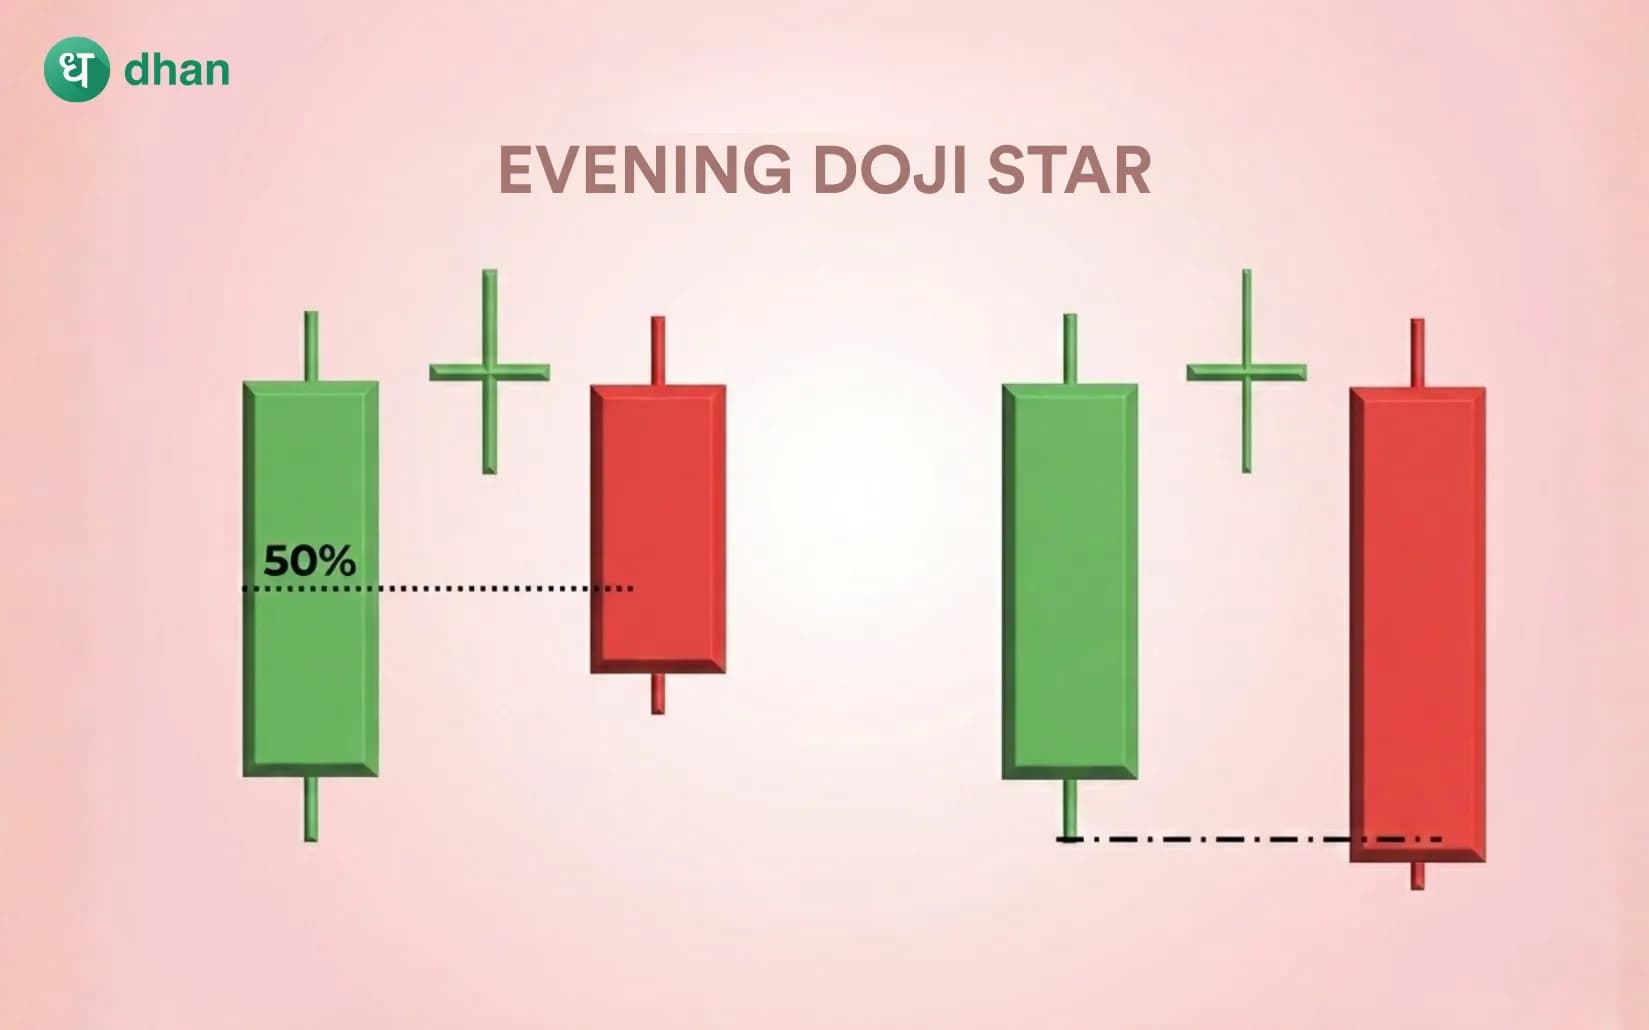
What is Doji Candle?
Candlestick charts are one of the most widely used tools in technical analysis. Traders use these patterns to understand price movements, identify potential trading opportunities, and interpret market sentiment to predict possible price movements by analysing candlestick patterns.
Team Dhan
|Mar 11, 2026, 02:54 PM
Team Dhan
|Mar 11, 2026, 02:54 PM