Ichimoku Cloud




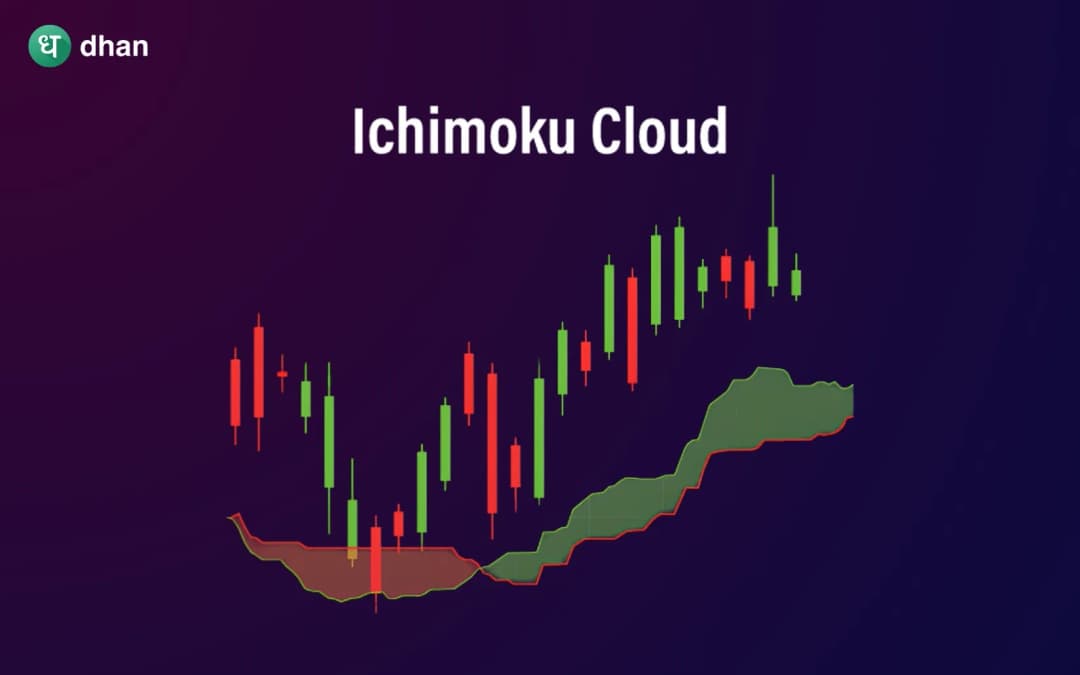




At first, you may get confused because of multiple lines and shading on the chart. But if you understand the basic structure behind those lines, then it becomes very easy to interpret. In this guide, we’ll break down the Ichimoku Cloud in a simple way covering its components, how it works, and how you can actually use it in real trading.
What is Ichimoku Cloud?
A Japanese journalist and technical analyst, Goichi Hosoda, developed the Ichimoku Cloud indicator in the 1930s. Even after development, he refined his approach, a process that cost him decades. In the 60s, he made it public as an all-in-one trading system.
To get the view of the market in all aspects was the motto behind the design of the Ichimoku cloud. It was primarily designed for the Japanese stock market, but soon gained popularity and was adopted in other markets, such as commodities and currencies.
Understanding Ichimoku Cloud
The term “Ichimoku” roughly translates to “one glance,” meaning the indicator is designed to give you a quick overview of the market. Ichimoku Cloud, also called Ichimoku Kinko Hyo, is a technical analysis tool that combines trend direction, momentum and support-resistance levels to give a broader view of the market.
It works best in trending markets and helps traders identify whether the market is bullish, bearish, or consolidating.
Components of Ichimoku Cloud
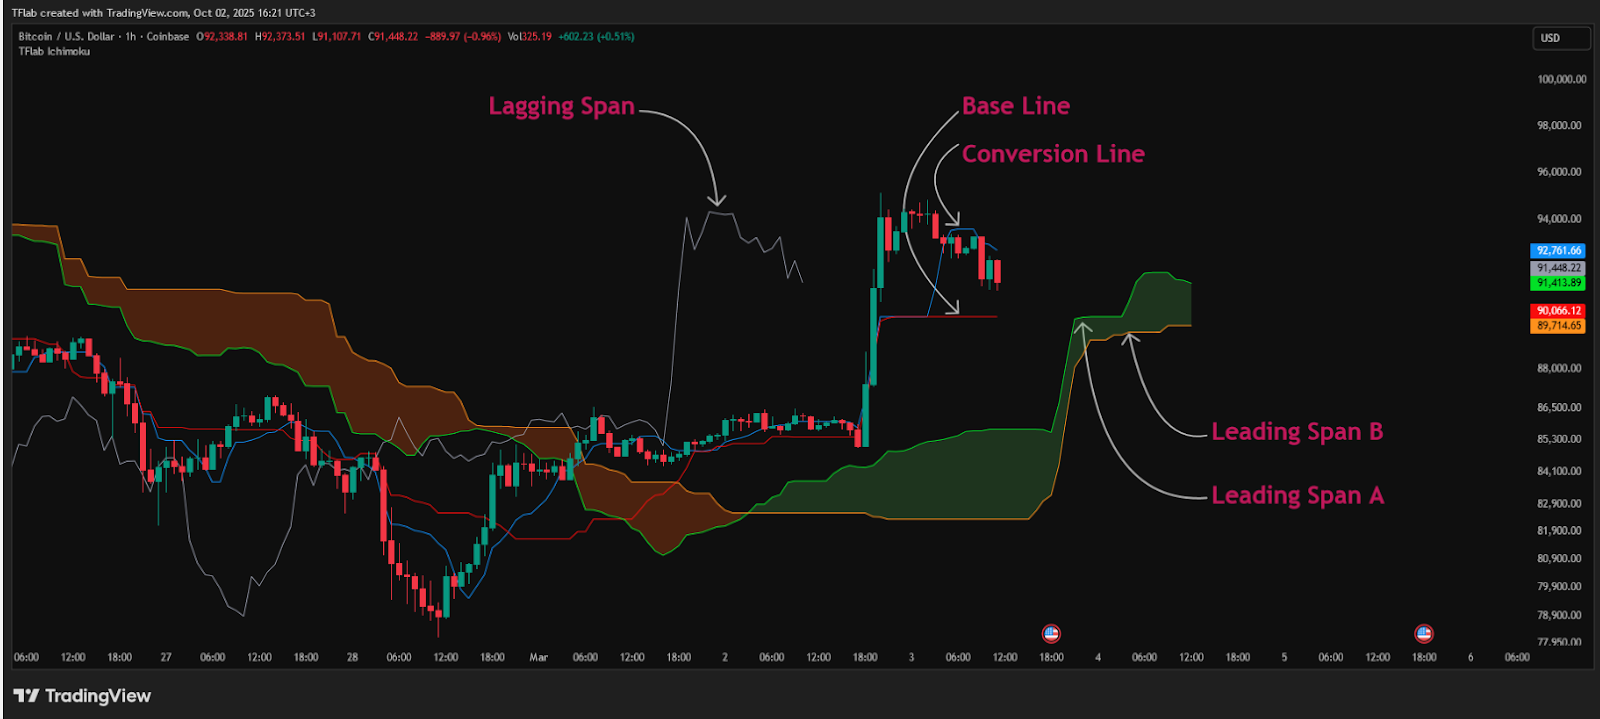
To understand the Ichimoku Cloud, you need to understand its components. It has six primary components as follows.
Tenkan-sen (Conversion Line)
The conversion line acts as a short-term indicator which represents recent price movement. It reacts quickly to price changes and helps identify short-term trends. The conversion line is calculated by averaging the highest high and lowest low of the defined period, which is usually 9.
Tenkan-sen = (Highest high)n + (Lowest low)n/2
Where, n = 9 periods
Kijun-sen (Base Line)
The base line represents the medium-term trend and is more stable than the Tenkan-sen. It usually acts as a key support or resistance level and is widely used to confirm trades. Similar to the conversion line, the base line is calculated by averaging the highest high and lowest low over the previous 26 periods. This line is usually smoother than the conversion line and reacts to price change slowly.
Kijun-sen = (Highest high)n + (Lowest low)n/2
Where, n = 26 periods
Senkou Span A (Leading Span A)
The leading span A line is calculated by taking the midpoint of the base line and conversion line, but the resulting point is plotted 26 periods in the future. The leading span A reacts more quickly than the Leading Span B.
Senkou Span A = Base line + Conversion Line2
It is projected to occur 26 periods in the future. The Leading Span A is one of the two lines that form the cloud.
Senkou Span B (Leading Span B)
This is the second boundary of the cloud. It is calculated using a longer time period, usually 52, making it slower and more stable. The resulting point is plotted 26 periods in the future.
Senkou Span B = (Highest high)n + (Lowest low)n/2
Where, n = 52 periods
Kumo (Cloud)
The space between Senkou Span B and Senkou Span A is called the cloud or “Kumo.” It represents dynamic support and resistance. The colour of the cloud indicates the trend. The green colour represents a bullish trend, while the red colour represents a bearish trend.
Chikou Span (Lagging Line)
The lagging line is nothing but the most recent closing price plotted 26 periods in the past. It acts as a trend confirmation tool. It is also considered a dynamic support and resistance level.
The above components of the Ichimoku cloud are shown in the figure below.
How Ichimoku Cloud works
The Ichimoku Cloud combines multiple elements into one system. A bullish trend is when the price trades above the cloud. When it trades below the cloud, it means the market is going down. Also, when the price is inside the cloud, it means that things are stable or unclear.
A thicker cloud means stronger support or resistance, making it harder for the price to break through.
Ichimoku Cloud interpretations
The Ichimoku Cloud is designed to give a view of the asset or market in its entirety. But the following interpretations are prominent.
Trend identification
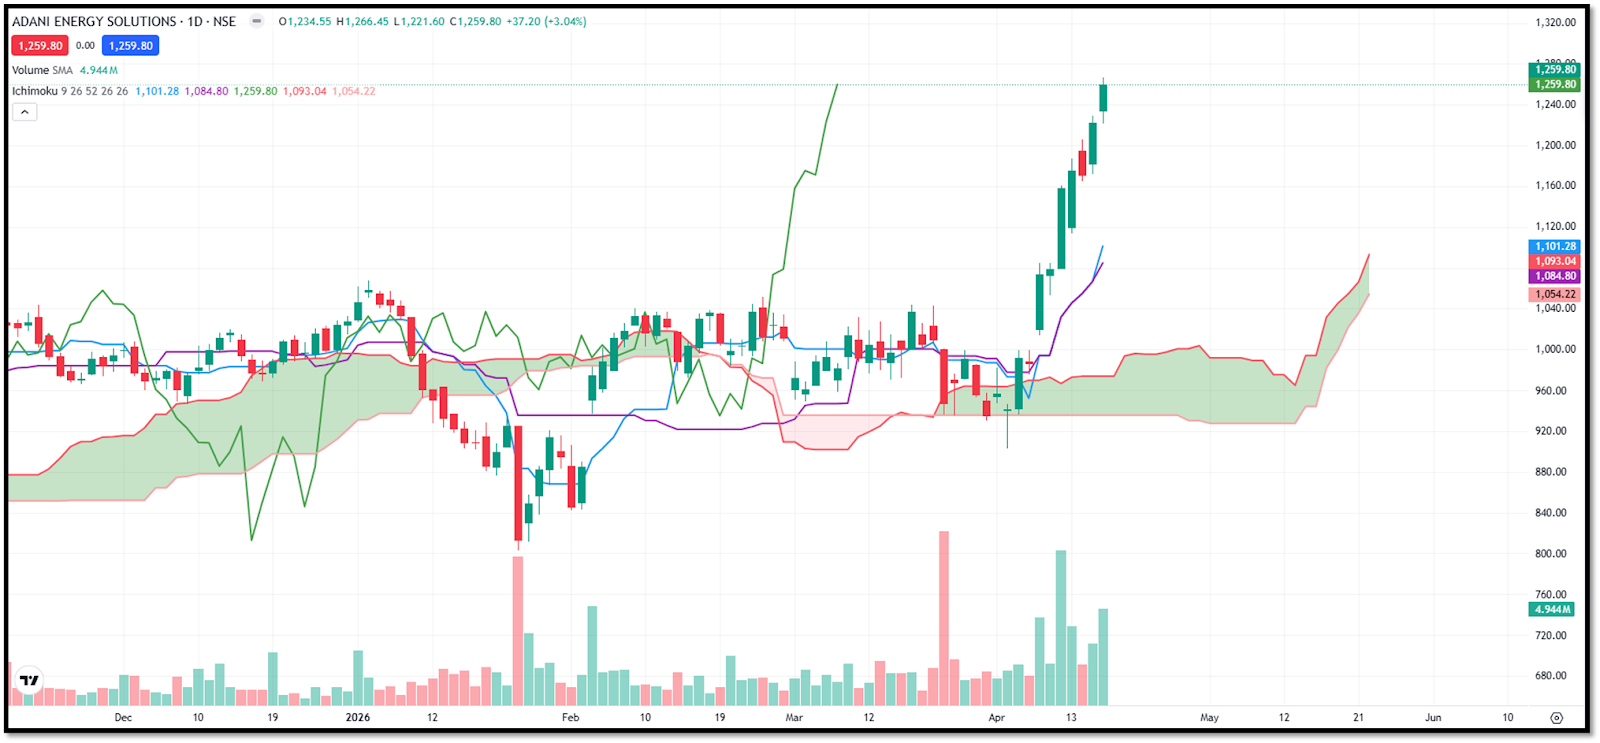
This is one of the most common interpretations that Ichimoku Cloud represents, and it is very easy to identify. If the price is above the cloud, you should look for buying opportunities. If it is below the cloud, focus on selling opportunities.
Entry signals
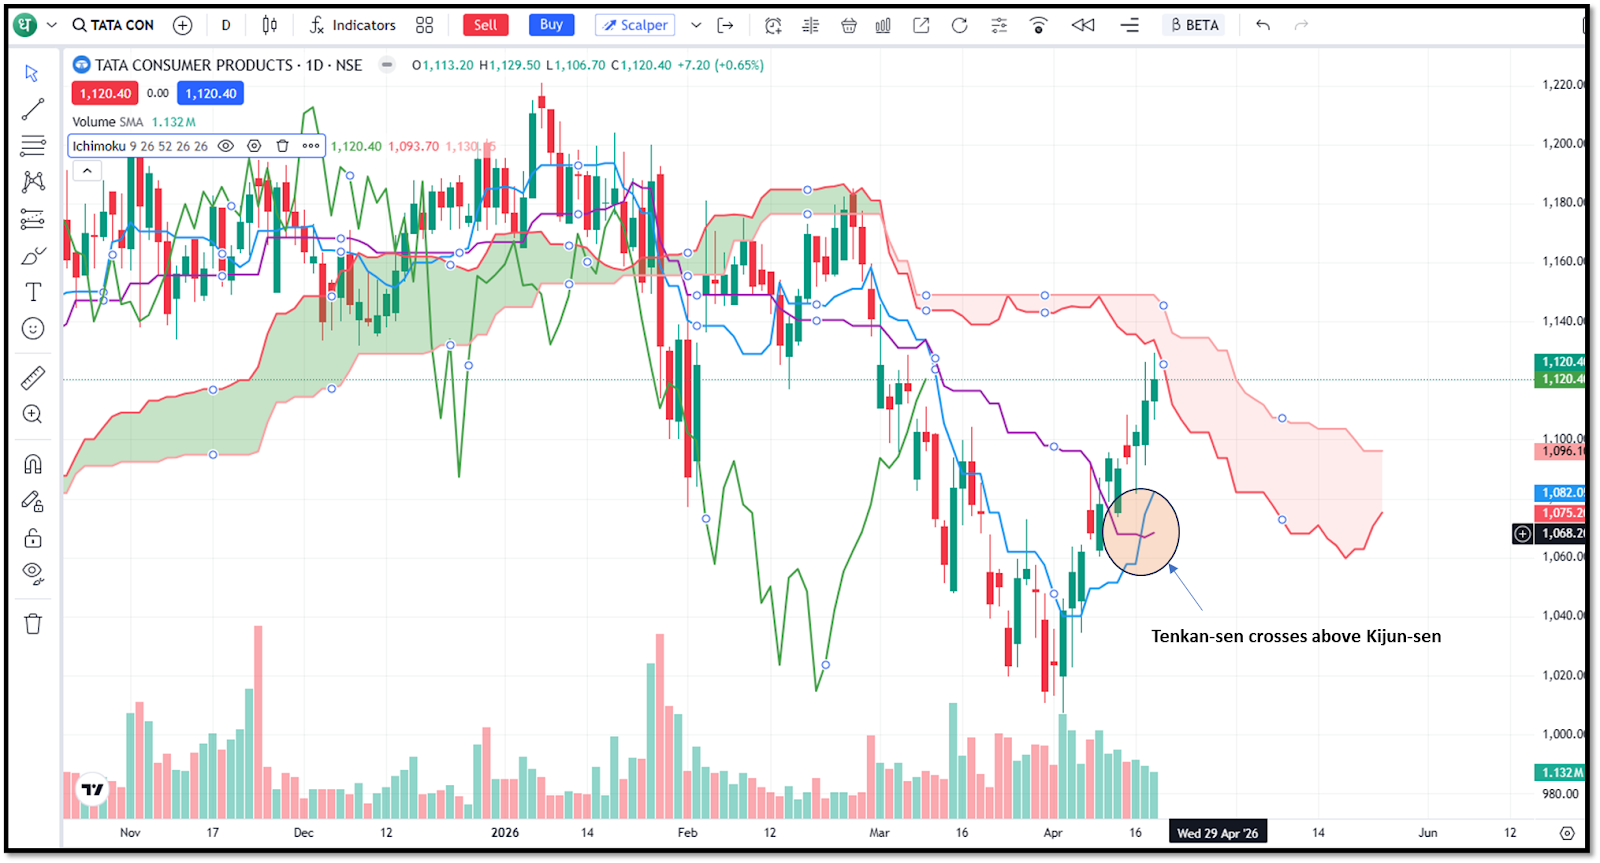
This is a cross-over signal between Tenkan-sen and Kijun-sen. When Tenka-sen crosses above Kujun sen, it represents a bullish signal for entry. If it crosses below, it can be considered a bearish signal.
These signals are considered stronger if they appear above or below the cloud.
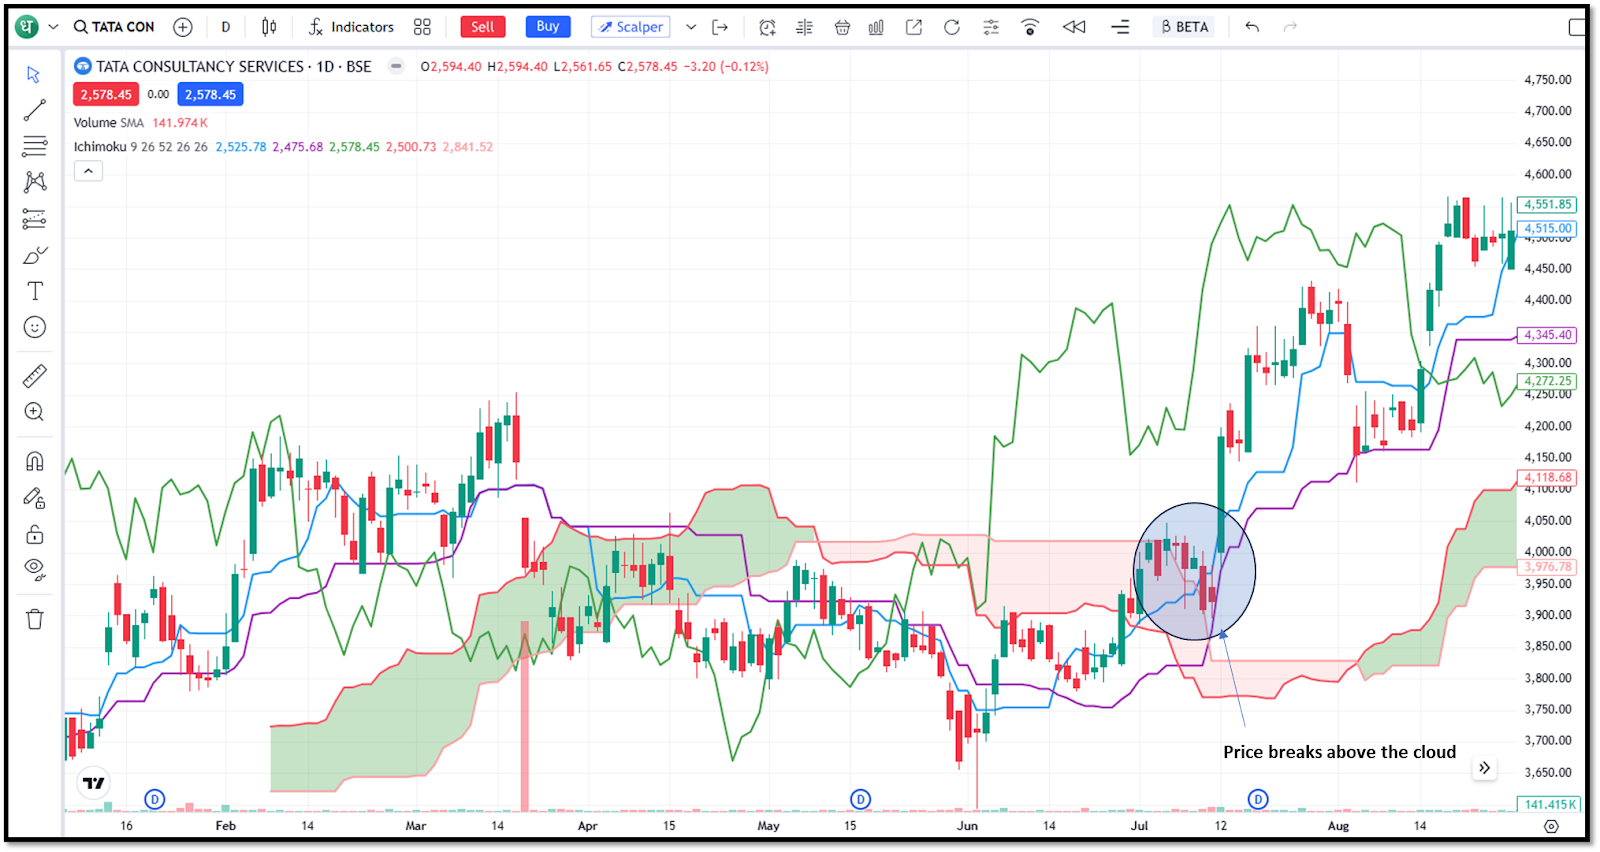
Cloud breakout
When the price breaks above the cloud, it signals a potential bullish trend, and if the price breaks below the cloud, it signals bearish momentum. These breakouts are usually followed by strong price movements.
Support and resistance
The cloud is considered a dynamic support and resistance. If the market is in an uptrend, the cloud acts as support, while if it is in a downtrend, it can act as resistance. The Kijun-sen also serves as an important level for pullbacks.
Ichimoku trading strategies
The following trading strategies you can use while using the Ichimoku indicator.
Trend following strategy
Many traders use this strategy. In this strategy, trade in the direction of the cloud. You should avoid going against the trend unless there is strong confirmation.
Breakout Strategy
Enter trades when the price breaks out of the cloud with momentum. This usually signals the beginning of a new trend.
Pullback Strategy
In this strategy, wait for the price to retrace to the Kijun-sen or the cloud and then enter in the direction of the trend. This helps you get better entry prices.
Advantages and Limitations of Ichimoku Cloud
Now, let’s see the advantages and drawbacks of Ichimoku Cloud.
Advantages of Ichimoku Cloud
- Ichimoku Cloud reduces the need for multiple tools. You can gauge trend, momentum, support and resistance levels by using a single indicator.
- Trend identification is very easy.
- The Ichimoku cloud is very effective in trending markets.
Limitations of Ichimoku Cloud
- For beginners, it is slightly complicated to understand and interpret.
- It is usually less effective in a sideways market.
- Interpretations can be tricky and require practice to interpret signals correctly.
To wrap up
The Ichimoku Cloud is one of the most widely used indicators by professional traders. It can be a little tricky to understand the indicator in the beginning, but it is worth learning. The Ichimoku cloud is known for analysing trend, momentum, and key levels - all in one place.
Instead of relying on multiple indicators, you can use Ichimoku to simplify your analysis and make more informed decisions.
FAQs on Ichimoku cloud
Is Ichimoku Cloud suitable for beginners?
Yes, beginners can also use it, but it can look complex at the beginning. Once you understand each component step by step, it becomes much easier to use.
Which timeframe is best for Ichimoku Cloud?
Ichimoku works on all timeframes, but it is more reliable on higher timeframes like 1-hour, 4-hour, and daily charts.
Can Ichimoku Cloud be used alone?
Yes, the Ichimoku Cloud is designed to work alone and provide multiple aspects of the market at a single glance.
How reliable is the Ichimoku Cloud indicator?
Ichimoku is quite reliable in trending markets and helps capture strong moves. However, like any indicator, it is not perfect and can give false signals in sideways markets.
What is the best Ichimoku strategy for beginners?
The trend following strategy is best if you are a beginner. Look for buying opportunities when the price is above the cloud and selling when it is below. This keeps things clear and avoids confusion.