



Zig-Zag Indicator








Key takeaways
- The Zig Zag indicator is a charting tool that filters out smaller price movements and highlights significant swing highs and swing lows.
- It is mainly used to identify market structure, trends, retracements and important price swings rather than predict the next price move.
- The indicator typically uses parameters such as percentage change, price deviation, depth or reversal amount to decide which moves are significant enough to display.
- Zig Zag lines can make complex price action easier to read, especially when a chart contains frequent minor fluctuations.
- The indicator can help traders identify patterns such as higher highs, higher lows, lower highs and lower lows.
- A major limitation is that the most recent Zig Zag swing can change as new price data arrives. This makes it unsuitable for treating an unfinished swing as a confirmed trading signal.
Price charts can become difficult to interpret when you can see every small wiggle. Stock goes up, then back up a little, then recovers, then goes down again. These short-term fluctuations make the broader trend harder to identify.
The Zig Zag indicator is used to simplify such fluctuations in price action. It filters out smaller movements and draws lines between more meaningful swing points.
For example, suppose a stock moves from ₹100 to ₹110, falls to ₹106, rises to ₹115 and then declines to ₹108. A normal price chart shows every movement between these levels. Depending on its settings, the Zig Zag indicator may ignore some of the smaller fluctuations and focus on the larger swings from one important turning point to another.
What is the Zig Zag indicator?
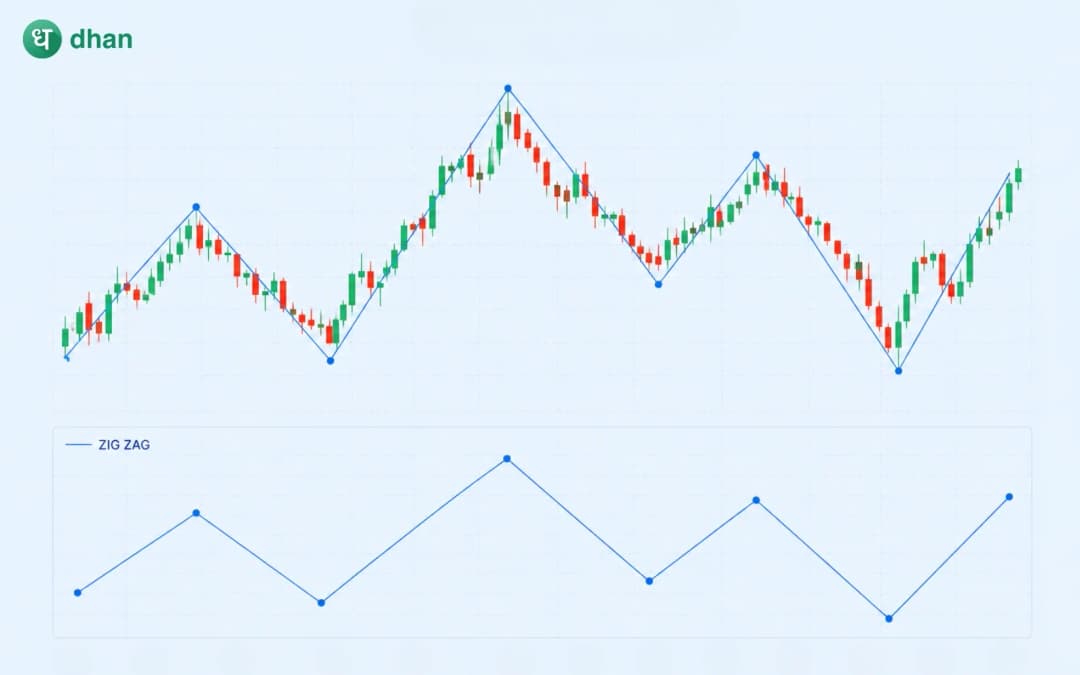
The Zig Zag indicator is a technical analysis tool that connects significant highs and lows on a price chart while filtering out price movements below a chosen threshold.
When the market moves sufficiently in one direction, the indicator marks a swing point. If the price then reverses by enough to meet the indicator's settings, a new swing is formed and connected to the previous one.
The result looks like a series of alternating upward and downward lines. The exact swing points depend on the parameters set by the trader. A smaller reversal threshold will produce more swing points, and a larger threshold will filter out more short-term movements.
How does the Zig Zag indicator work?
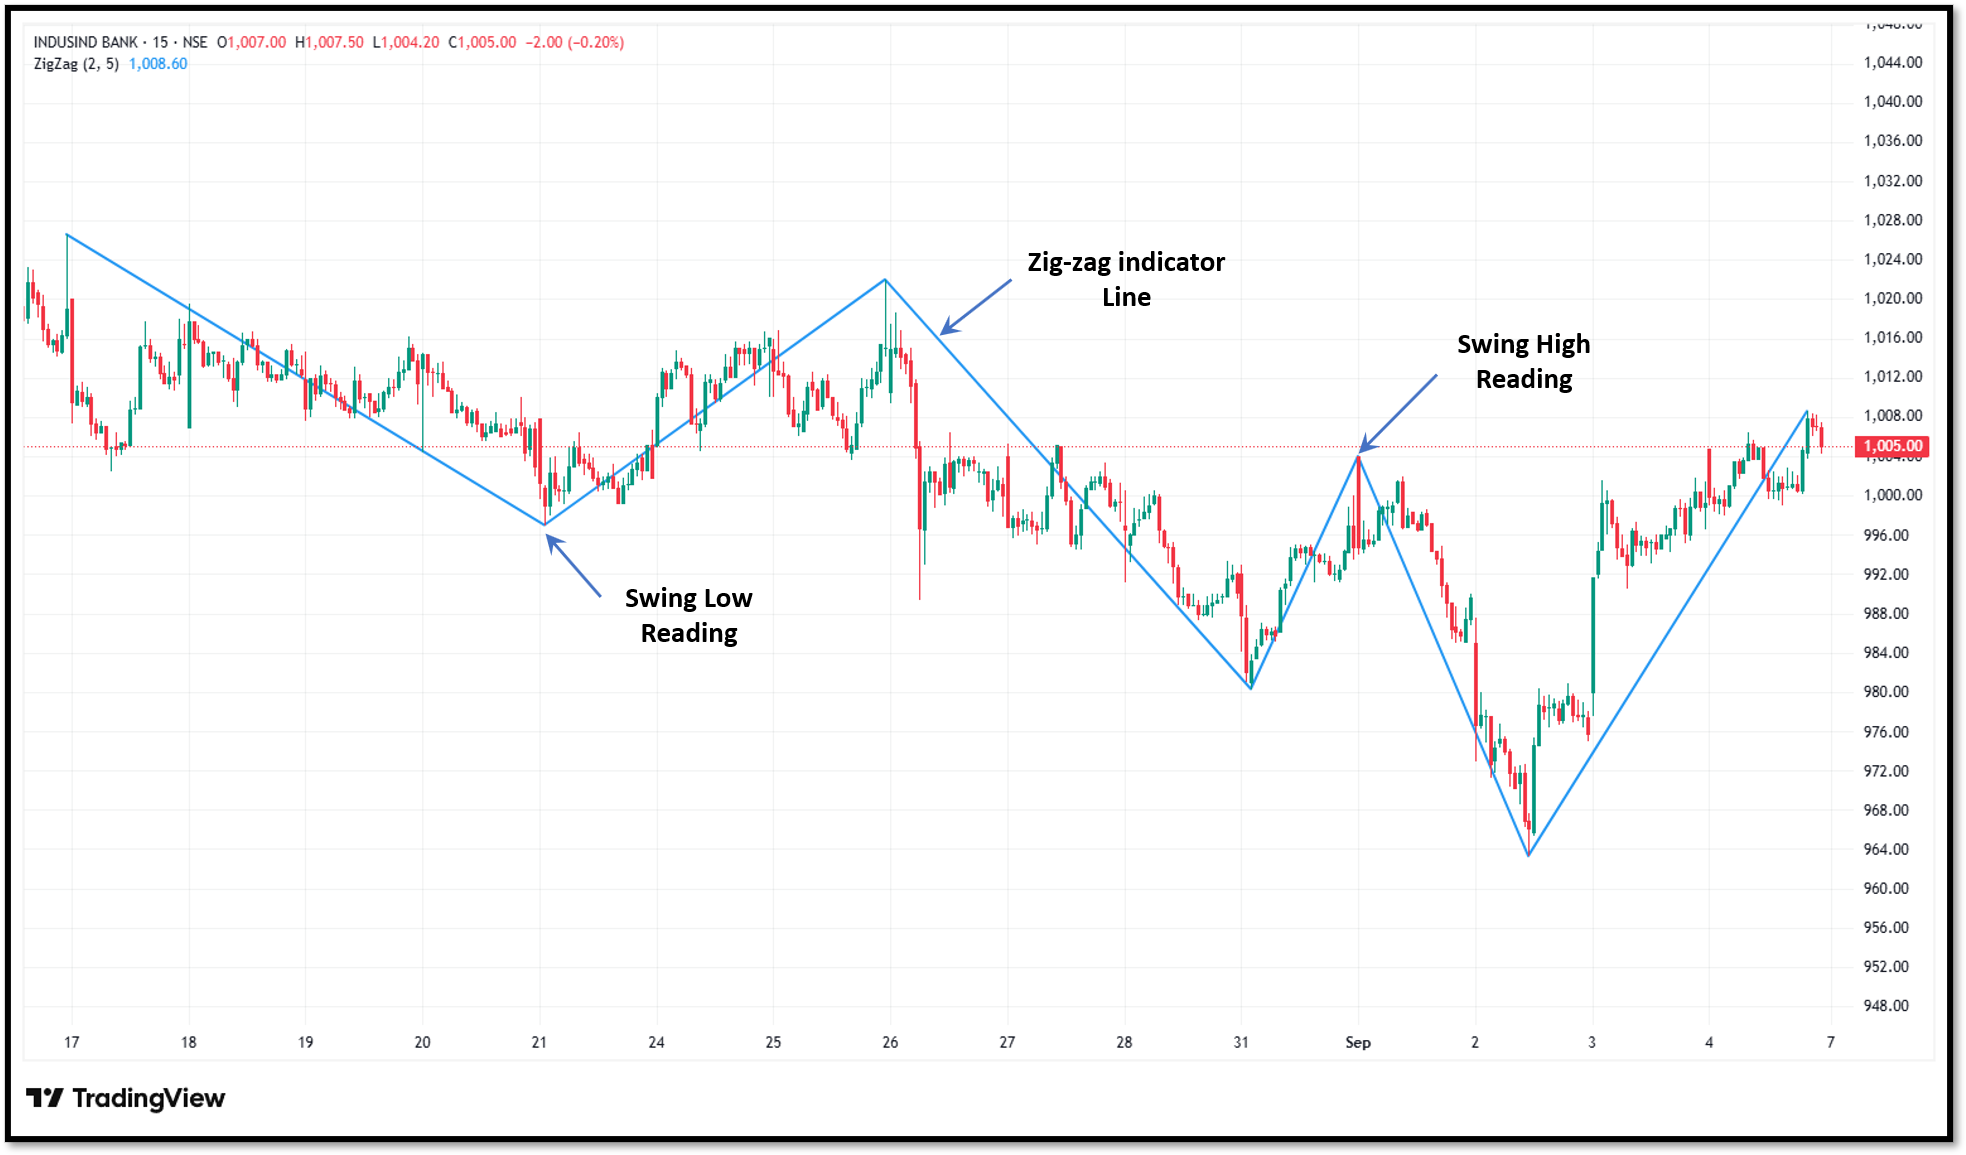
The Zig Zag indicator uses the basic principle of ignoring small price movements and highlighting larger reversals.
Consider a stock trading at ₹500. If the Zig Zag setting requires a 5% reversal, a move of only 1% or 2% may not create a new swing point. But if the price moves significantly enough to satisfy the selected threshold, the indicator can mark a new high or low.
The calculation can vary between charting platforms. Depending on the implementation, settings may involve percentage deviation, points, depth or a reversal amount. Hence, traders should understand the specific parameters available on their charting platform.
Understanding swing highs and swing lows
A swing high is a significant local peak where the price declines, while a swing low is a significant local trough where the price increases.
The Zig Zag indicator draws lines that simplify the price movements by connecting the defined points.
Suppose the market forms the following sequence:
₹100 → ₹115 → ₹107 → ₹125 → ₹116
The indicator may identify ₹100 as a swing low, ₹115 as a swing high, ₹107 as another swing low and ₹125 as the next swing high, depending on the chosen settings.
This allows traders to examine the relationship between successive swings instead of focusing on every candle.
How to read the Zig Zag indicator
One of the simplest ways to use the indicator is to study the sequence of swing highs and lows.
Prices in an uptrend usually consist of higher highs and higher lows. If the Zig Zag line indicates swing after swing, that is,
₹100 → ₹115 → ₹108 → ₹125 → ₹118
the swing highs are rising, and the swing lows are also rising. This suggests a bullish market structure.
A downtrend, by contrast, tends to produce lower highs and lower lows. For example:
₹150 → ₹135 → ₹142 → ₹125 → ₹132
Here, both the major highs and lows are moving downward.
A sideways market may show swings that repeatedly remain within a relatively similar price range. The Zig Zag line can make this range easier to recognise because it removes some of the smaller fluctuations.
How traders use the Zig Zag indicator
The Zig Zag indicator can be used in the following ways:
Identifying market structure
The Zig Zag indicator can make the sequence of major highs and lows easier to visualise. Traders can use these swings to determine whether the market is broadly producing higher highs and higher lows or lower highs and lower lows.
Finding important swing points
The indicator can highlight historical turning points that may deserve further attention. Traders can then compare these areas with support and resistance levels, previous breakouts or other price-action signals.
The Zig Zag line itself does not make the level important; rather, it helps traders identify swings that can be studied in greater detail.
Studying retracements
Traders can use the major swing points identified by Zig Zag to examine how much of a previous move the market has retraced.
For example, after a stock rises from ₹100 to ₹140 and subsequently falls toward ₹120, the trader can study the retracement from the identified swing high and low.
Simplifying chart patterns
Large price structures can be easier to recognise when minor fluctuations are removed. Traders sometimes use Zig Zag swings as a visual aid when studying structures such as triangles, double tops, double bottoms and other chart formations.
Zig Zag indicator settings
There is no single setting that is ideal for every market or timeframe.
A smaller deviation or reversal setting makes the indicator more sensitive. It captures more price swings but may also include movements that are less significant.
A larger setting filters out more price movement and produces fewer, larger swings. This can make the broader trend easier to see but may remove useful intermediate movements.
The appropriate setting therefore depends on the trader's objective, instrument and timeframe.
A trader studying short-term price action may require a different sensitivity from someone analysing a long-term equity chart. Instead of looking for a universally "best" setting, traders should understand what level of price movement they want the indicator to filter.
Advantages of the Zig Zag indicator
Advantages of the Zig Zag indicator are as follows:
- By ignoring smaller price movements, the indicator makes major swings easier to distinguish from routine fluctuations. This can be particularly useful when a chart contains many candles, but the trader wants to study the broader movement.
- The alternating lines between highs and lows provide a simple way to examine whether the market is forming higher highs, higher lows, lower highs or lower lows.
- Traders can visually assess the size and sequence of major advances and declines instead of measuring every small fluctuation. This can be useful when studying retracements and historical market structure.
- The indicator can simplify the surveying of bigger formations by downplaying slight movements. Traders would then confirm the pattern through actual price levels and not only rely on the Zig Zag line.
Disadvantages of the Zig Zag indicator
Along with advantages, the Zig Zag indicator has the following disadvantages:
- The indicator needs subsequent price movement to confirm a reversal; the most recent line or turning point can move as new data arrives. Traders should therefore be cautious about treating an unfinished Zig Zag swing as confirmed.
- A Zig Zag line mainly describes significant historical price movements. It does not independently tell traders where price will move next.
- A sensitive setting may produce many swings, while a less sensitive setting may show only large movements. This means the apparent market structure can look different depending on the parameters used.
Common mistakes to avoid
Beginners usually treat every Zig Zag turning point as a buy or sell signal. The indicator filters out the small fluctuations and and display significant swings and does not generate independent entry signals.
Many traders also assume that the last visible line is permanent. As the market develops, the latest swing can change. Hence, traders should distinguish between confirmed historical swings and developing price action.
Using an arbitrary setting without considering the timeframe can also reduce the indicator's usefulness. The same sensitivity may produce very different results on a five-minute chart compared with a daily chart.
Finally, traders should avoid using Zig Zag to predict exact tops and bottoms. A cleaner-looking historical chart does not mean that future turning points can be identified with the same certainty.
To wrap up
The Zig Zag indicator is useful for simplifying price action and identifying significant market swings. It allows traders to focus on the relationship between important highs and lows and assess the broader structure of a market by filtering the small swings that can be confusing.
Its usefulness is strongest in analysis rather than prediction. Traders can use it to study trends, retracements, swing points and chart structures, while combining that information with price action, support and resistance, volume or other analytical tools.
FAQs
Is the Zig Zag indicator good for beginners?
Yes. Its basic concept is relatively easy to understand because it focuses on significant highs and lows.
Is the Zig Zag indicator a leading or lagging indicator?
It is generally considered a lagging or reactive indicator because a meaningful reversal needs to occur before a swing can be identified. The latest swing may also change as additional price data becomes available.
Can Zig Zag be used for intraday trading?
Yes, it can be applied to intraday charts. However, the settings become particularly important because short-term charts contain more price fluctuations and can produce many swings when the indicator is set too sensitively.
What is the best setting for the Zig Zag indicator?
There is no universal best setting. The appropriate parameter depends on the instrument, timeframe and the size of price movement the trader wants to filter.
Can Zig Zag be used with Fibonacci retracement?
Yes. Traders can use significant swing highs and lows identified by Zig Zag as reference points for studying Fibonacci retracement levels.







