Best Time Frames for Intraday Trading explained







Selecting the right time frame is one of the most important choices a trader can make in intraday trading. While many focus on indicators or strategies, the time frame strongly affects how market movements appear and how decisions are taken.
Some time frames deliver speed, others provide clearer trends, and the best option depends on individual style, risk tolerance, and trading goals.
In this article, we will look at the best time frames for intraday trading and how to apply them successfully.
What are the time frames in Intraday Trading?
In intraday trading, a time frame is the interval each bar or candlestick on your chart represents. For example, 1 minute, 5 minutes, 15 minutes, and so on. That matters because shorter frames reveal more granular price action and noise, while longer ones smooth out fluctuations and highlight trends.
For instance, imagine you use a 5-minute chart for a share. Each candlestick covers the open, high, low, and close price during a 5-minute period. If that share jumps from ₹100 to ₹102 in three minutes, the 5-minute bar will reflect that move.
But if you also view it on a 15-minute chart, you might see that the larger trend was sideways, making a 5-minute breakout less reliable in the bigger picture.
Take a quick look at the chart right below. It shows exactly how the same price move looks on a 5‑minute chart versus a 15‑minute chart.
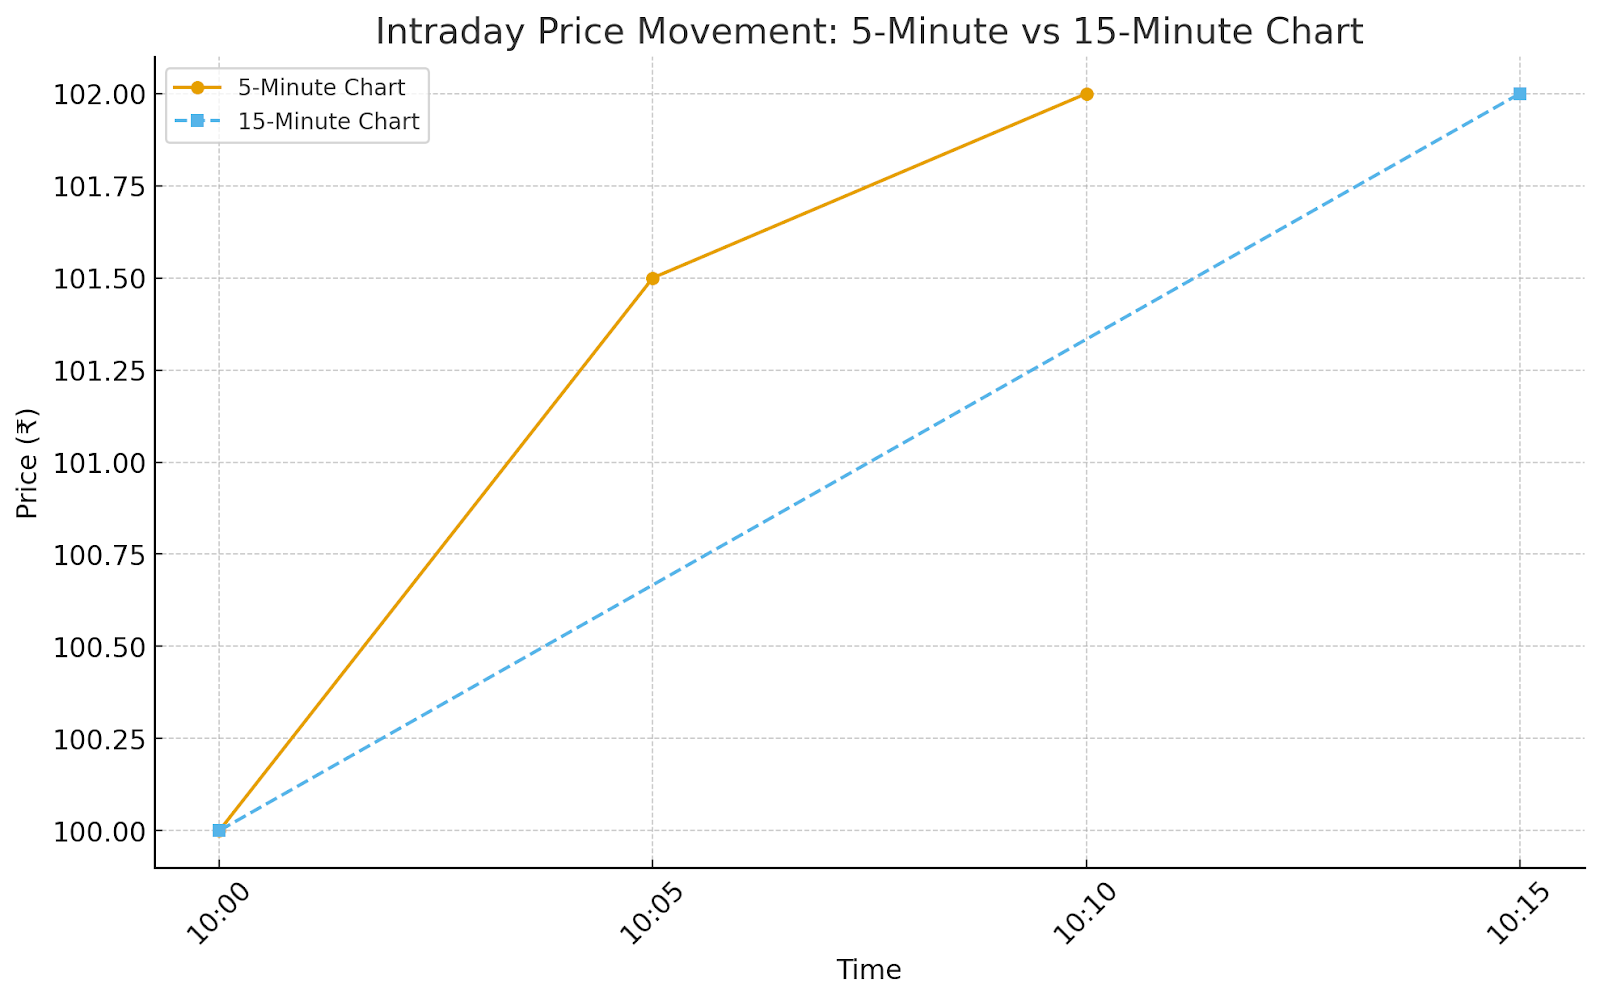
This visual difference highlights why selecting the right time frame is not just a technical preference but a key factor in reading market behavior accurately.
Most popular time frames and their use cases
When traders talk about “time frames,” they refer to how much real time each candle, bar, or data point represents on a chart. In intraday trading, some time frames are more commonly used because they balance signal clarity and responsiveness.
Below, we explore the best time frame for intraday trading and how they are applied in practice:
1‑minute chart
The 1‑minute chart is designed for ultra‑short‑term trading, where each candle or bar represents one minute of price activity. Traders who use this time frame are usually scalpers looking to capture quick, small profits from tiny price movements.
For example, if a stock breaks above its resistance at ₹500 and quickly surges to ₹503 within three minutes, a trader using the 1‑minute chart might enter at ₹500.50 and exit near ₹502.
Take a quick look at this chart; it shows exactly how that 1-minute trade could play out in real time.
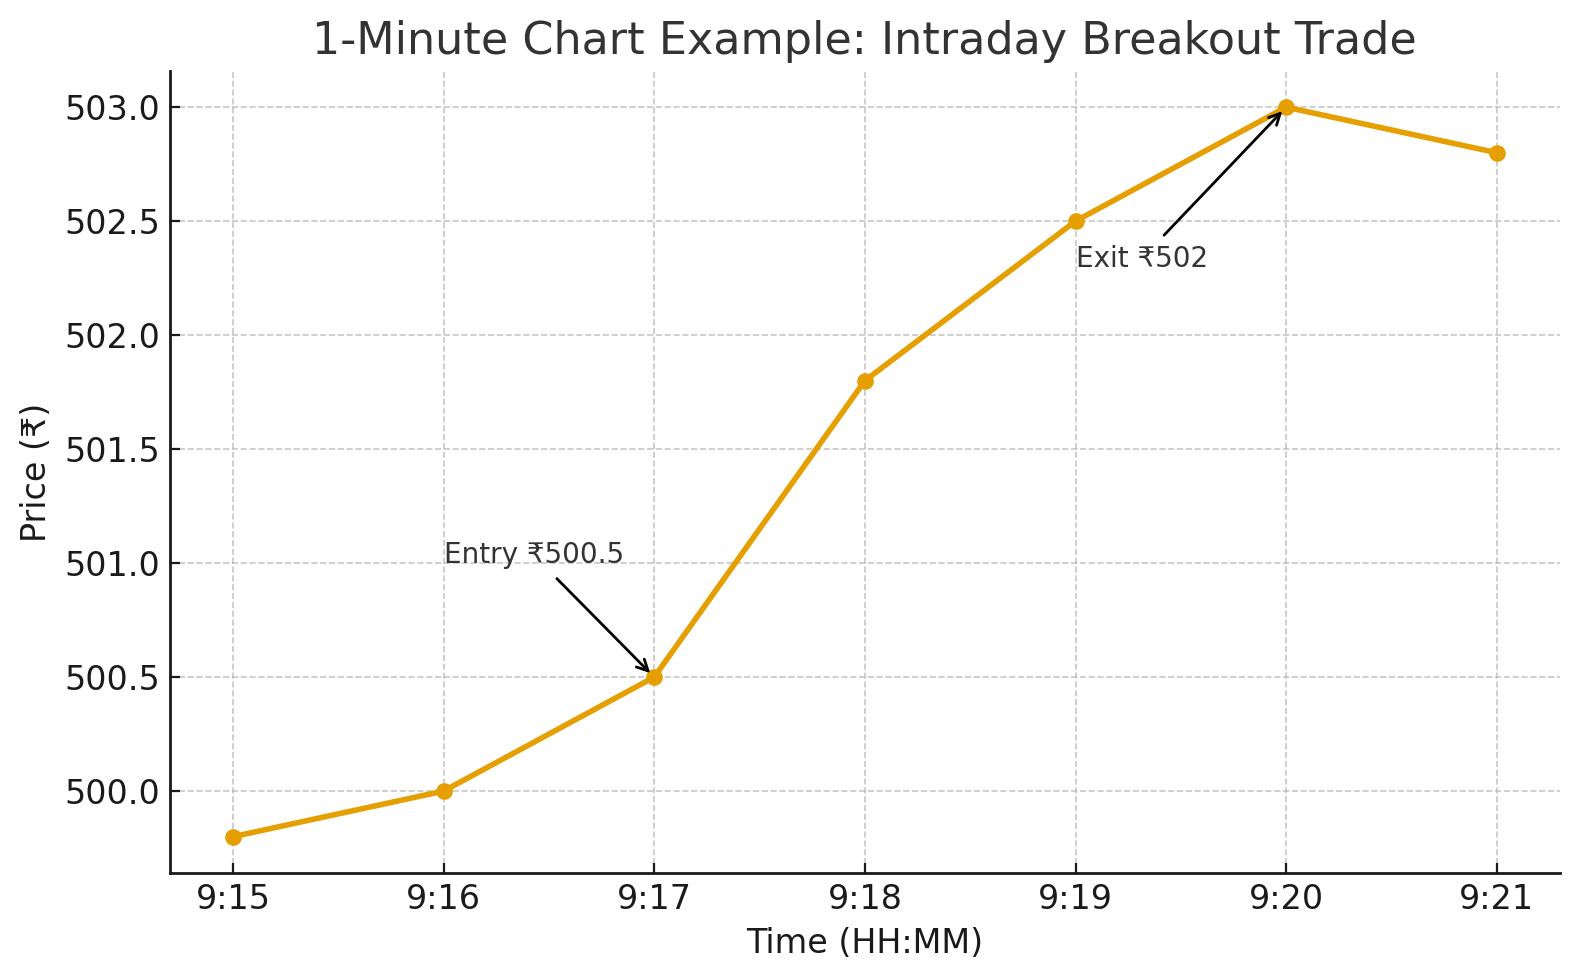
This 1‑minute price chart illustrates a typical intraday breakout trade. The stock crosses the ₹500 resistance level, prompting a quick entry at ₹500.5. Within a few minutes, the price surges to ₹503, allowing the trader to exit near ₹502, capturing a short‑term profit based on rapid price momentum.
These trades last only a few minutes but require quick decisions and fast execution.
The benefit is high trading frequency, but the downside is increased noise and false signals. It works best in highly liquid markets with tight spreads and strong volume during peak hours.
5‑minute chart
The 5‑minute chart strikes a balance between detail and readability, making it a favorite among intraday traders. Each candle reflects five minutes of market activity, helping spot short-term trends without the excessive noise of 1-minute intervals.
For example, if a stock steadily climbs and breaks above a resistance level around ₹240 with a spike in volume, traders may use this chart to enter a quick long trade, targeting a modest gain. The stop-loss often sits just below the breakout candle.
Check out the chart below, which shows how the price popped above ₹240 on the 5‑minute chart and kicked off that quick intraday move.
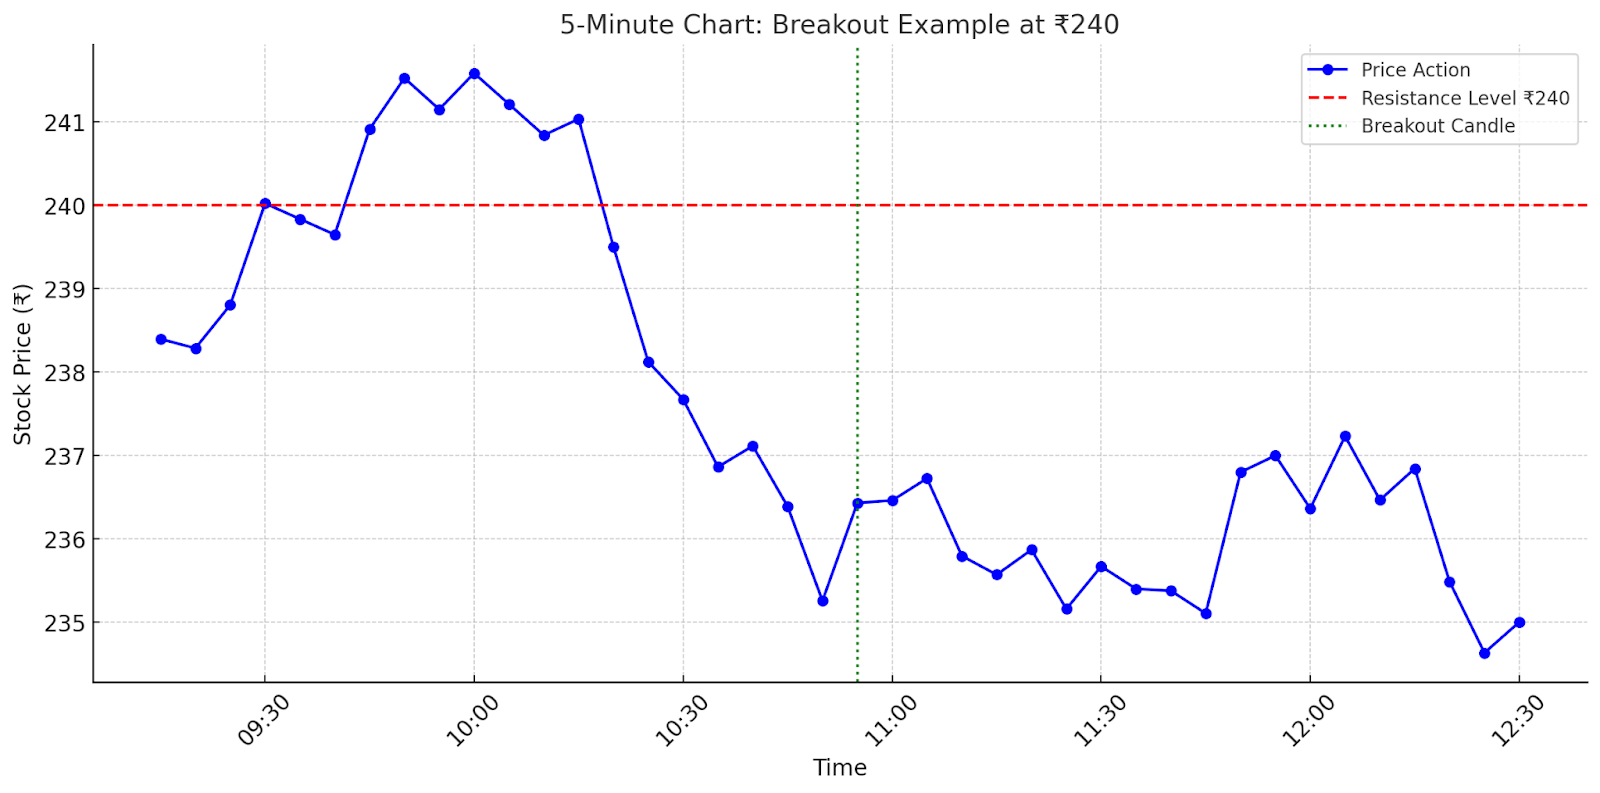
This time frame suits those who hold positions for 15 to 60 minutes and rely on momentum shifts, pullbacks, or small breakouts to guide decisions. It’s detailed enough to act, yet broad enough to filter out randomness.
15‑minute chart
This chart is a preferred time frame for identifying short-term trends while avoiding excessive noise from rapid price fluctuations.
Each candle reflects a quarter-hour of trading activity, making it useful for spotting sustained intraday moves.
For instance, if a stock shows a steady upward trend across three to four consecutive 15-minute candles, a trader might interpret that as a strong bullish signal, especially if it breaks above a recent resistance level.
Check out this chart right here. It shows how a stock breaks out on a 15-minute time frame with a clear resistance level and a surge in volume.
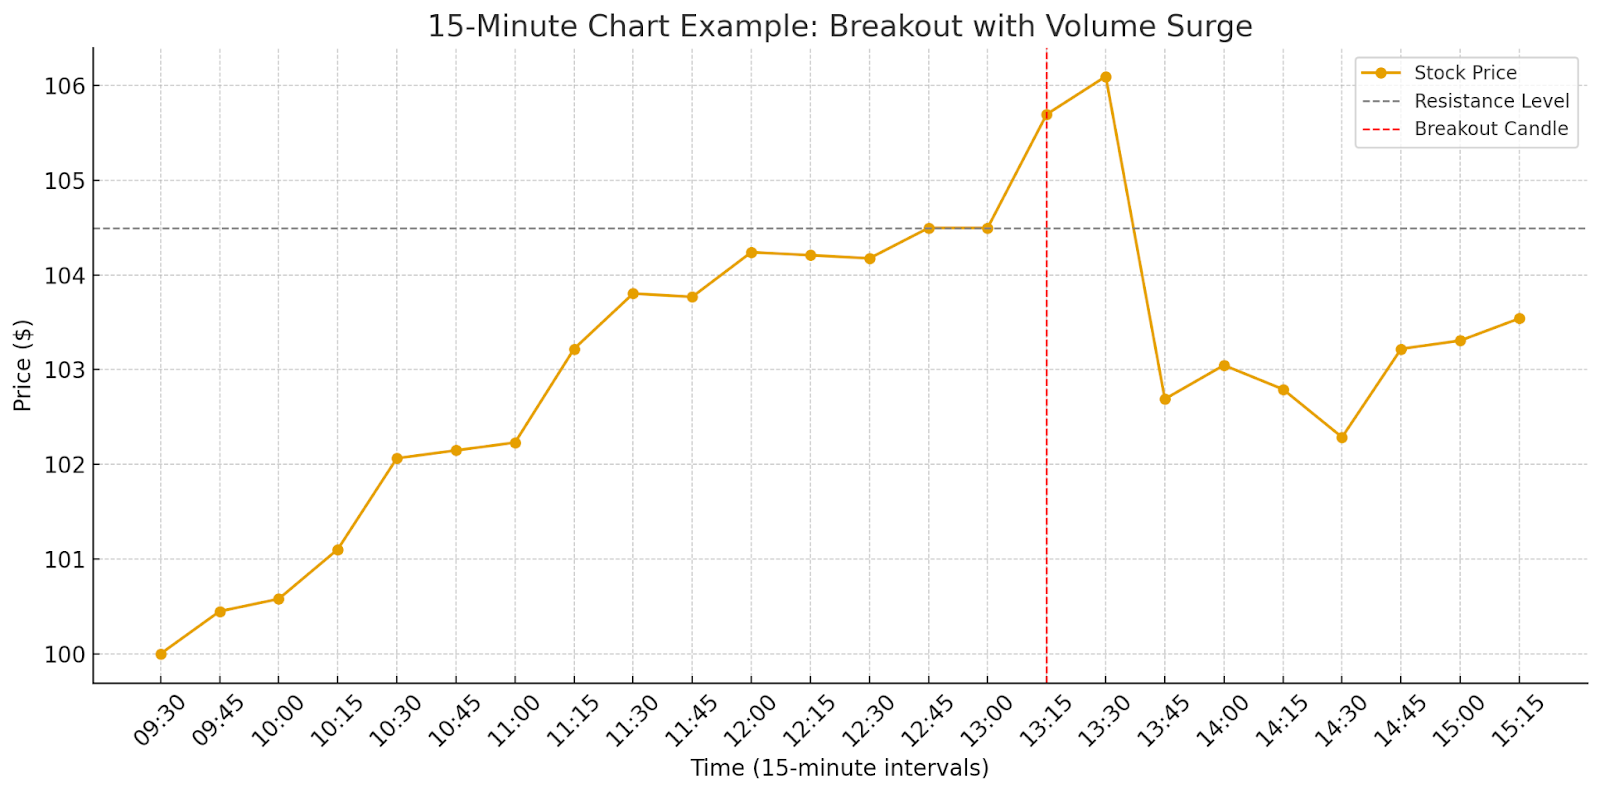
This setup provides more reliability than a quick jump on a 1-minute chart.
Many traders also use this time frame to set stop-loss and target levels, as the price patterns formed tend to be more stable. It strikes a balance between reactivity and clarity in intraday decision-making.
At Dhan, you can easily track 15-minute breakout stocks in real time.
30‑minute and 60‑minute charts
The 30-minute and 60-minute charts offer a broader perspective within the same trading day, helping traders identify sustained momentum and critical support or resistance zones.
These time frames are especially useful for understanding trend direction and avoiding trades against the prevailing flow.
For instance, if a stock is steadily rising on the 60-minute chart with higher lows throughout the morning, a trader might wait for a small pullback on the 5-minute chart before entering a long position.
Look at this 60-minute chart that demonstrates a clear uptrend with higher lows across the trading session. The annotated point highlights a potential entry opportunity following a brief pullback, aligning with the broader bullish momentum.
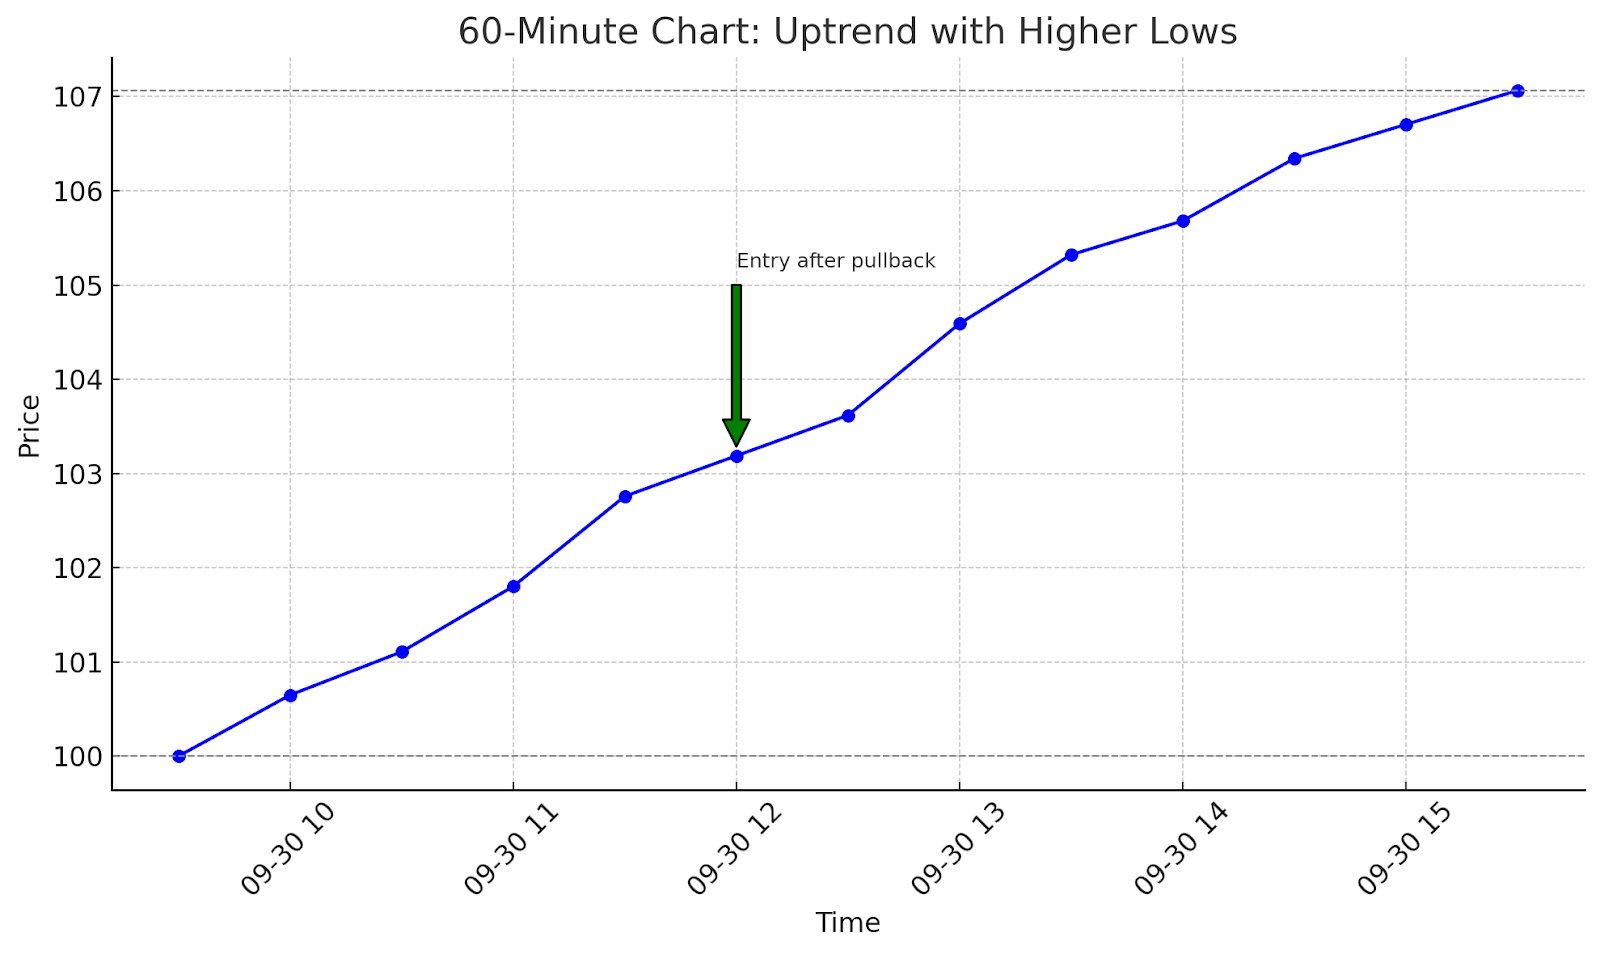
This method helps traders stay in line with the broader market direction, which can increase the likelihood of a successful trade.
Such charts are not typically used for precise entry points but serve as a guide to avoid traps and filter noise that often misleads on shorter intervals.
Wrapping up
Finding the intraday best time frame for trading depends on your trading style, risk tolerance, and how the market behaves. No fixed chart time frame works for everyone. Over time, with real market experience, traders develop a sense of what works best for them. The ability to adjust and refine your strategy is what leads to consistent trading decisions.