MACD strategy explained for momentum trading









A basic principle of momentum trading is that if prices are moving strongly in one direction, they continue to do so for a while, unless there’s a stumble in the momentum. So, the trick really is in identifying this shift early enough to enter or exit. A key identifier used by traders worldwide is the Moving Average Convergence Divergence (MACD).
In this article, we will cover in detail what MACD is and how to use MACD strategy.
What is MACD, and what does it measure?
MACD is a technical indicator of momentum- both direction and strength that uses fast and slow exponential moving averages. Before getting into the MACD strategy, it’s important to understand its key component - EMA, or Exponential Moving Average. EMA shows the average price of a stock over a specific period, but places greater emphasis on the latest prices.
This makes EMAs a momentum-specific indicator. There are multiple time-frame EMAs traders track, from 5, 9-day EMAs to 100-, 200-day EMAs. This is important to MACD.
MACD has three elements:
- MACD Line - This line represents the difference between the 12- and 26-day EMAs.
- Signal Line - This is a 9-day EMA of the MACD line.
- Histogram - This is the distance between the signal line and the MACD line plotted on a histogram.
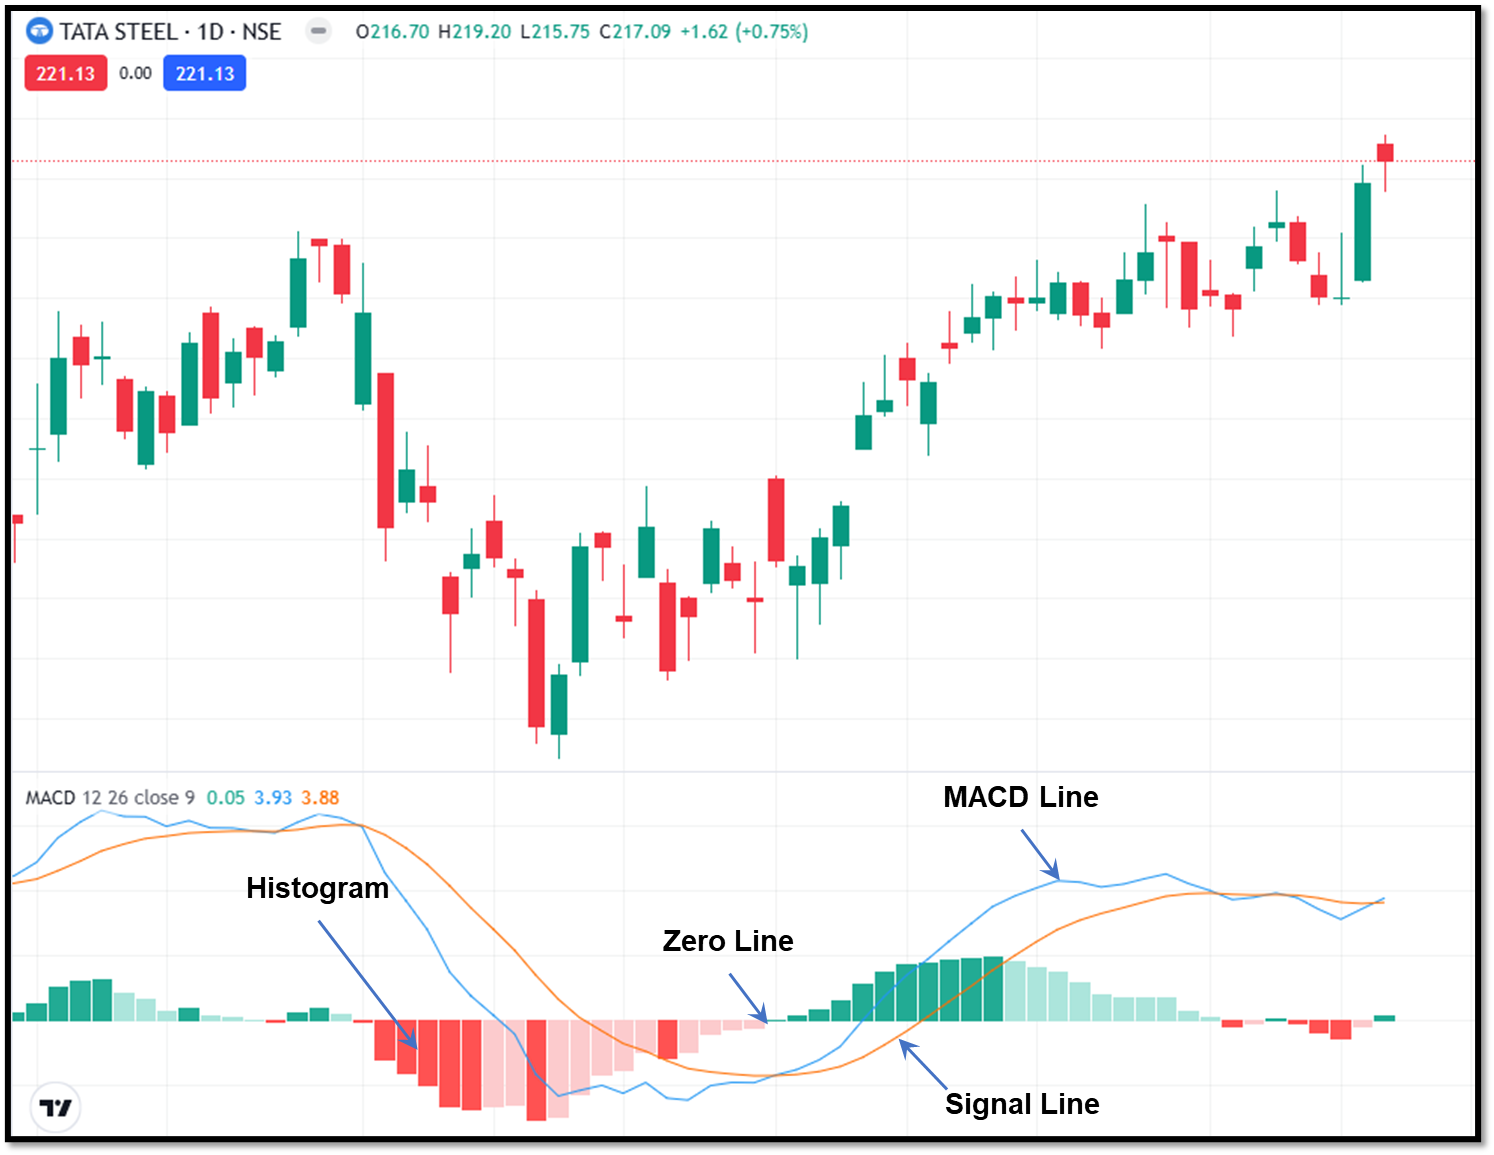
Together, these components indicate whether the momentum is building or fading.
Quick tips:
Short-term improvement in momentum - MACD rises above the signal line.
Momentum weakening - MACD falls below the signal line
Traders use this to detect early shifts in momentum trend strength.
How does MACD help identify momentum shifts?
Raw price data has multiple spikes and volatility. Moving averages take the average of past prices and cut out the noise, resulting in a smoother line, making it easier for the human eye to understand.
When the short-term EMA pulls away from the long-term EMA, the MACD line rises. That rise hints at momentum building. On the contrary, if the EMA lines converge, you can assume that the momentum is weakening.
The histogram is often the quickest hint to look at. When the bars expand (the distance between the signal line and MACD increases), there is accelerating momentum. And when it contracts, momentum is cooling, or even reversing.
Example:
A stock trades near ₹500. Buyers push it up to ₹512.
Because price is rising quickly, the 12 EMA climbs faster than the 26 EMA, increasing the gap between them. This makes the MACD line rise, and the histogram shows taller green bars, which means momentum is getting stronger.
Now take the opposite scenario.
From ₹512, the stock falls to ₹505. The 12 EMA slows down and moves closer to the 26 EMA. The MACD line flattens, and the green bars shrink, signalling that momentum is weakening. If the bars turn red, it shows bearish momentum building.
MACD strategy: How to use it?
A strategy is made up of setups and rules. Setups are technical positions that one must look out for, and rules that tell you what to do, when.
Most traders use a small set of MACD setups that clearly highlight when momentum is building or fading. These make it easier to spot reliable entry and exit points in fast-moving markets.
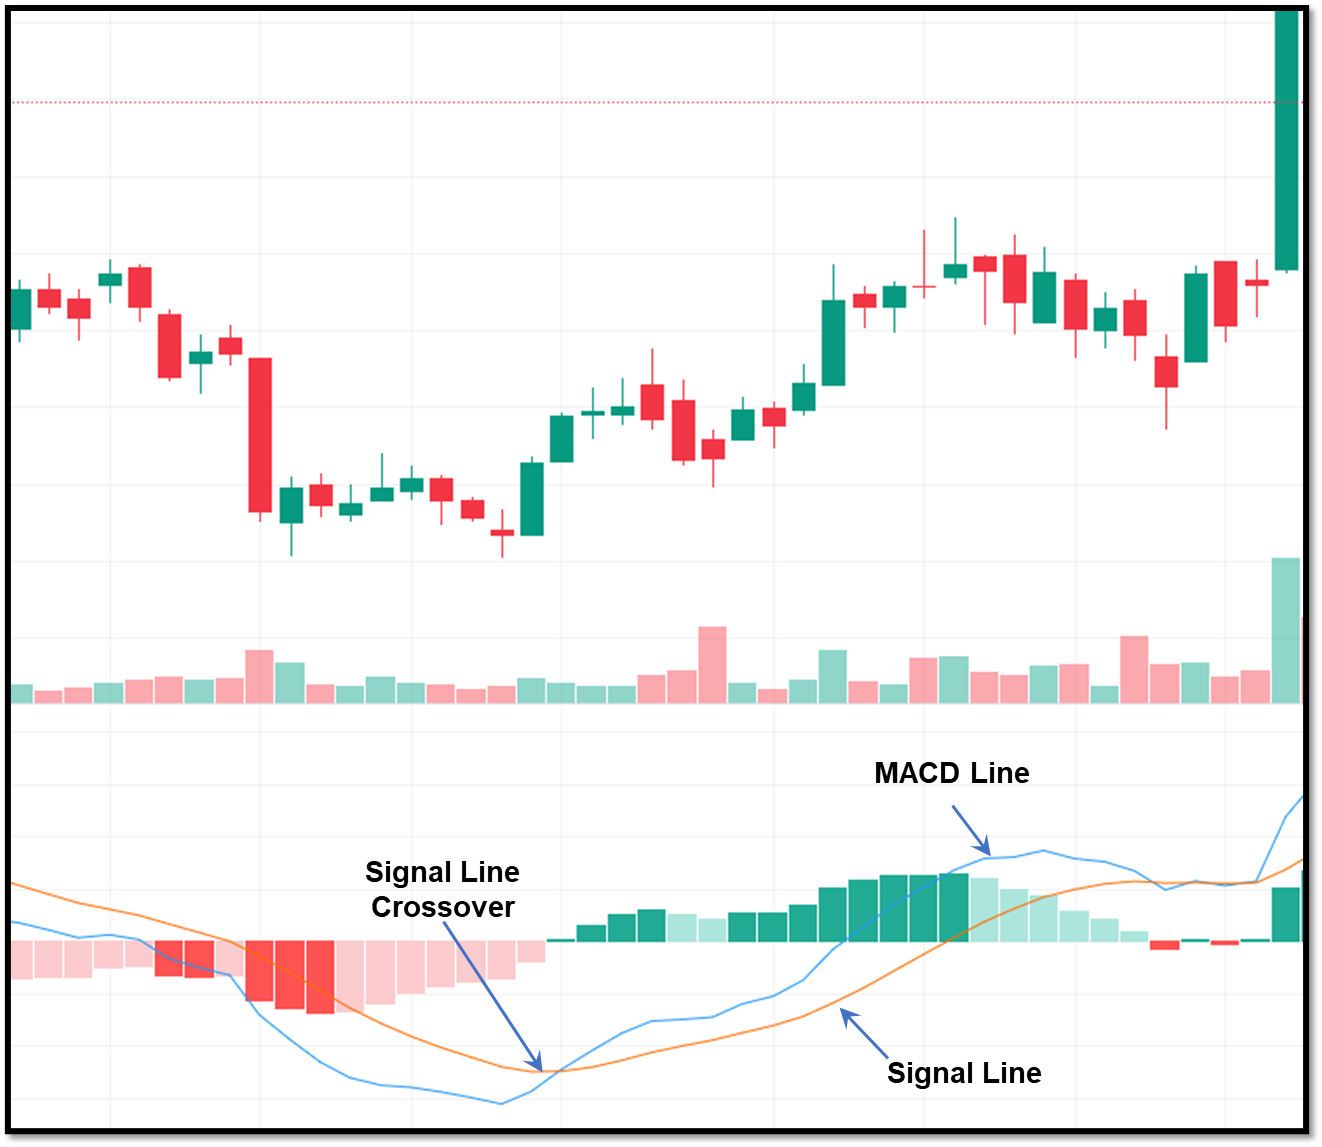
1. Signal Line Crossovers
Simplicity itself, when the MACD line moves above the signal line, traders consider it a bullish crossover, the start of a bullish phase. When the MACD line moves below the signal line, traders consider it the start of a bearish phase, a bearish crossover.
But in a sideways market, this could happen too often, in which case traders often apply a 20 EMA trend filter for long trades to reduce false signals.
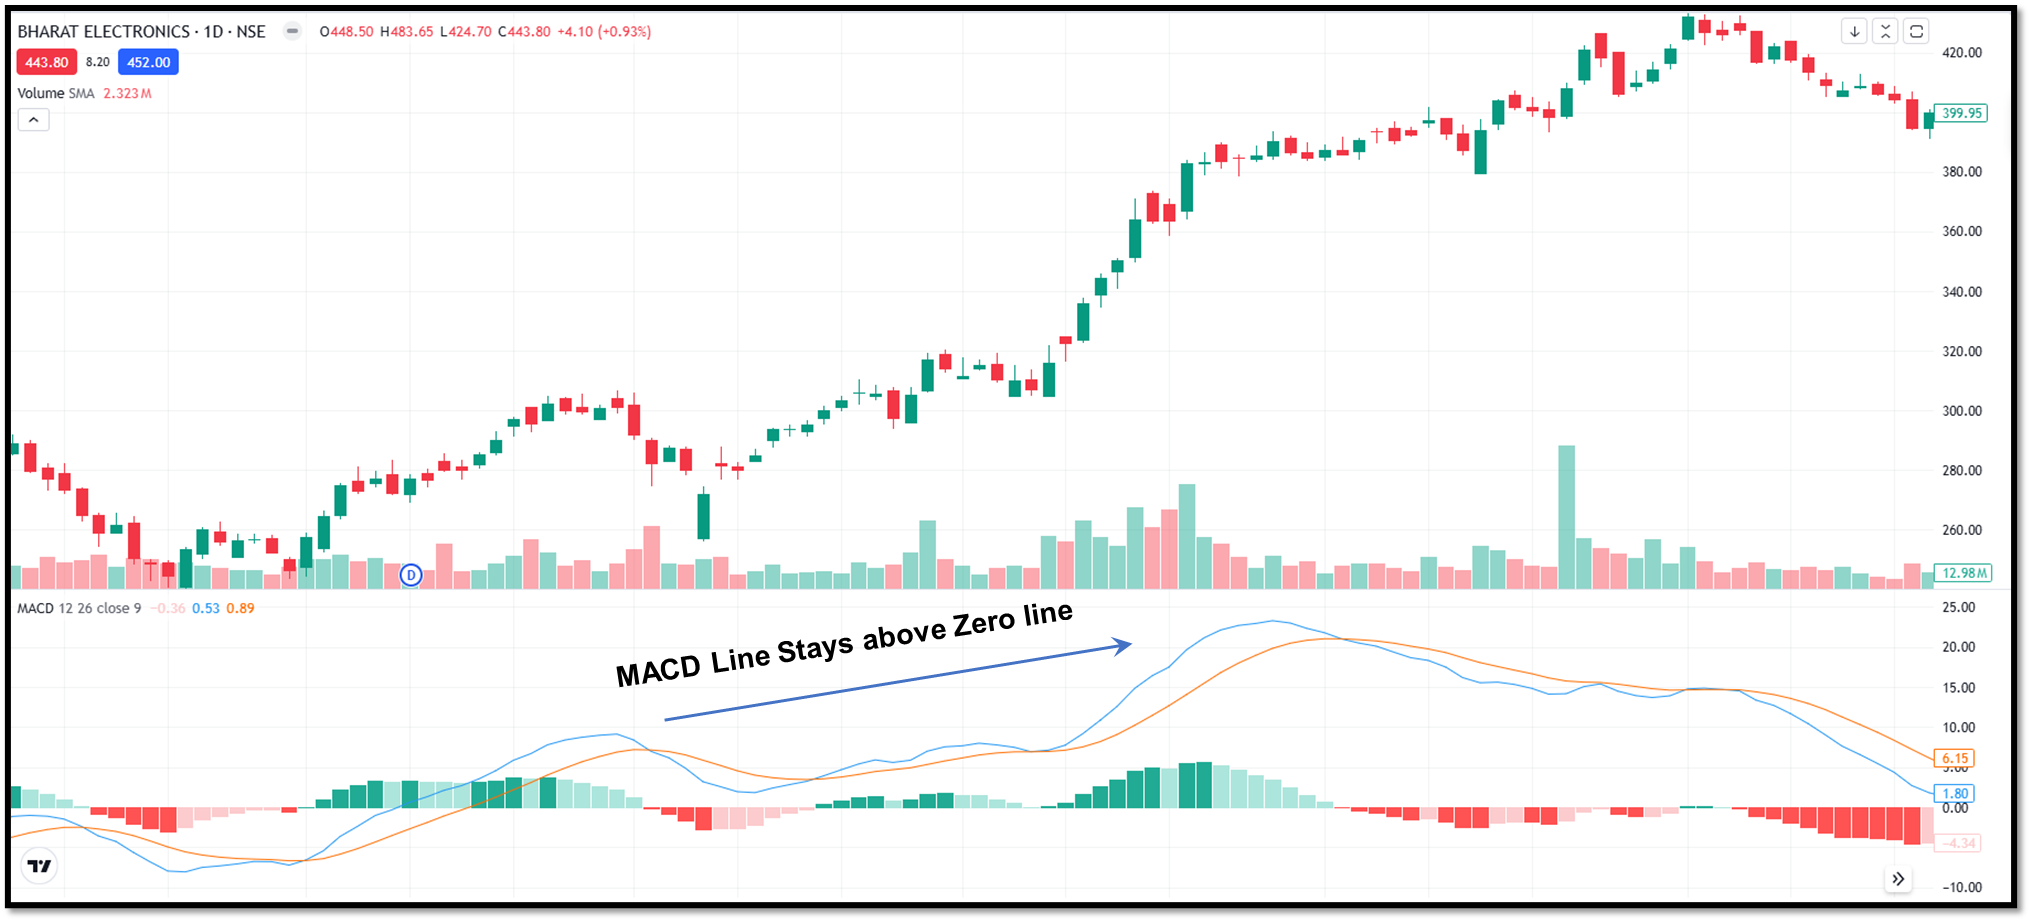
2. Zero Line Crossovers
When the MACD line crosses zero, it means that the shorter EMA has moved above the longer EMA, indicating strength in medium-term momentum. Dropping below zero confirms weakening momentum. Traders use this more as a trend confirmation tool than an entry point.
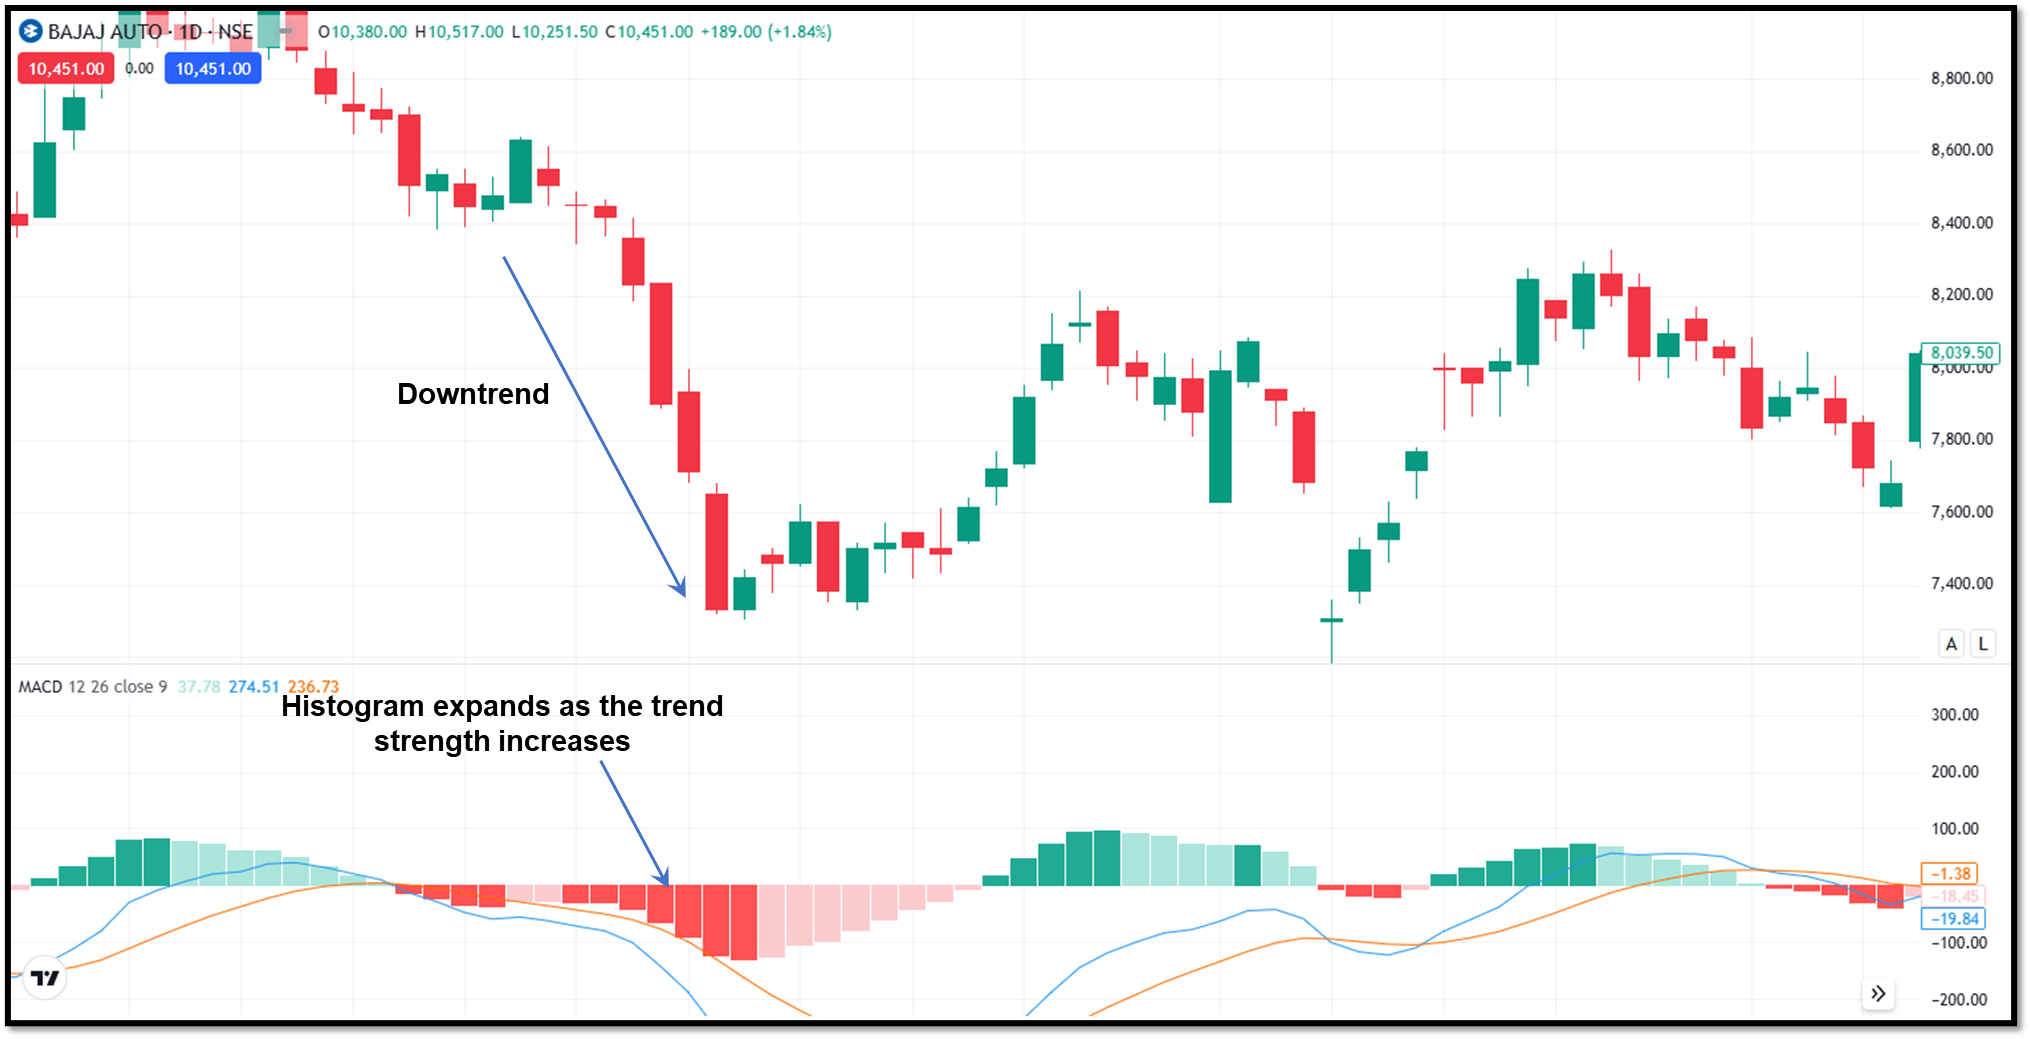
3. Histogram Expansion
When the histogram grows in height after turning positive, bullish momentum is increasing. As it grows deeper below zero, bearish momentum is strengthening. This structure reveals itself sooner than the crossover, which is why it is popular with traders.
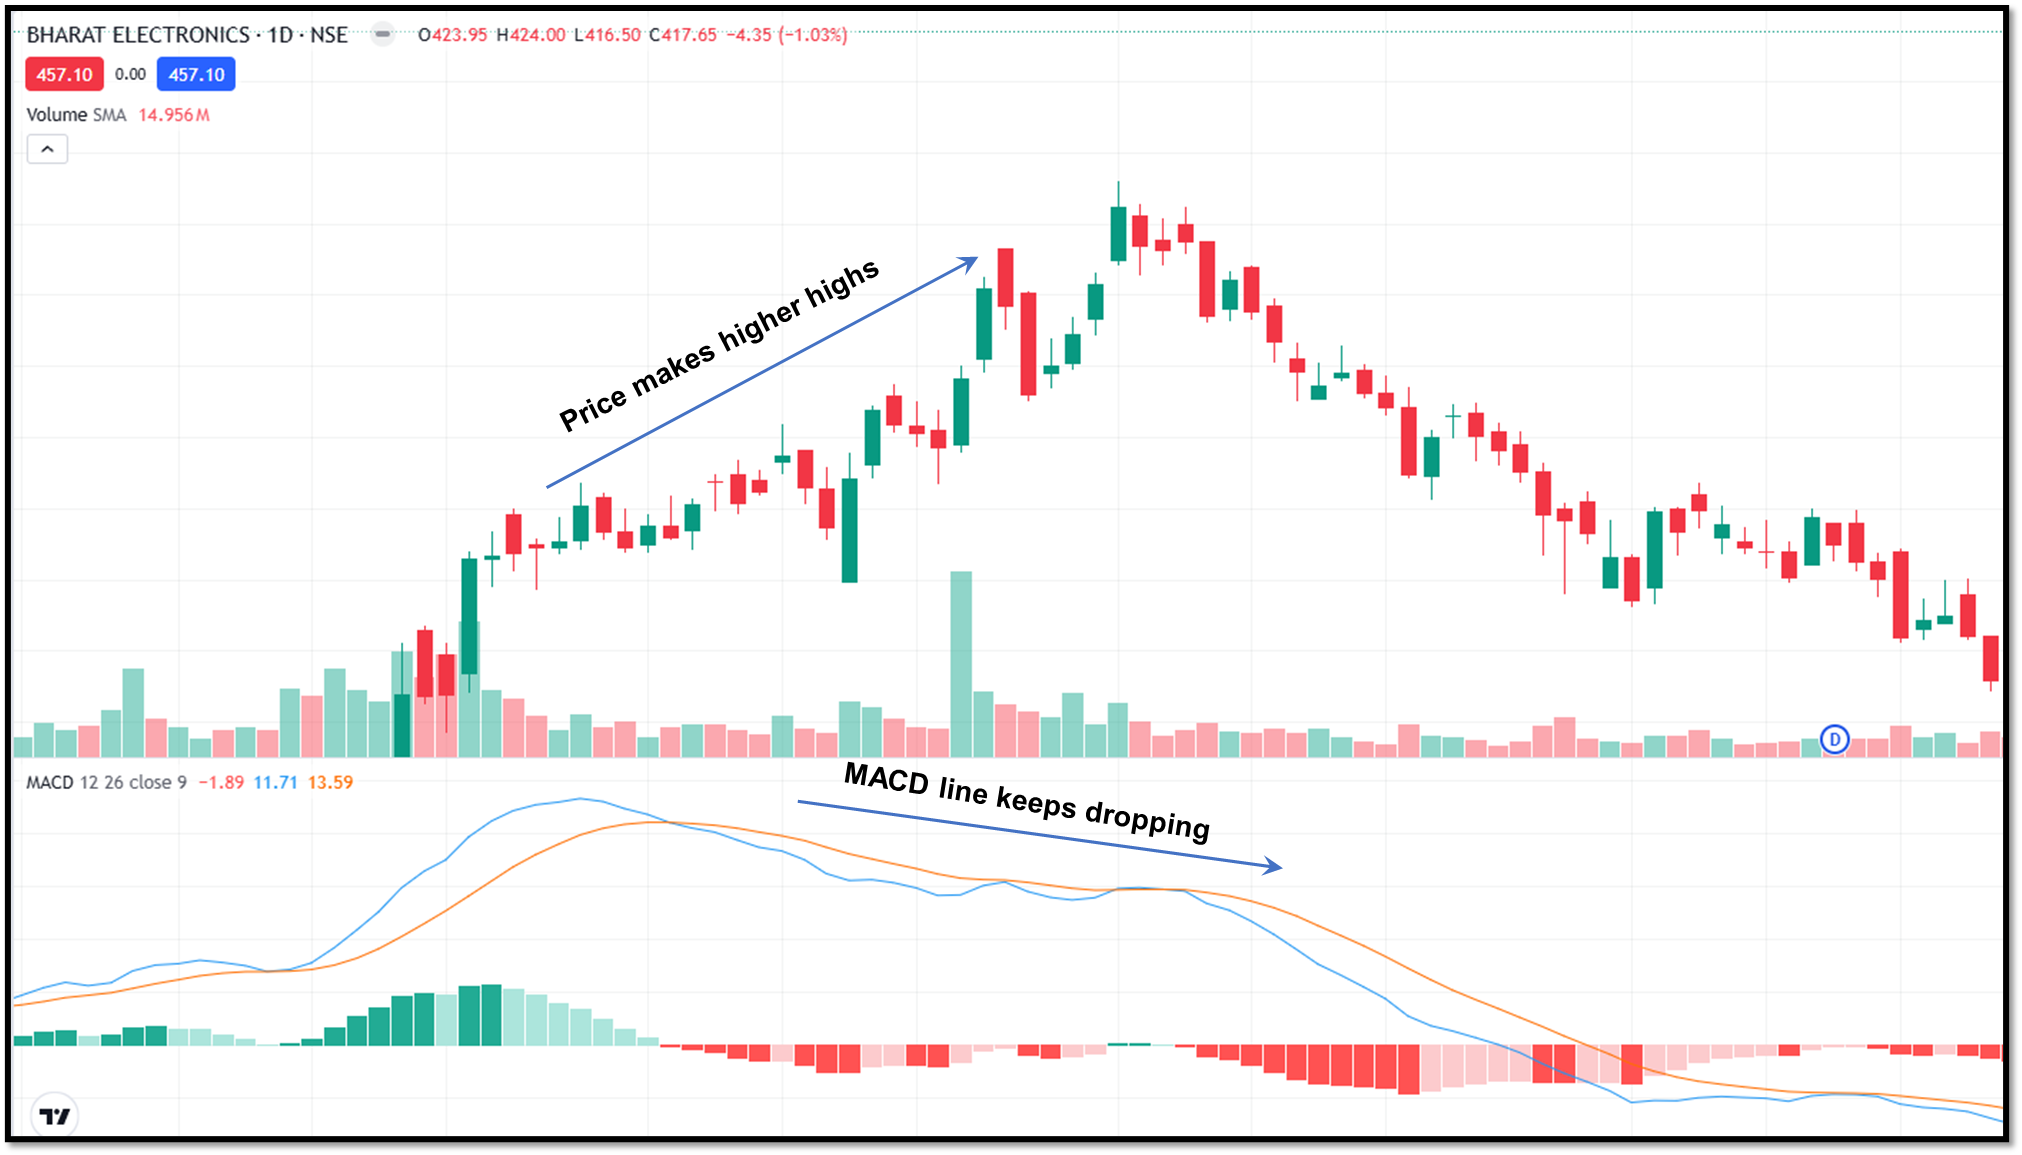
4. Divergence
If price makes a higher peak than its last, but the MACD does not, that could be a sign of weakening momentum. This works best on longer time frames and is used as an early warning sign. This is where some traders can make their exits, while some can set up tighter stops.
What are the simple rules traders can follow?
Much like any other strategy, the MACD strategy only works with disciplined execution. So, here are the rules:
For Entry:
- Price trades above the 20 EMA for a long setup
- MACD line crosses above the signal line
- Histogram turns positive and expands for at least two bars
- Volume is above recent average
For Exit
- MACD crosses back below the signal line
- Price closes below the 20 EMA
- Histogram shrinks for three consecutive bars
Using Stop Loss
Place a stop loss at the most recent point that the price fell back to, before rising upward. Also, be sensible with the amount of capital you invest in momentum trading; most traders use only 1-2% of their capital per trade.
This framework is for educational purposes only. Traders should adapt rules to their own risk tolerance and market conditions.
Example to understand these rules
Imagine a stock trending upward and trading near ₹480. It stays above the 20 EMA, which is your first sign that a long setup may form. A few candles later, the MACD line moves above the signal line, and the histogram turns positive with two growing green bars. Volume is also slightly higher than average. This meets all the entry rules, so a long trade can be taken.
You place a stop loss near ₹472, which is the most recent “swing low” the price pulled back to before moving upward.
Over the next several candles, the stock climbs to ₹495. After that move, the histogram starts shrinking, and the MACD flattens, finally crossing below the signal line. At the same time, the price closes below the 20 EMA. These are your three exit signals, so the trade is closed with a gain.
Strengths and limitations of the MACD strategy
Here are the strengths and weaknesses of the MACD strategy.
Strengths
- The biggest strength of the MACD strategy is that it shows momentum clearly. Because it’s built from two EMAs, the momentum signal is stronger when compared to a single EMA.
- MACD adapts well to different timeframes, as intraday traders can use it on 5-minute and 15-minute charts.
- For rule-based traders, the signals are clear and repeatable, complementing their style of trading.
- MACD pairs well with other indicators such as the Relative Strength Index (RSI) or price structure.
Limitations
- In a sideways market, you need other tools such as price structure, volume, longer EMAs, etc., to help with its reliability.
- Since MACD is built from moving averages, it responds after the price has already turned. This slight delay can get in the way of quick trades, especially during increased volatility.
On the Dhan platform, you can use all these technical indicators using TradingView Charts and more to build your own trading strategy, so you can stay reliably ahead of the market.
To sum up
A structured MACD momentum trading framework can help beginners capture clear trends. In choppy times, it can be combined with other indicators to help improve its accuracy. However, always use stop loss and position size to minimise risk.
FAQs
Which MACD settings are best for momentum trading?
Most traders use 12-, 26-, and 9-day EMAs since they balance recency with long-term stability. Some may even use the 8-, 17-, and 9-day EMAs for even quicker signals, though you must know that the quicker the signals get, the noisier they are.
Does MACD work for intraday trading?
Yes, MACD is used for intraday trading, primarily on the 5-, 15- and 30-minute charts.
Is MACD reliable on its own?
It can be used alone, but it works better with trend filters like the 20-EMA or a higher time frame confirmation.
Should MACD be used during sideways markets?
In sideways markets, when volatility and mixed signals are particularly high, MACD does lose its accuracy. Most traders would either reduce their exposure or simply wait it out until there’s clear momentum.