Reversal Trading: How to spot and trade reversals




Reversal trading is a method used by traders to identify points where the market trend is about to change direction.
Instead of following the existing momentum, reversal traders look for signals that suggest prices may soon move the opposite way. These turning points often bring strong opportunities with lower risk if spotted correctly.
However, identifying real reversals can be tricky, as false signals are common. Learning to read charts, patterns, and volume changes helps in building better judgment.
In this article, we will explore how to spot and trade reversals with clarity and confidence.
Understanding trend vs. reversal
A trend is when prices move consistently in one direction (either upward or downward), forming a clear pattern of higher highs and higher lows in an uptrend, or lower highs and lower lows in a downtrend.
On the other hand, a reversal marks the point where that direction changes. It happens when momentum fades, and buyers or sellers lose control, so the market shifts and begins a new trend in the opposite direction.
Knowing the difference is crucial: a pullback inside a trend will usually resume the original path, while a true reversal signals a new phase.
Traders must spot signs that momentum is fading before betting on the change.
Key signals & techniques to spot reversals
When trying to identify a true reversal (not just a pullback), traders look for signs that the momentum is shifting, the trend is weakening, and the market may change direction. Below are practical, well‑tested methods to spot reversals. Use several signals together (confluence) to reduce false alerts.
1. Price action & candlestick signals
Price action and candlestick clues help traders spot when a trend might reverse. Each candle shows open, high, low, and close for a period. When you see certain formations near trend extremes, those may hint at change.
For example:
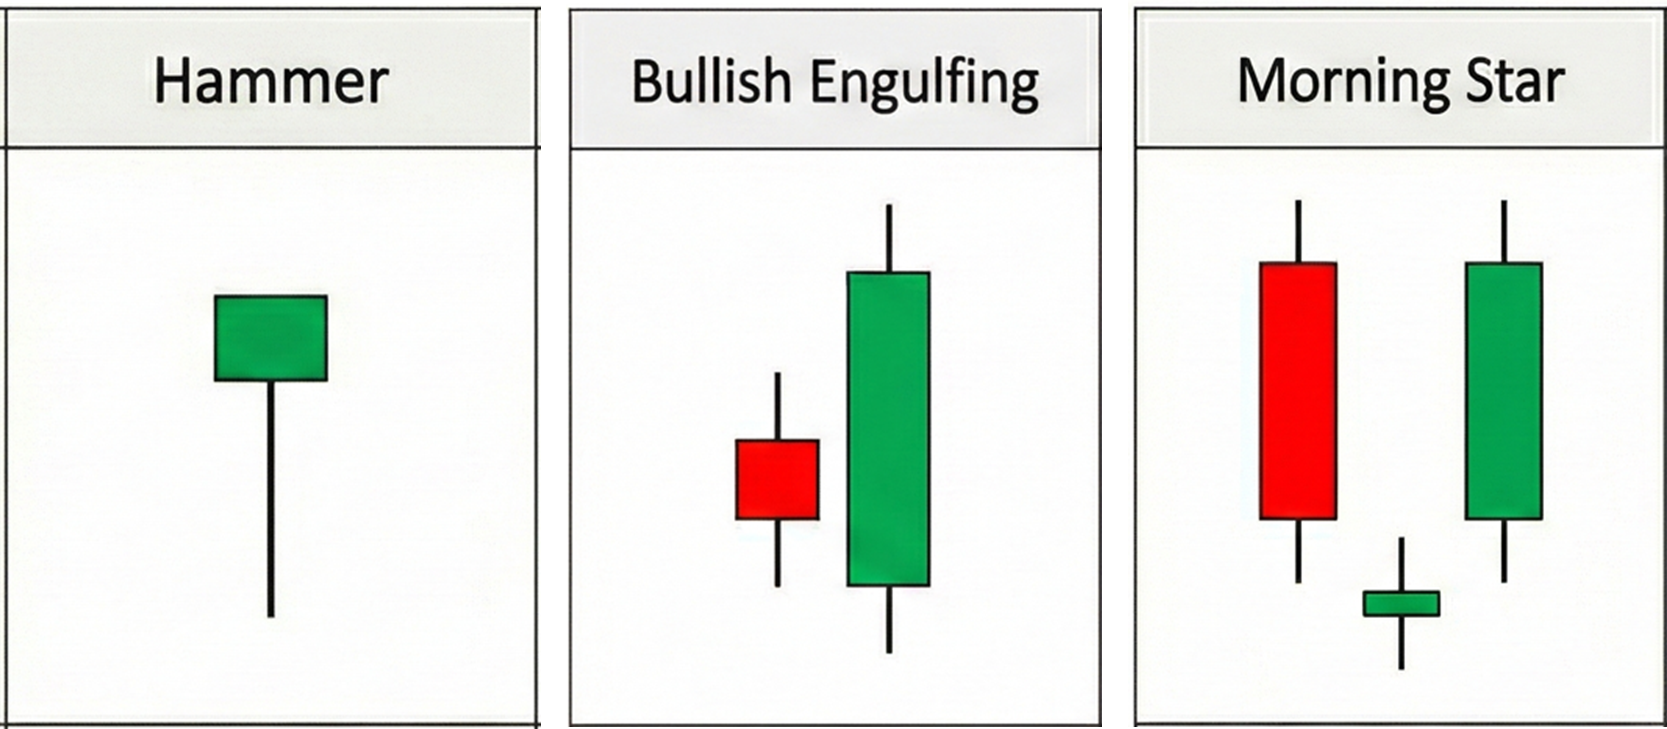
- A hammer has a long lower wick and small body, meaning sellers pushed price down but buyers bounced it up, suggesting exhaustion of selling.
- An engulfing pattern has one candle whose body fully contains the previous candle’s body, showing a strong shift of control.
- A morning star is three candles: a bearish one, then a small indecision bar, then a bullish one, often signalling a bottom turning upward.
Patterns by themselves are not enough. They need confirmation via volume, support levels, or follow-through movement.
2. Chart patterns & structural breaks
Chart patterns help traders recognise when a trend may end and reverse. In a reversal trading strategy, common patterns include double tops and bottoms, and head and shoulders or inverse head and shoulders. There are also many ready-made strategies you can use on Dhan to make trading easy and quick.
For example, a double top forms when the price climbs, pulls back, then climbs again but fails to break the first high. When price breaks below the mid-level (neckline), it often signals a trend reversal.
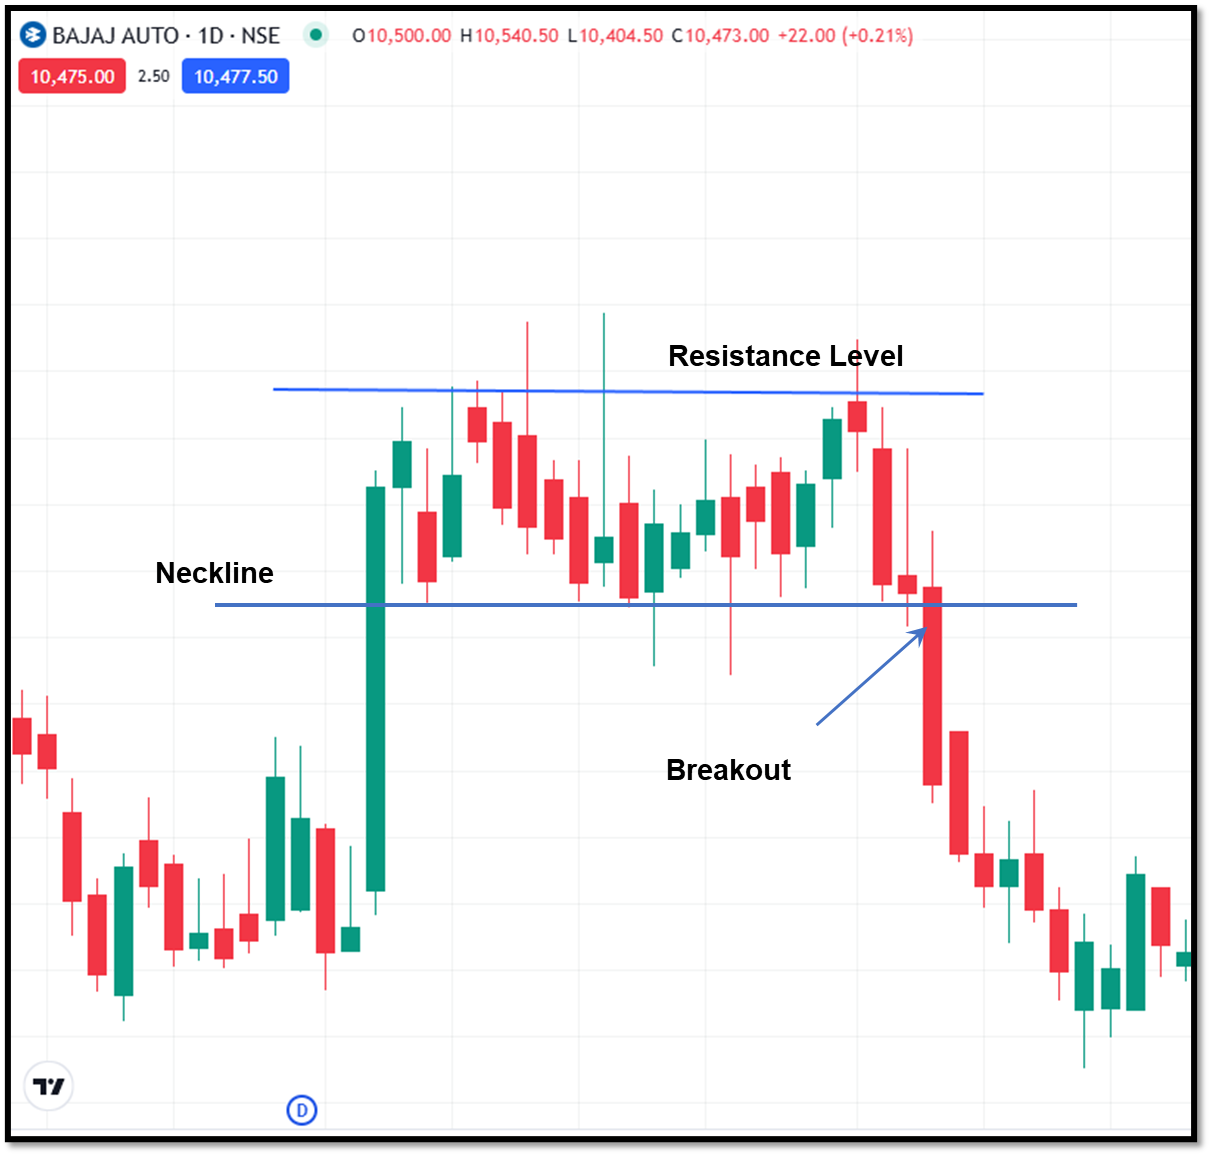
Similarly, the head and shoulders pattern has three peaks where the middle one is the highest, and a break below the neckline confirms the reversal.
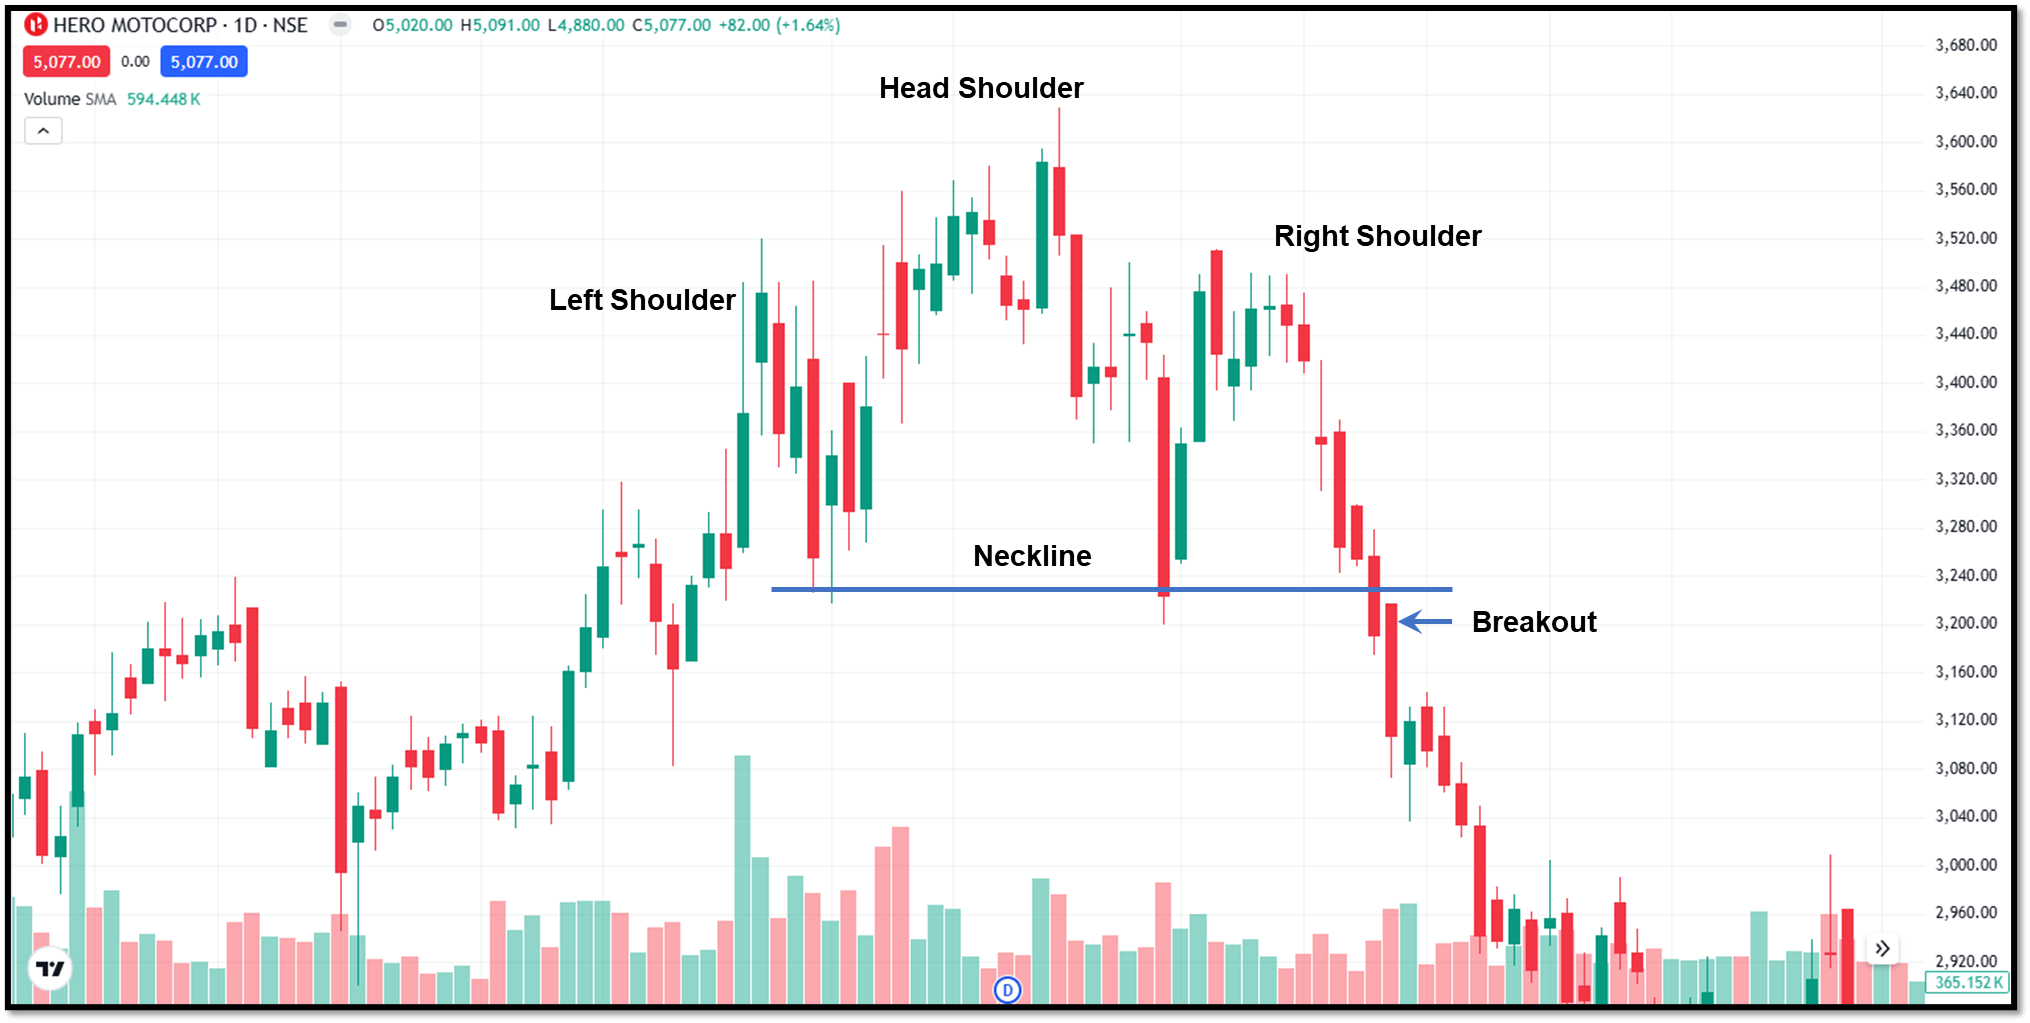
A trendline break followed by a retest gives a cleaner structural confirmation.
📊 With Dhan’s built-in TradingView charts, you can spot reversals, draw patterns, and analyze markets with professional-grade precision without switching tabs.
3. Momentum indicators & divergence
Momentum indicators show how strong a trend is. Divergence happens when price moves one way but the indicator moves differently, signalling that momentum is fading.
For example, in an uptrend, the price may push to a new high, but the MACD or RSI fails to reach a corresponding high. That is bearish divergence, hinting that buyers are weakening.
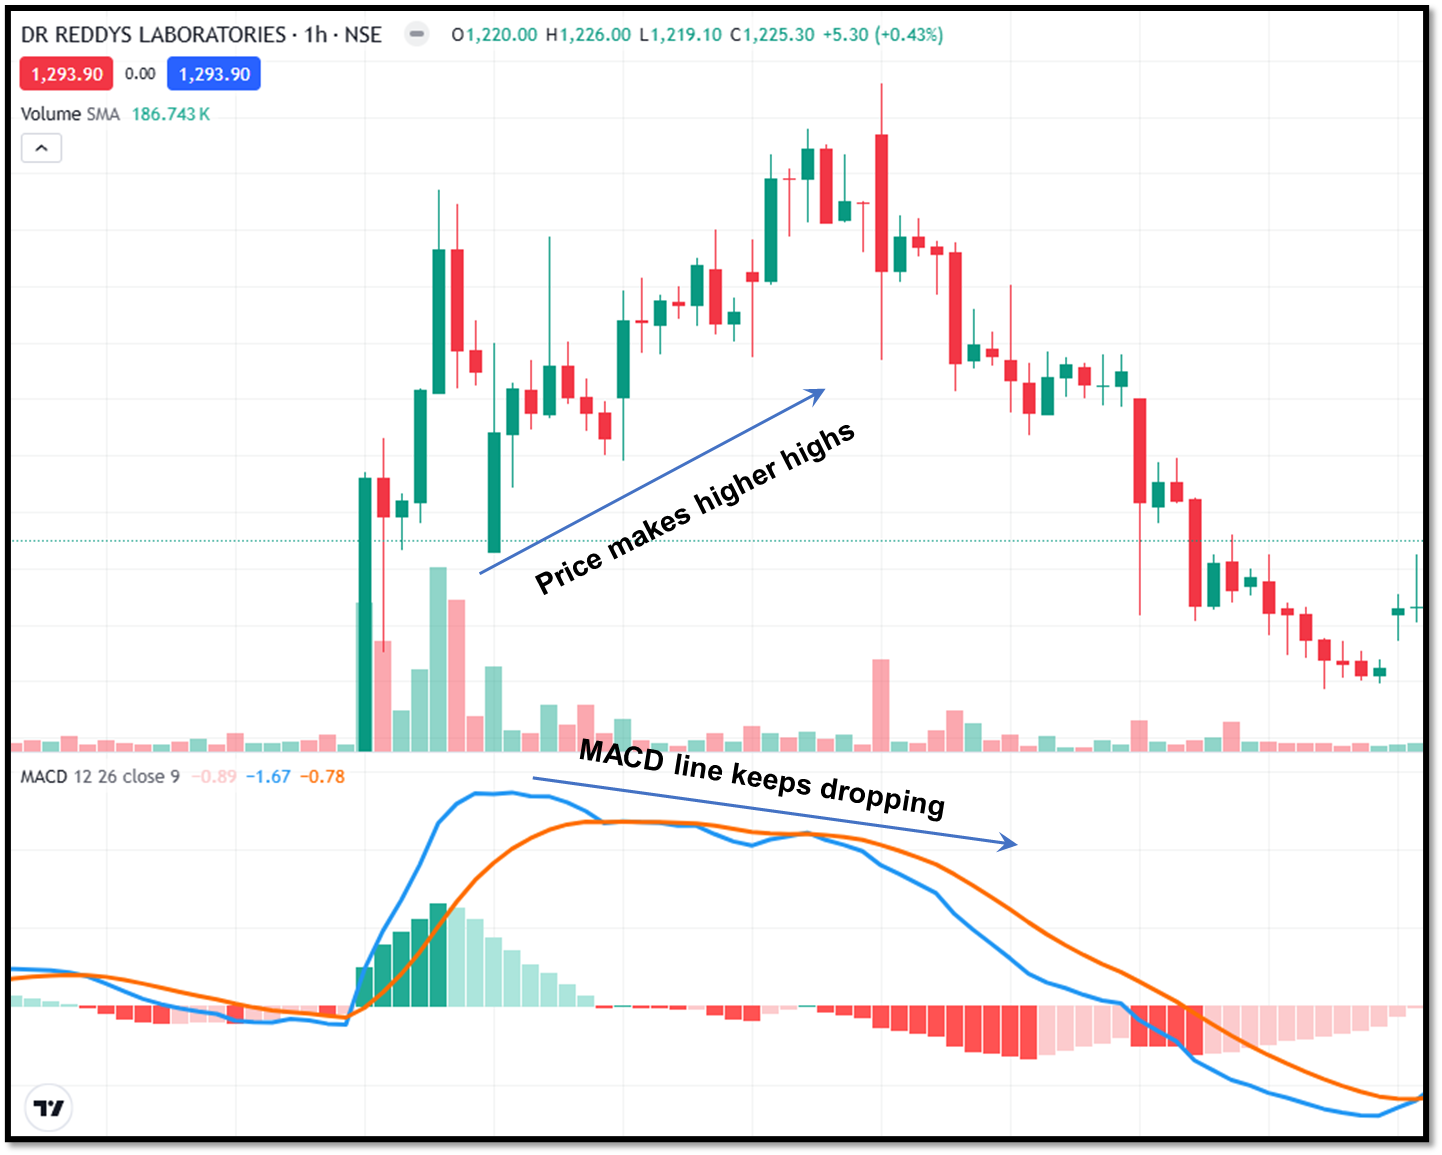
On the flip side, in a downtrend, the price might make a new low, while the indicator forms a higher low. That is bullish divergence, suggesting sellers are losing strength.
Such mismatches are early warnings (not guarantees) that a reversal could be forming.
4. Volume & participation signals
Volume measures how many units (shares, contracts) change hands in a given period. When price moves but volume is low, it suggests weak conviction behind that move. For example, if price pushes higher but volume declines, fewer buyers support the rise, which warns that a reversal may be near.
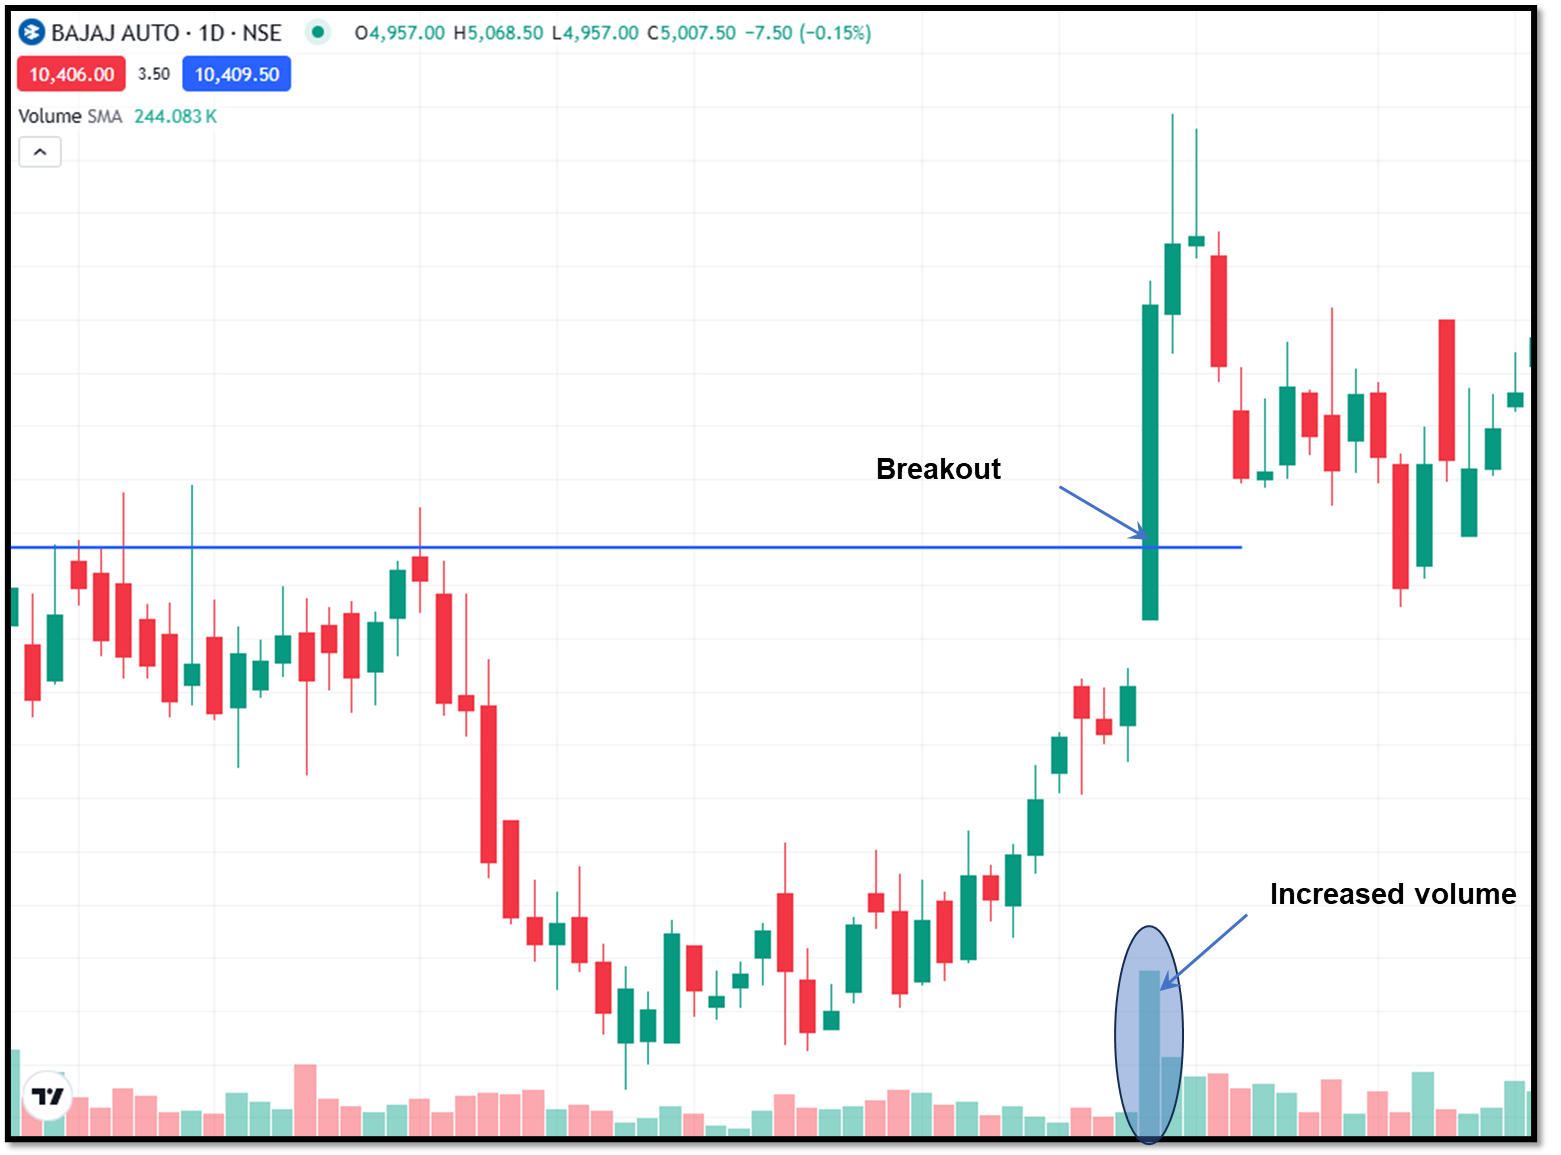
On the other hand, a sudden spike in volume against the trend (for example, heavy buying in a downtrend) may mark capitulation or “turning point” activity.
In short, matching strong volume with reversal direction gives stronger evidence; mismatched (weak) volume warns of false moves.
5. Support/resistance & key levels
Support is a price area where buyers tend to step in so that the price stops falling and reverses upward. Resistance is where sellers often appear, so that the price stops rising and turns downward.
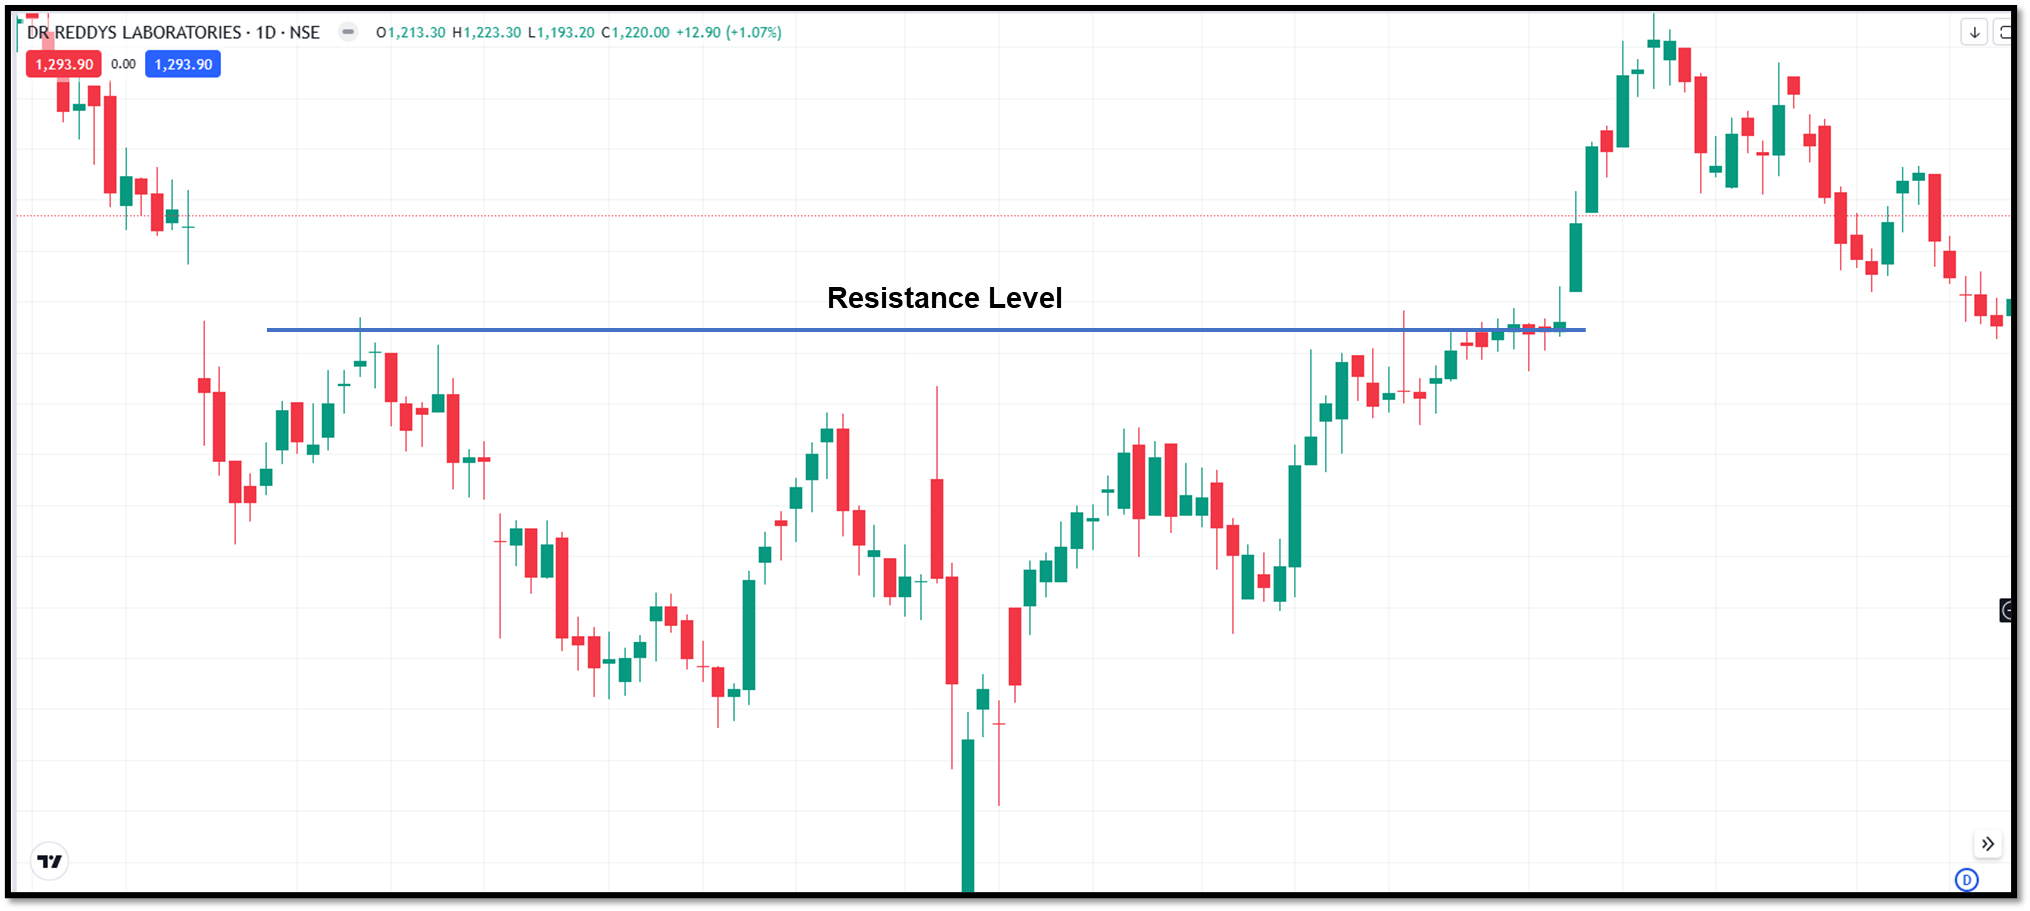
When price breaks below a support zone, that same area can act as resistance when price tries to climb back. Likewise, when the price breaks above a resistance, the broken level may become support on a pullback.
These “role reversals” happen because market psychology shifts: what was once a floor becomes a ceiling, and vice versa.
6. Confluence & multi-timeframe confirmation
When you see a signal (for example, a reversal candlestick, divergence, or trendline break) on a single timeframe, it could be misleading.
Confluence means waiting until that same kind of signal or supporting structure also appears on a higher timeframe. If the higher timeframe and your trading timeframe both point to a reversal at the same price area, your confidence increases.
Combining signals that align across timeframes cuts through the noise and boosts the chances that your reversal setup is reliable.
In short, when clues match across multiple charts, your setup becomes stronger, and weak signals are easier to ignore.
Wrapping up
A reversal trading strategy can lead to strong gains if you spot the shift early, but it takes patience, confirmation, and solid risk control. Focus on price action, wait for clear signs of a change, size your trades wisely, and keep your ego in check. With time, you’ll learn which setups are worth taking.
Frequently asked questions (FAQs)
1. What is reversal trading in simple terms?
Reversal trading means spotting when a stock or asset is likely to change direction. Traders aim to catch the move right as the trend flips from up to down or down to up.
2. How do I know if a trend is truly reversing?
Look for signs like strong volume, candlestick patterns (such as doji or engulfing), or a break of key support or resistance. These can show that momentum is shifting.
3. Is reversal trading risky for beginners?
Yes, it can be. Reversals often look like regular pullbacks. Without confirmation, you might trade too early and get caught in the trend.
4. Which indicators help spot reversals early?
Popular indicators include RSI, MACD, and moving averages. Use them with price action to improve accuracy.
5. Should I trade every reversal I see?
No. Not all reversals are worth trading. Always check for strong confirmation and use stop-loss to manage risk.