



Bearish Harami Pattern








Key takeaways
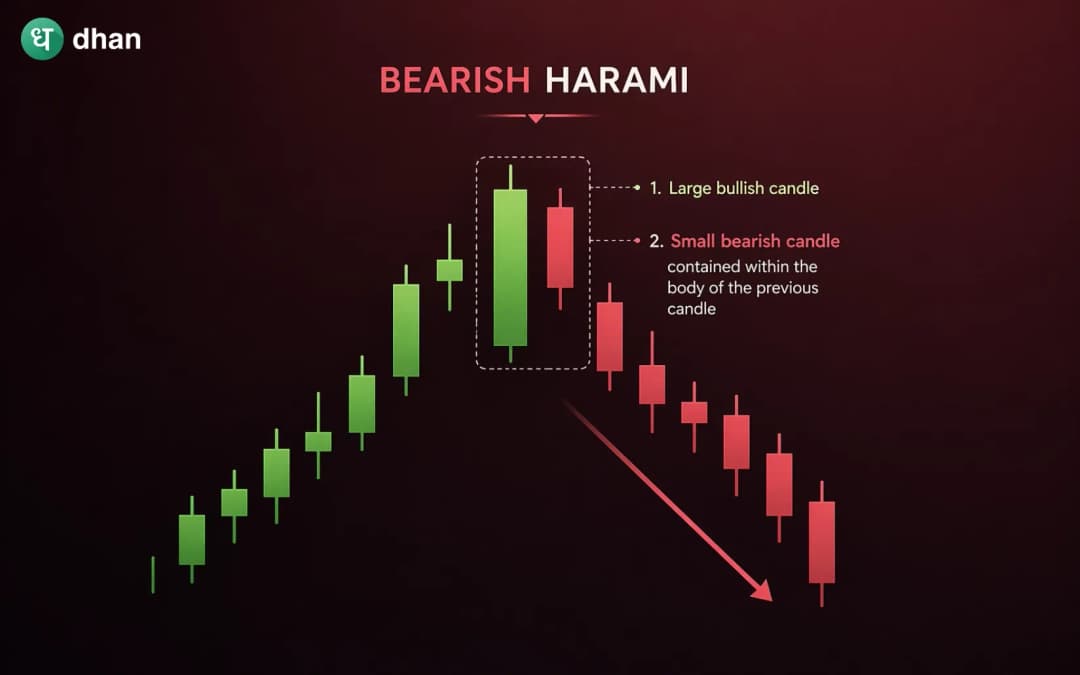
- A bearish harami is a two-candlestick reversal pattern that may signal weakening bullish momentum after an uptrend.
- The pattern forms when a strong bullish candle is followed by a smaller bearish candle that stays within the body of the first candle.
- It signals indecision and possible control shifting from buyers to sellers.
- Confirmation through volume, resistance levels, indicators, or the next candle required, and should not be traded alone.
Candlestick patterns are among the most widely used visual tools in technical analysis because they offer quick insight into market psychology. Some patterns suggest trend continuation, while others hint at possible reversals. One such reversal formation is the bearish harami. The bearish harami looks simple. But behind that simplicity is a shift in momentum that many traders watch closely.
The bearish harami pattern usually appears at the end of a bullish trend. It shows hesitation and reduced buying pressure. It suggests sellers may be starting to push back.
Well, no candlestick pattern guarantees a reversal. A bearish harami pattern signals a potential reversal. Understanding what it means, when it matters, and how traders typically use it can help avoid poor decisions.
What is a Bearish Harami Pattern?
A bearish harami is a two-candle bearish reversal candlestick pattern that typically appears after an upward price move.
The word harami comes from a Japanese term meaning “pregnant,” which makes sense visually. The first candle is larger, while the second, smaller candle sits inside the body of the first, almost like being enclosed within it.
For a standard bearish harami:
- The first candle is a strong bullish candle
- The second candle is a smaller bearish candle
- The second candle’s body remains fully inside the body of the first candle
- The pattern generally forms after an uptrend or noticeable bullish momentum
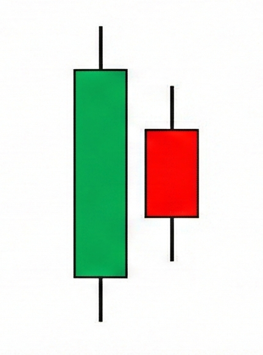
This structure suggests that bullish momentum may be losing strength.
Structure of the Bearish Harami Pattern
The first candle reflects buyer control. This is usually a large bullish candle showing aggressive upward movement. Buyers push price higher with confidence, reinforcing the existing bullish trend.
The second candle is a smaller bearish candle which is contained within the first candle’s body.
This suggests:
- Reduced bullish conviction
- Market hesitation
- Possible seller participation
- Momentum slowing
The size of the second candle matters as it shows the weakness in upward momentum. It must be smaller than the previous and must be contained within its body.
What does a Bearish Harami indicate?
A bearish harami shows a potential shift in market sentiment. It does not mean the market will reverse sharply, but it represents a possibility. Also, it suggests that the upward move may be losing energy, and buyers may be exhausted.
The bearish harami may also indicate:
- The profit booking might be starting
- Sellers may be testing control
- Momentum may be weakening before a pullback
Market psychology behind the Bearish Harami
Candlestick patterns become more useful when you understand the psychology behind them.
After an uptrend, traders feel optimistic, and the strong bullish candles reinforce the belief that the price will continue higher. Momentum traders may keep entering long positions.
The next session changes the tone. Instead of another confident rally, the price fails to expand upward meaningfully. This creates uncertainty. Buyers who expected continuation may become cautious. If the following candles move lower, trapped buyers may begin exiting. Also, short sellers may step in, and this combination can accelerate downside movement.
Characteristics of Bearish Harami
To identify the pattern, you must know its key characteristics.
- The bearish harami formation is only valid if it appears after a prolonged bullish move. It may appear in the sideways market, but the pattern loses its relevance in such conditions.
- The first candle must be a large bullish candle, which can show a strong bullish move. Tiny or weak candles reduce reliability.
- The second candle’s real body must fit within the first candle’s real body. The shadows (wicks) may extend beyond, depending on interpretation, but the body relationship is the core rule.
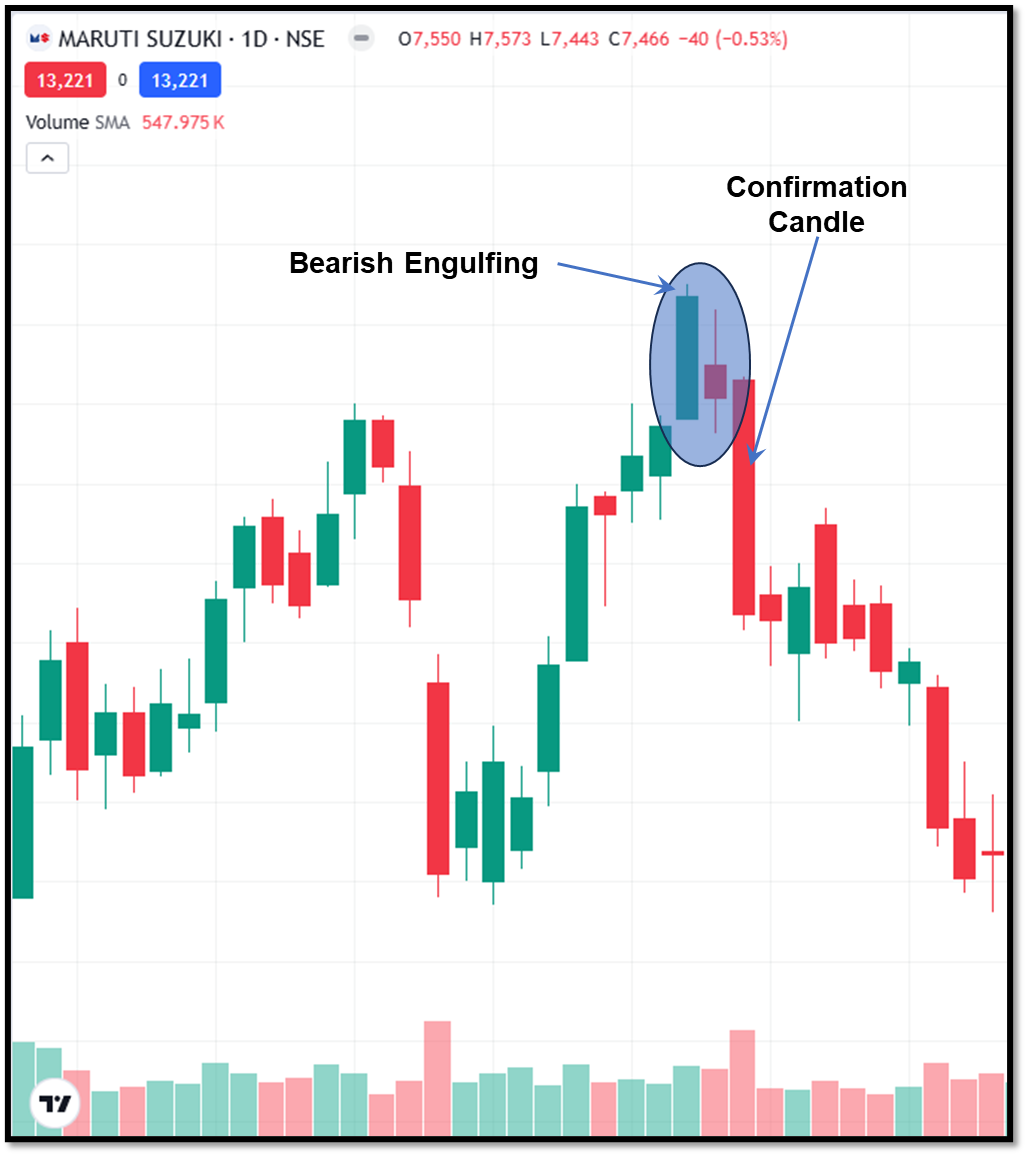
- The pattern must be confirmed by a strong bearish candle afterwards. Confirmation is also valid if the price breaks below nearby support and volume increases.
When is the Bearish Harami more reliable?
There are certain conditions when the bearish harami is quite reliable. These conditions are explained below:
Near resistance levels
If a bearish harami forms close to a key resistance zone, the pattern becomes more effective as sellers may naturally defend that level.
During overbought conditions
If momentum indicators suggest the market is stretched, reversal patterns usually become more relevant. Like, RSI above overbought levels, momentum divergence, and extended vertical price rallies.
Higher timeframes
If the pattern appears on the higher timeframe, like 4-hour, daily or weekly, then it is more reliable than the one appearing on the lower timeframe.
Rising volume on reversal confirmation
If volume expands after the pattern, it may indicate real participation from sellers.
How traders use Bearish Harami?
Different traders use different approaches with the bearish harami pattern.
Conservative approach
Some traders wait for confirmation before entering the trade. This approach is for safe players who want to gain a profit but also be cautious.
Example:
- Bearish harami forms
- Next candle closes lower
- Support breaks
- Entry is considered after confirmation
This reduces premature entries.
Aggressive approach
Some traders enter earlier, anticipating a reversal immediately after the pattern.
Its potential benefit is that it offers a better entry price. But the risk of this approach is significantly high, as the pattern may convert into a false signal.
Advantages of Bearish Harami
The bullish harami pattern has the following advantages:
- A bearish harami can signal that bullish momentum is weakening before a clearer reversal develops. This gives traders time to reassess long positions or prepare for potential bearish setups.
- Bearish harami patterns can be useful in stocks, forex, commodities, indices, and crypto markets.
- The pattern becomes more useful when combined with tools like RSI, resistance levels, volume, or moving averages.
- Volume can enhance interpretation. If volume expands after the pattern, it may indicate real participation from sellers.
Limitations of Bearish Harami
Although the bullish harami has several advantages, it has some limitations as well:
- The false reversals are the primary limitation of the bullish harami pattern. Many times, the market just pauses a little before continuing. A bearish harami may simply reflect temporary hesitation.
- The bearish harami is considered a weak standalone signal. With other supporting indicators or signals, the pattern does not work effectively.
- Technical setups can fail instantly during earnings announcements, macro events, or sudden sentiment shifts.
Conclusion
The bearish harami is a two-candlestick bearish reversal pattern which which represents a weakness in the market. But the pattern works best as part of a broader technical framework rather than a standalone trade trigger.
The pattern represents hesitation, reduced buyer conviction and the possibility of shifting control towards sellers. If the pattern appears near a key resistance level and is supported by volume participation, it will increase the probability of reversal.
FAQs
Is bearish harami a strong reversal pattern?
No. the bearish harami is generally considered a moderate warning signal instead of a highly aggressive reversal pattern. If other indicators also support the pattern, its reliability increases.
What timeframe is best for bearish harami?
Many traders consider higher timeframes like 4-hour, daily, or weekly charts more reliable than very short intraday charts.
Can beginners trade bearish harami?
Yes, but it is advised to be used with confirmation tools and clear risk management instead of being a signal in itself.
Is bearish harami suitable for intraday trading?
Yes, traders can use it in intraday trading, but signals on very short timeframes may be less reliable due to market noise. Many traders prefer combining it with confirmation indicators for better accuracy.
What is the difference between bearish harami and bearish engulfing?
A bearish harami shows weakening bullish momentum through a smaller candle inside the previous bullish candle’s body. A bearish engulfing pattern is generally stronger because the bearish candle completely overpowers the previous bullish candle.







