



45 Best Candlestick Patterns for Every Trader









Key takeaways
- Candlestick patterns reflect trader psychology in real time and help traders identify market direction.
- Reversal patterns are most effective when there is a clear shift in control, showing that selling pressure is fading and buyers are stepping in aggressively, or vice versa.
- Continuation setups can be powerful because they show that a pause in price is often just a breather, not a change in trend.
- A pattern is much more useful when it appears near support, resistance, or with strong volume.
For centuries, traders have been using candlestick patterns, and even in 2026, when AI trading and algorithmic trading are driving the markets, they remain one of the most reliable tools for understanding market psychology. Also, traders can rely on candlestick patterns in almost all types of markets, like stocks, forex, and commodities.
In technical analysis, candlestick patterns help traders to understand market sentiment, such as hesitation, fear, or confidence. When candlestick patterns are used with trend, volume, and key levels, they offer strong confirmation signals.
Let’s break down the top 45 candlestick patterns every trader must know in 2026.
Candlestick Patterns every trader must know
There are various types of candlestick patterns that traders use to interpret the market conditions. Below are the 45 best candlestick patterns with expanded explanations to help you understand how they work in real trading conditions.
1. Hammer
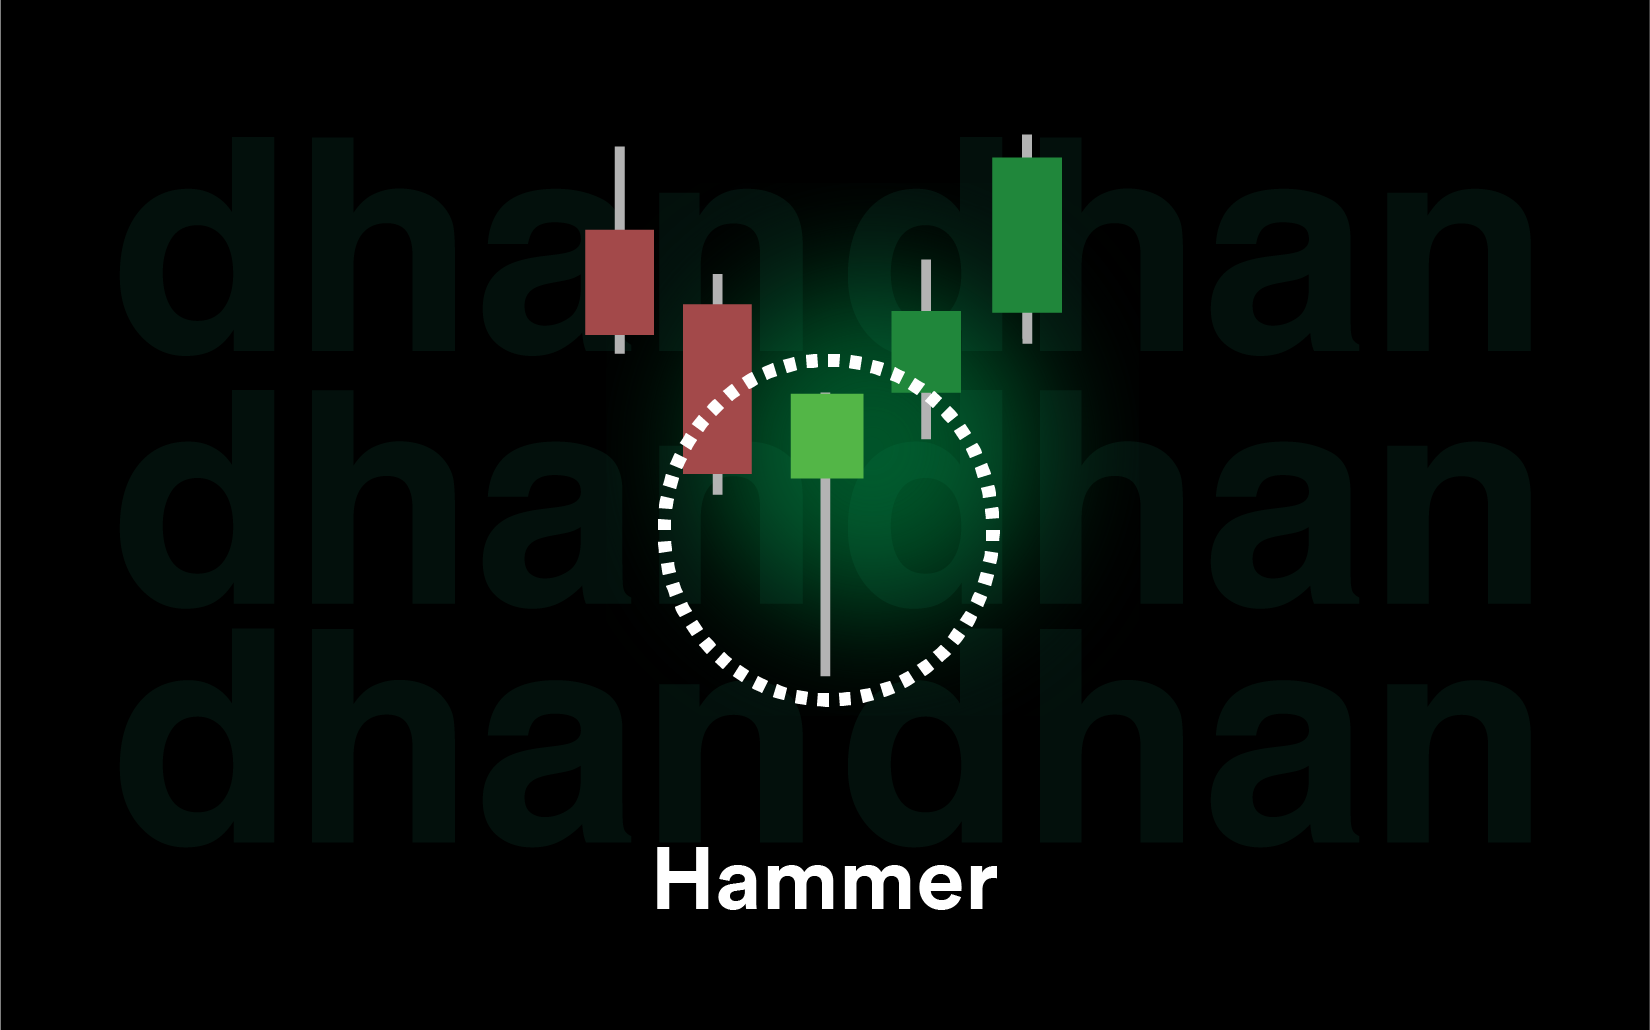
Hammer candlestick pattern is a single pattern that appears after a downtrend. It has a small body and a long lower shadow. It shows that the sellers tried to push the price lower, but buyers took over and drove it back up before the close. It is considered as a powerful signal when it develops around the levels of support along with increased volume.
2. Inverted Hammer
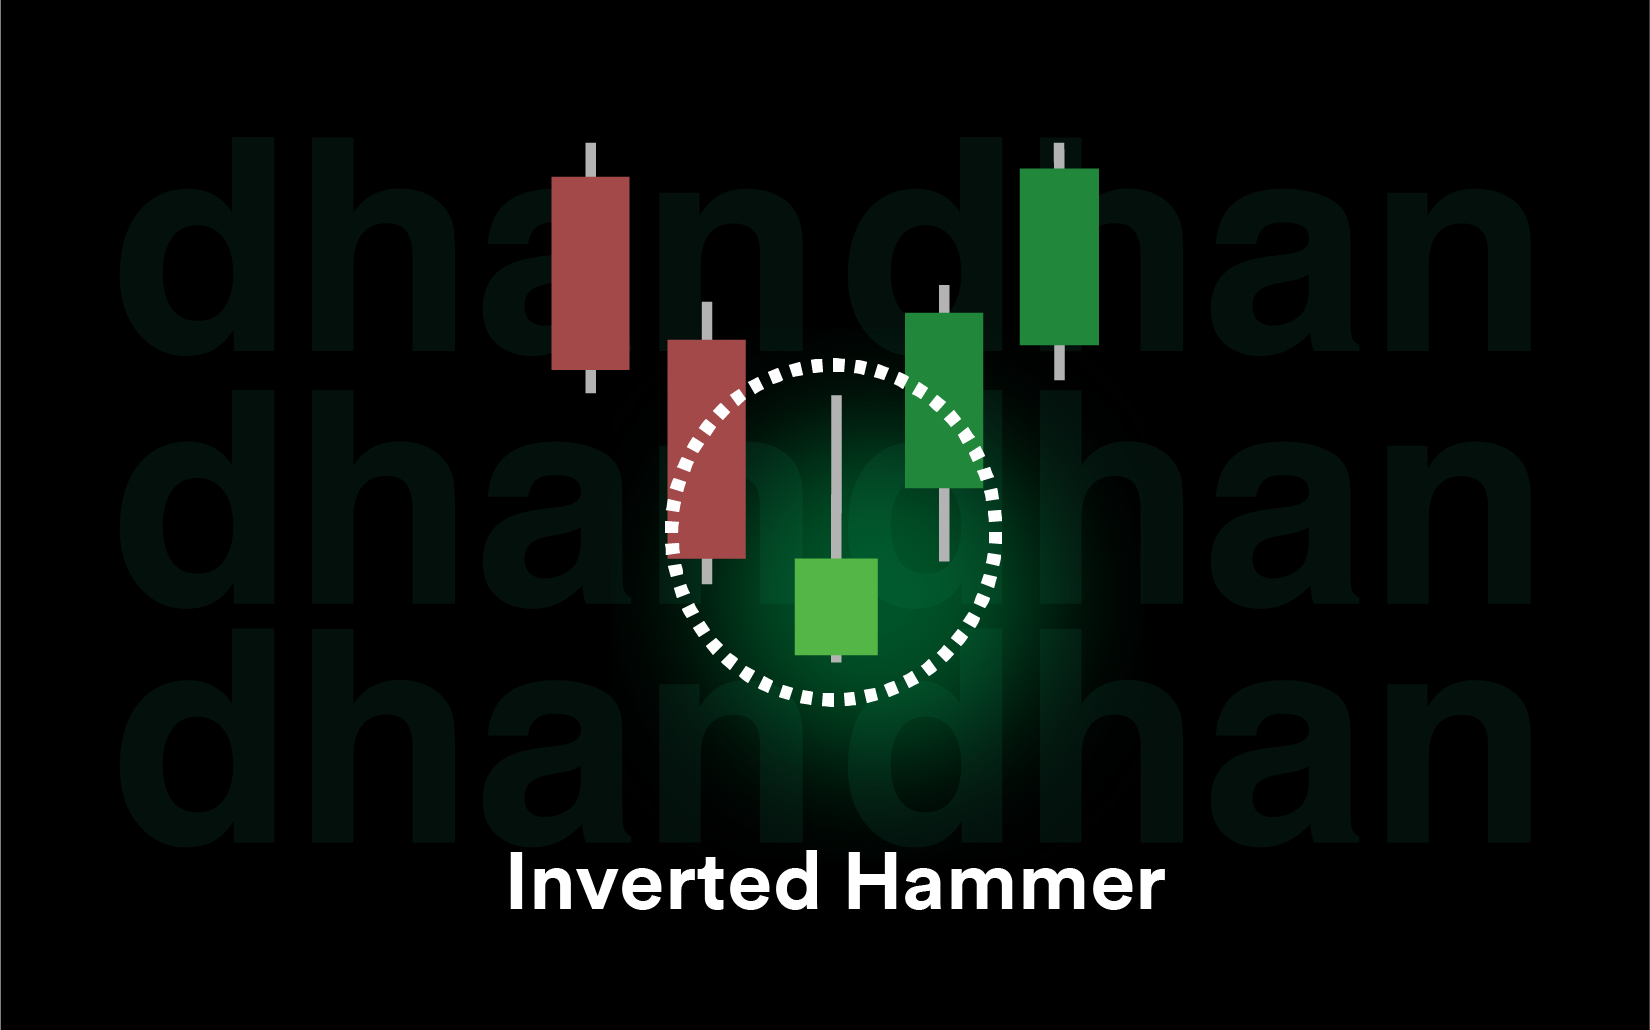
Inverted Hammer candlestick pattern has a long upper wick and a small body, and it shows up at the bottom of a downtrend. Despite earlier selling pressure, it implies early buying interest. Reliability is increased by a bullish candle in the subsequent session.
3. Morning Star
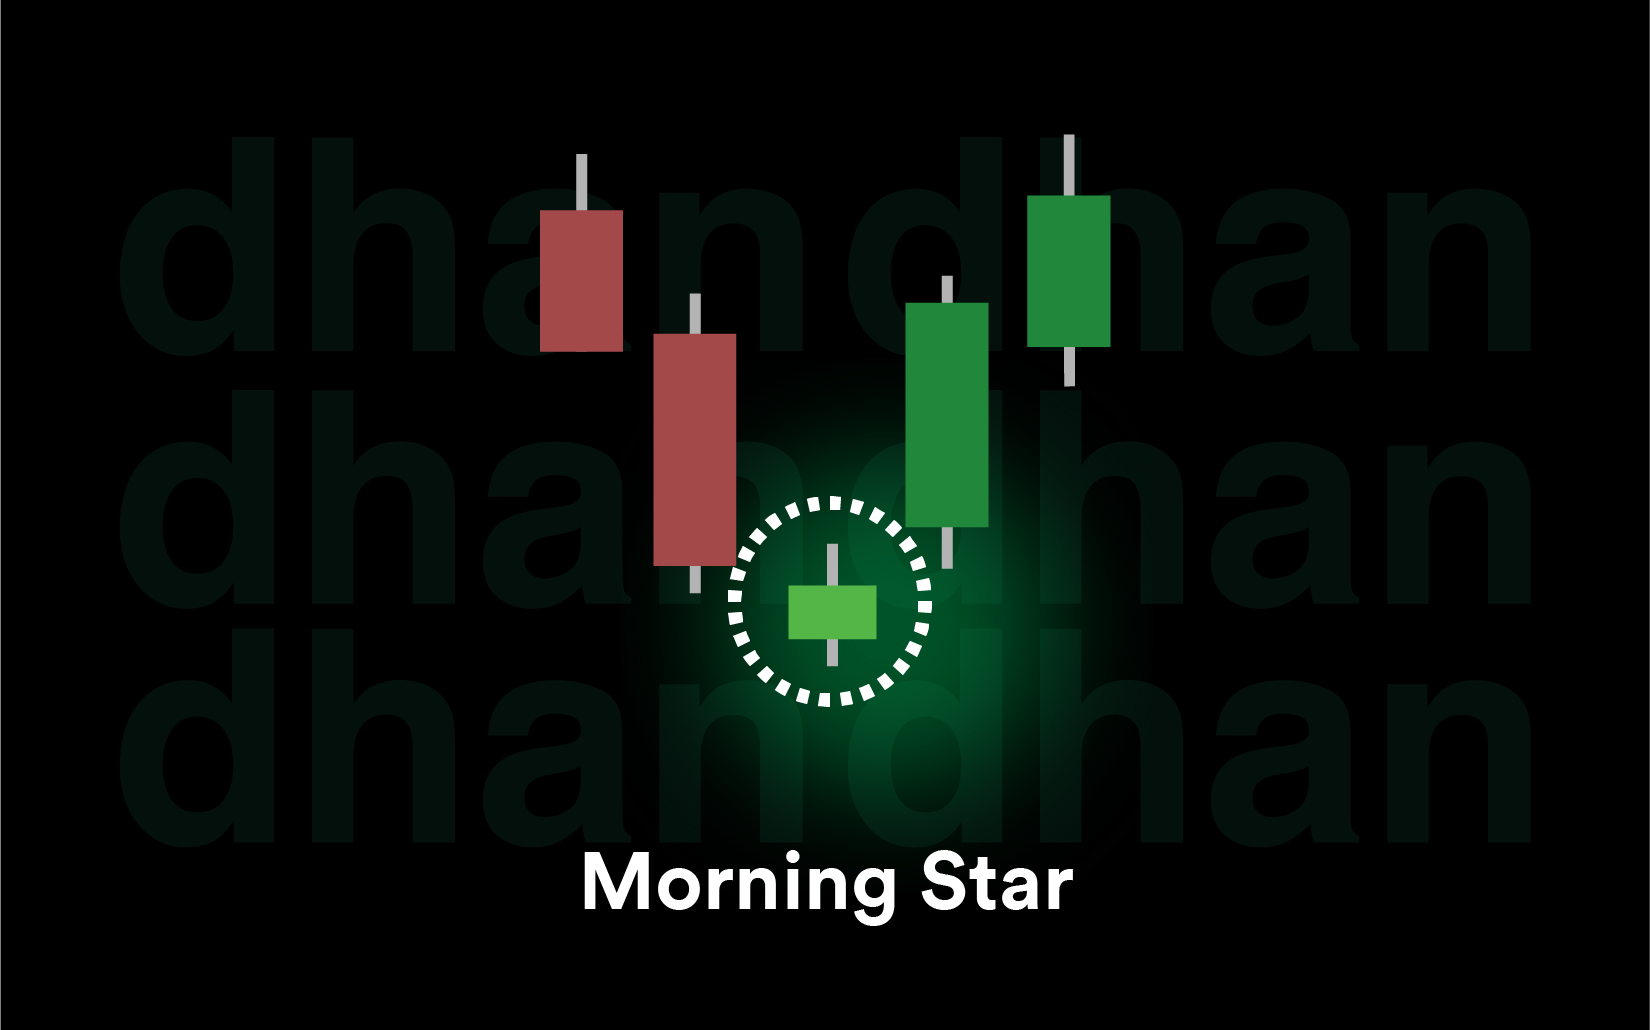
Morning Star candle pattern is a three-candle bullish reversal pattern. It consists of a strong bearish candle followed by a small body candle, showing indecision, and then a strong bullish candle. It is an indication of a transition between selling and buying power. Performs best when it is verified by an increased volume.
4. Three White Soldiers
Three White Soldiers is a three-candle bullish reversal pattern. Three consecutive bullish candles with higher closes. This pattern indicates a strong momentum shift from bearish to bullish sentiment. It is especially powerful after prolonged downtrends or near major support zones.

5. Bullish Engulfing
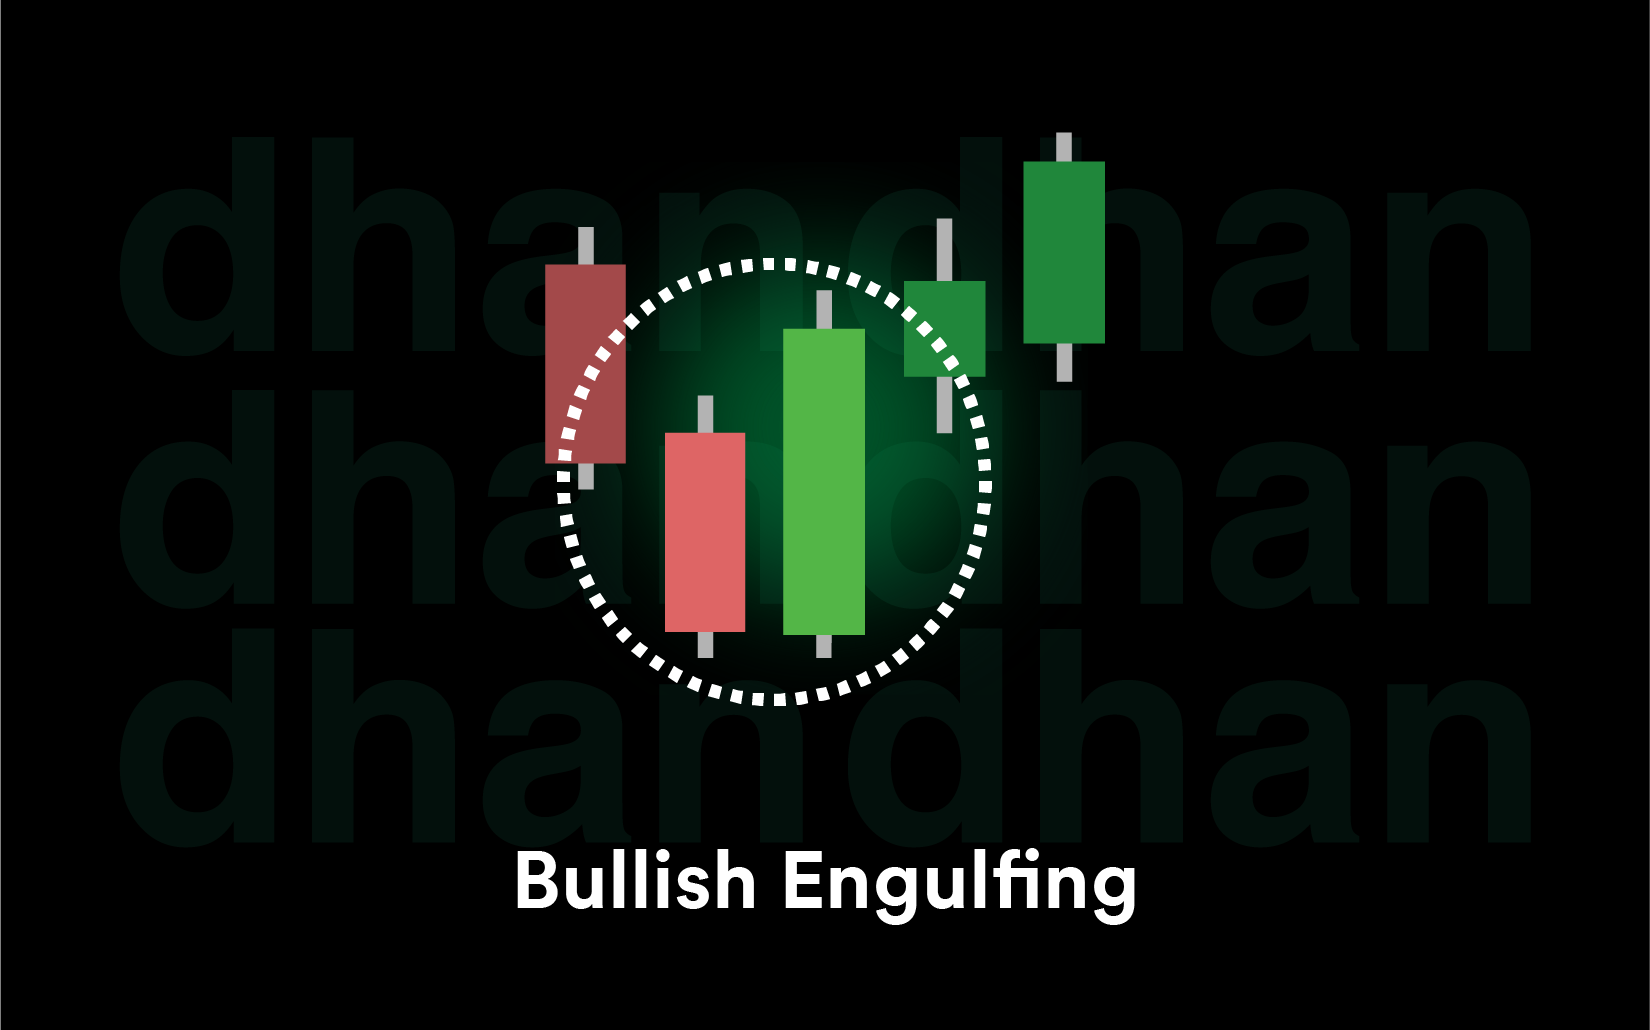
Bullish engulfing pattern appears after a downtrend. In this pattern first candle is a bearish candle, which is then entirely covered by a large bullish candle. It represents a radical change in the balance between the sellers and the buyers. It is most effective when it appears after a prolonged fall.
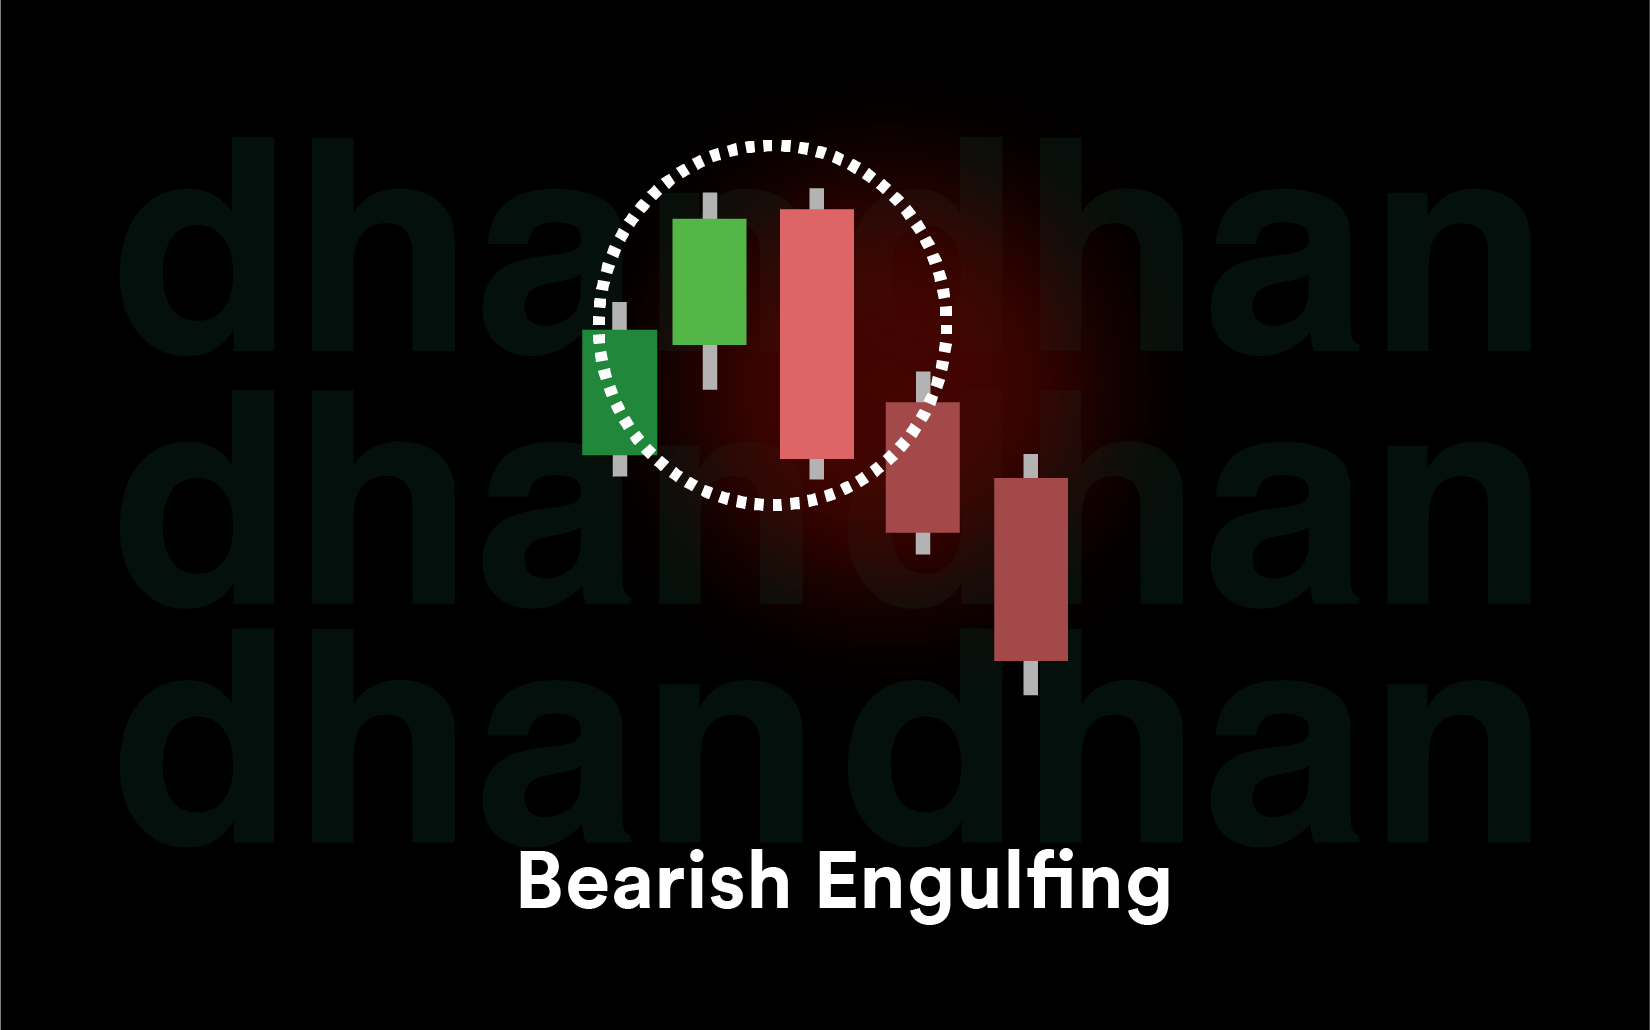
6. Bearish Engulfing
A bearish engulfing pattern appears after an uptrend. It consists of a strong bearish candle that completely covers the previous bullish candle. This pattern shows that sellers are becoming aggressive and may signal a reversal from the uptrend, especially when it happens near resistance levels.
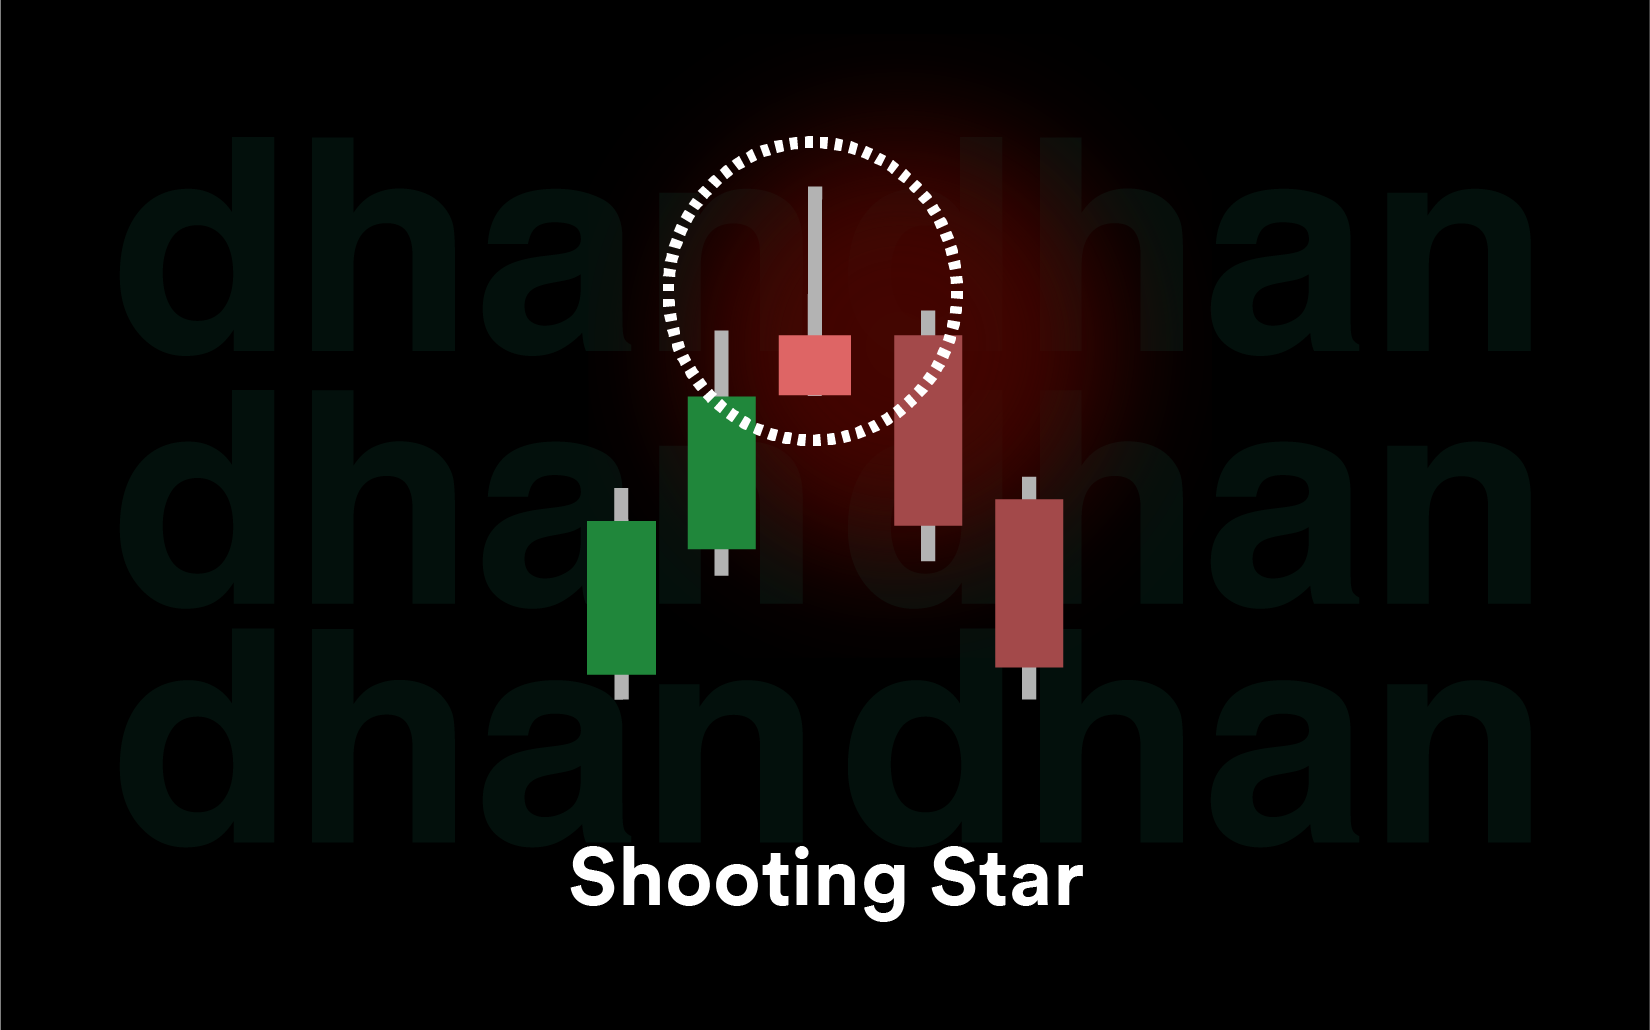
7. Shooting Star
A shooting star pattern forms at the top of an uptrend. It has a candle with a small body and a long upper wick. It signals rejection of higher prices and growing selling pressure. A bearish confirmation candle strengthens the signal.
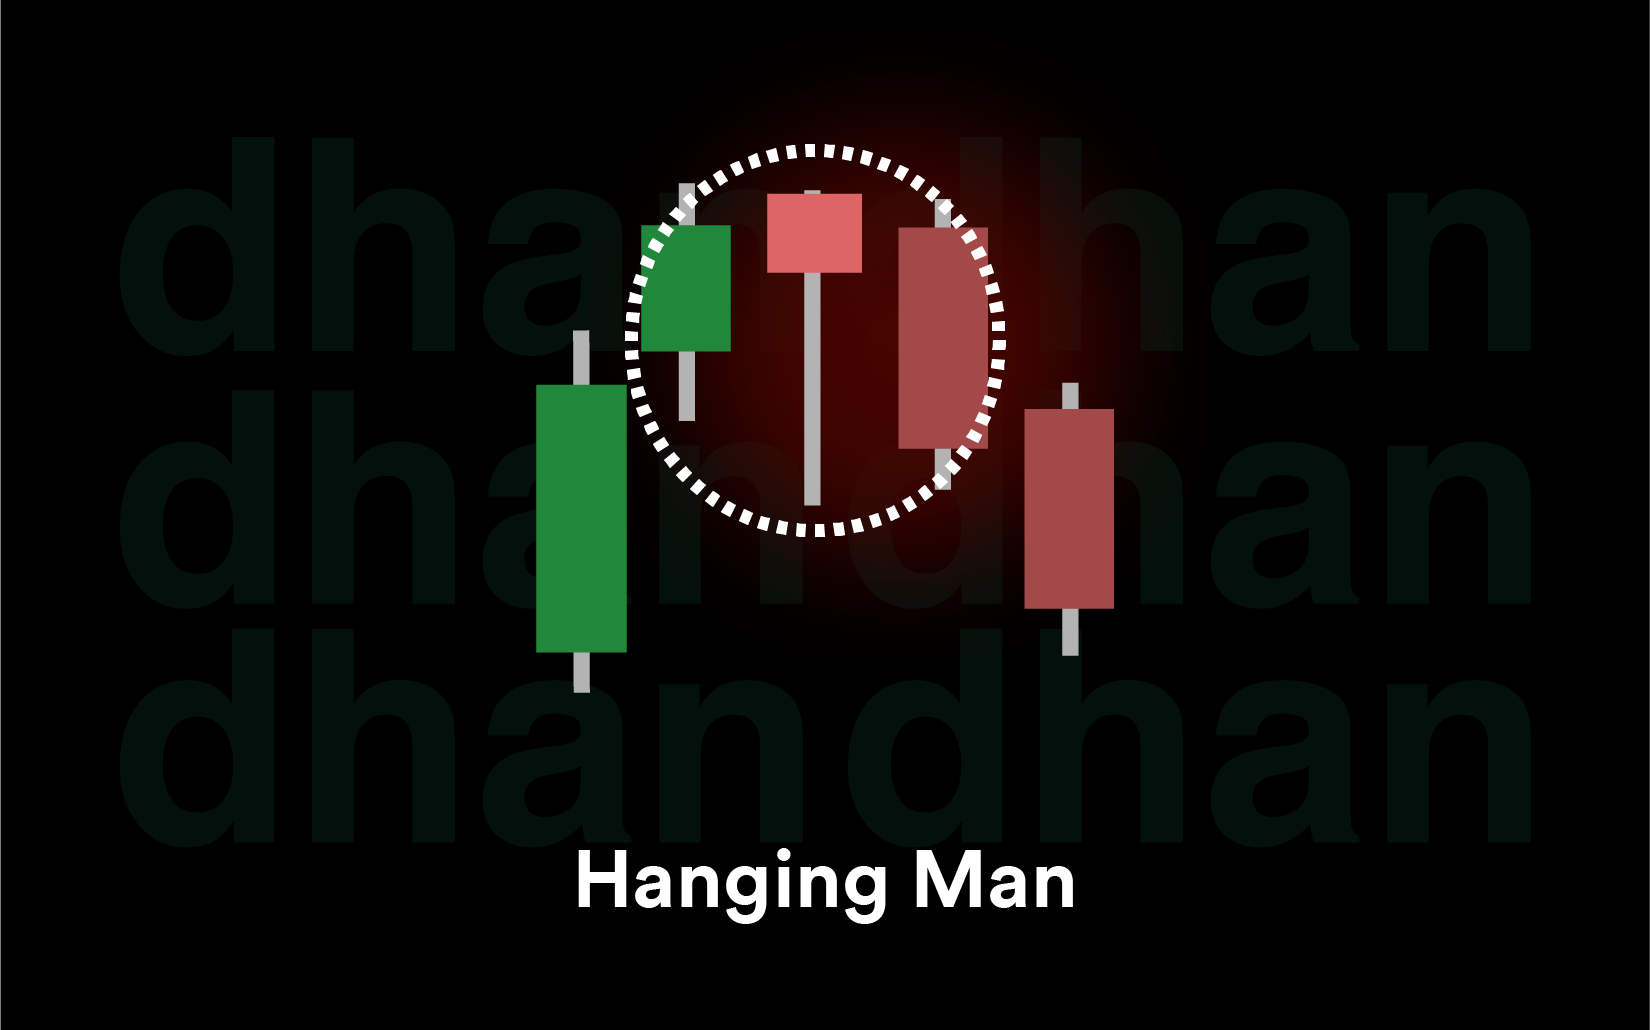
8. Hanging Man
Hanging Man pattern appears to be a Hammer but forms at the top of an uptrend. It demonstrates that the sellers experimented with the lower prices during the session. If the pattern is followed by a bearish candle, it is considered a potential reversal.
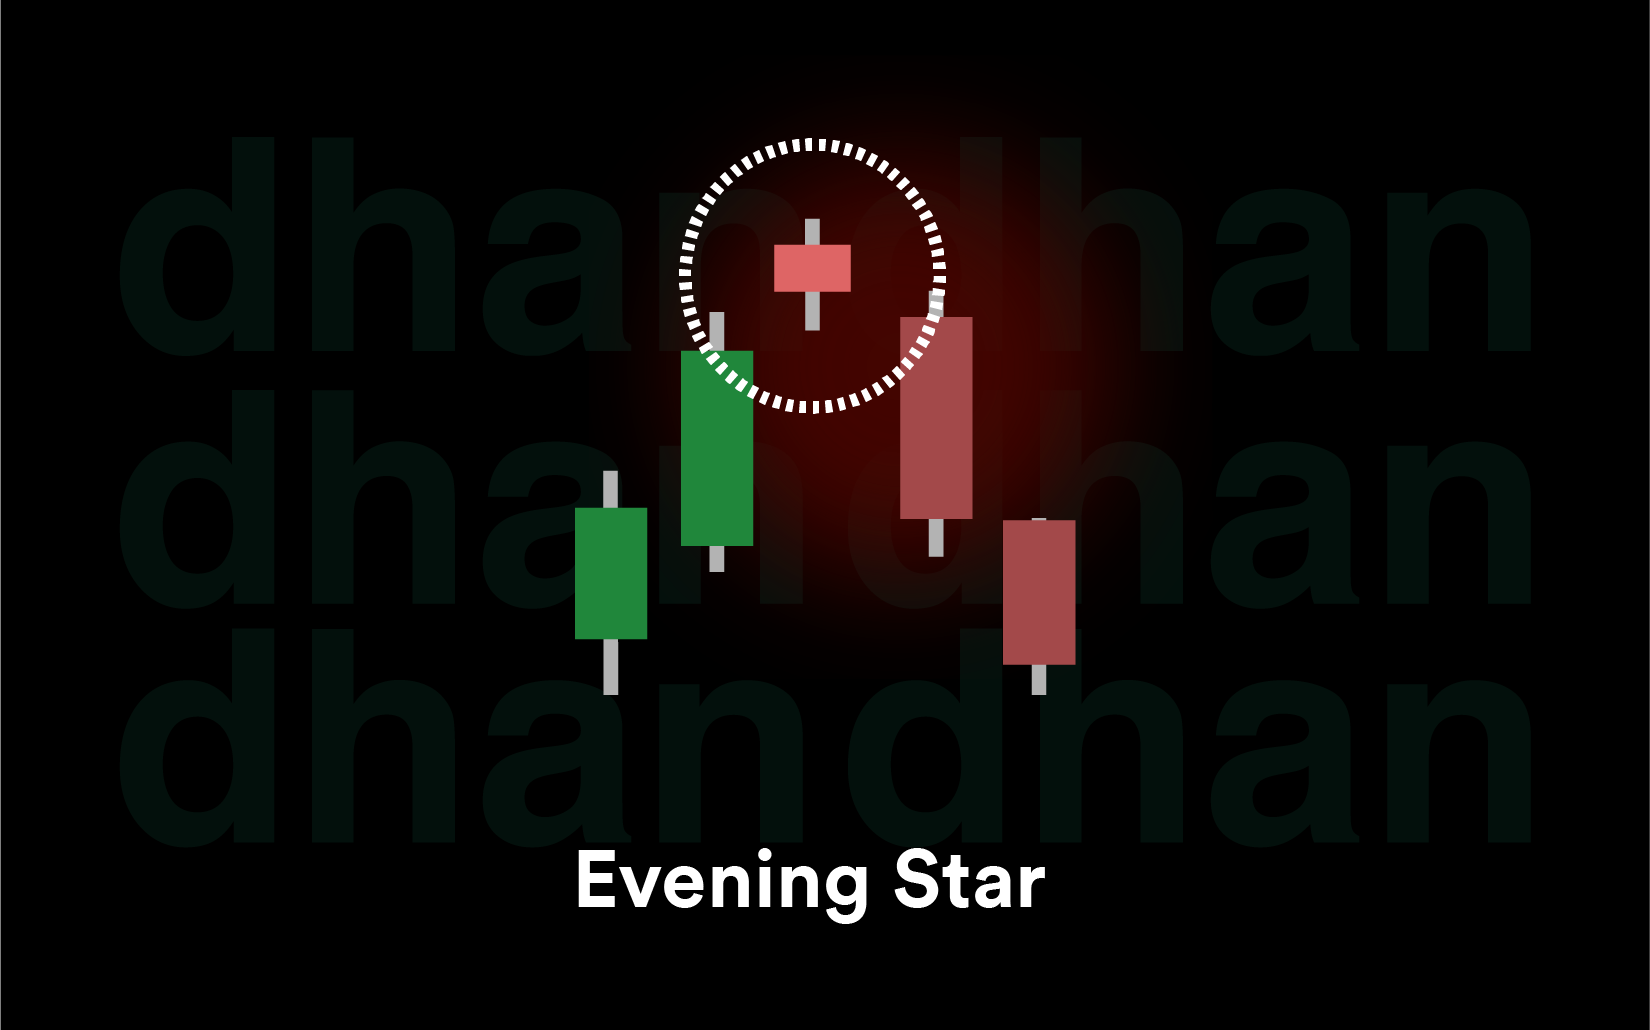
9. Evening Star
Evening Star pattern is a three-candle bearish reversal pattern that forms at the top of an uptrend. The first candle is a strong bullish candle, followed by a small indecision candle and a strong bearish candle. It indicates buyer exhaustion and growing selling pressure. It is more reliable when forms at the resistance levels.
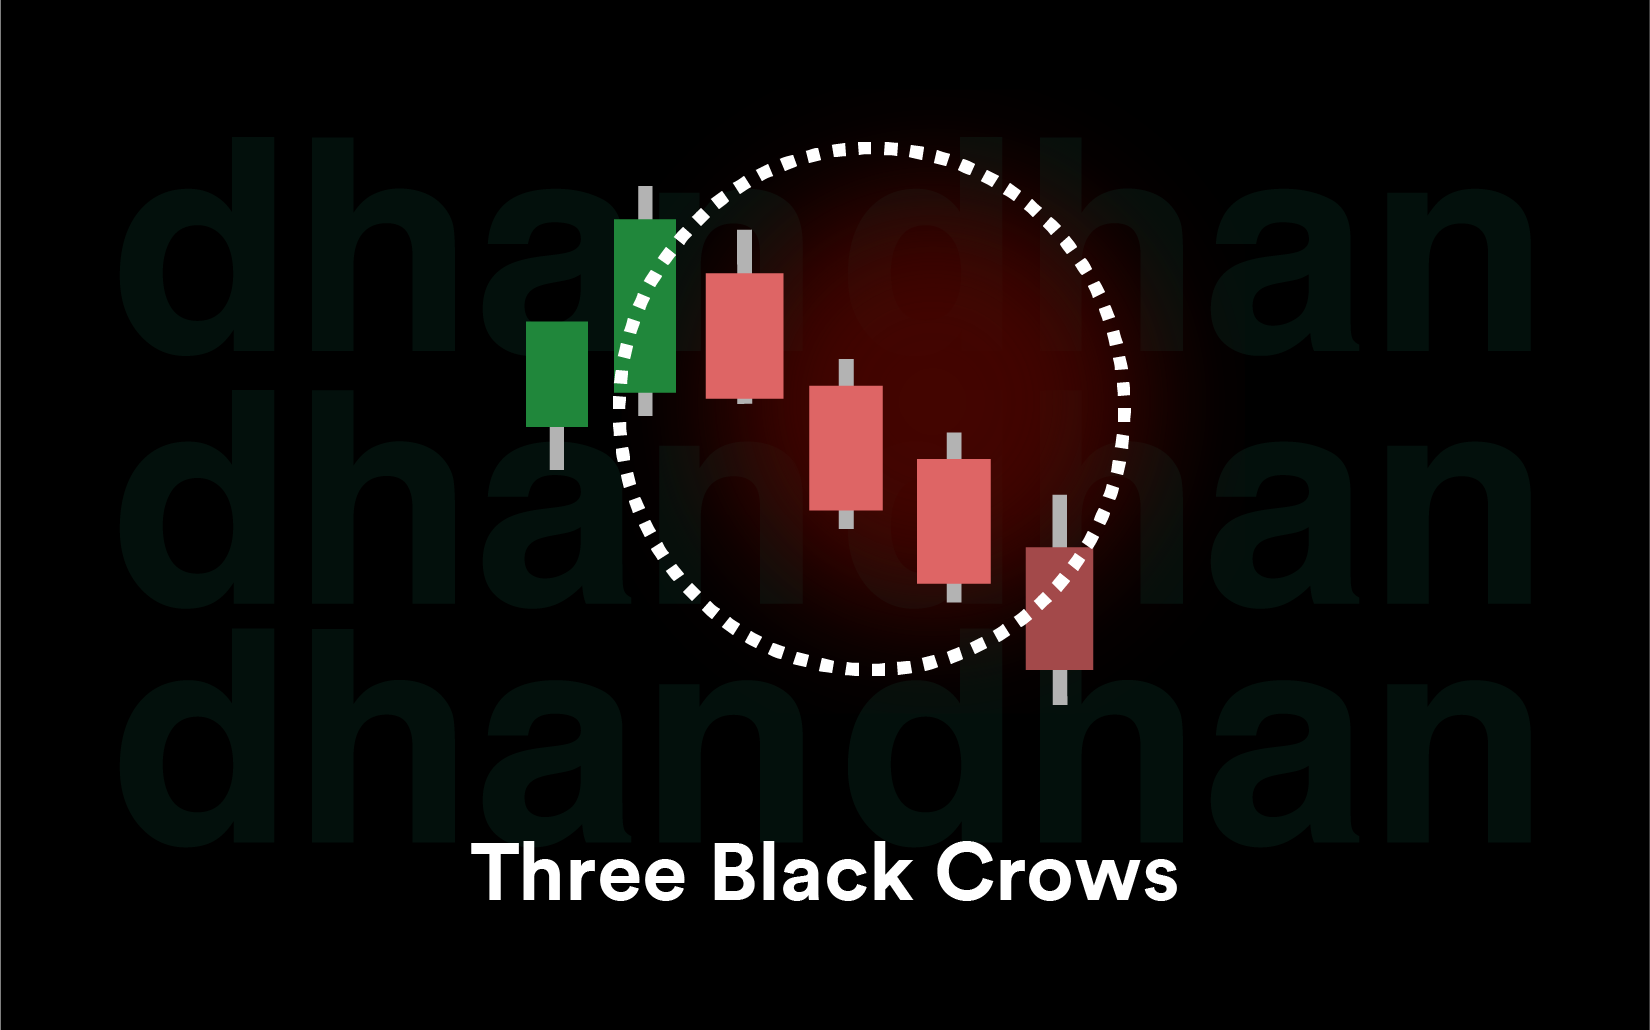
10. Three Black Crows
Three Black Crows pattern is the converse of the three white soldiers. It forms three successive bearish candles forming lower lows. This trend indicates a high selling pressure and inversion of the bullish to the bearish control. This pattern is common after a long upward trend.
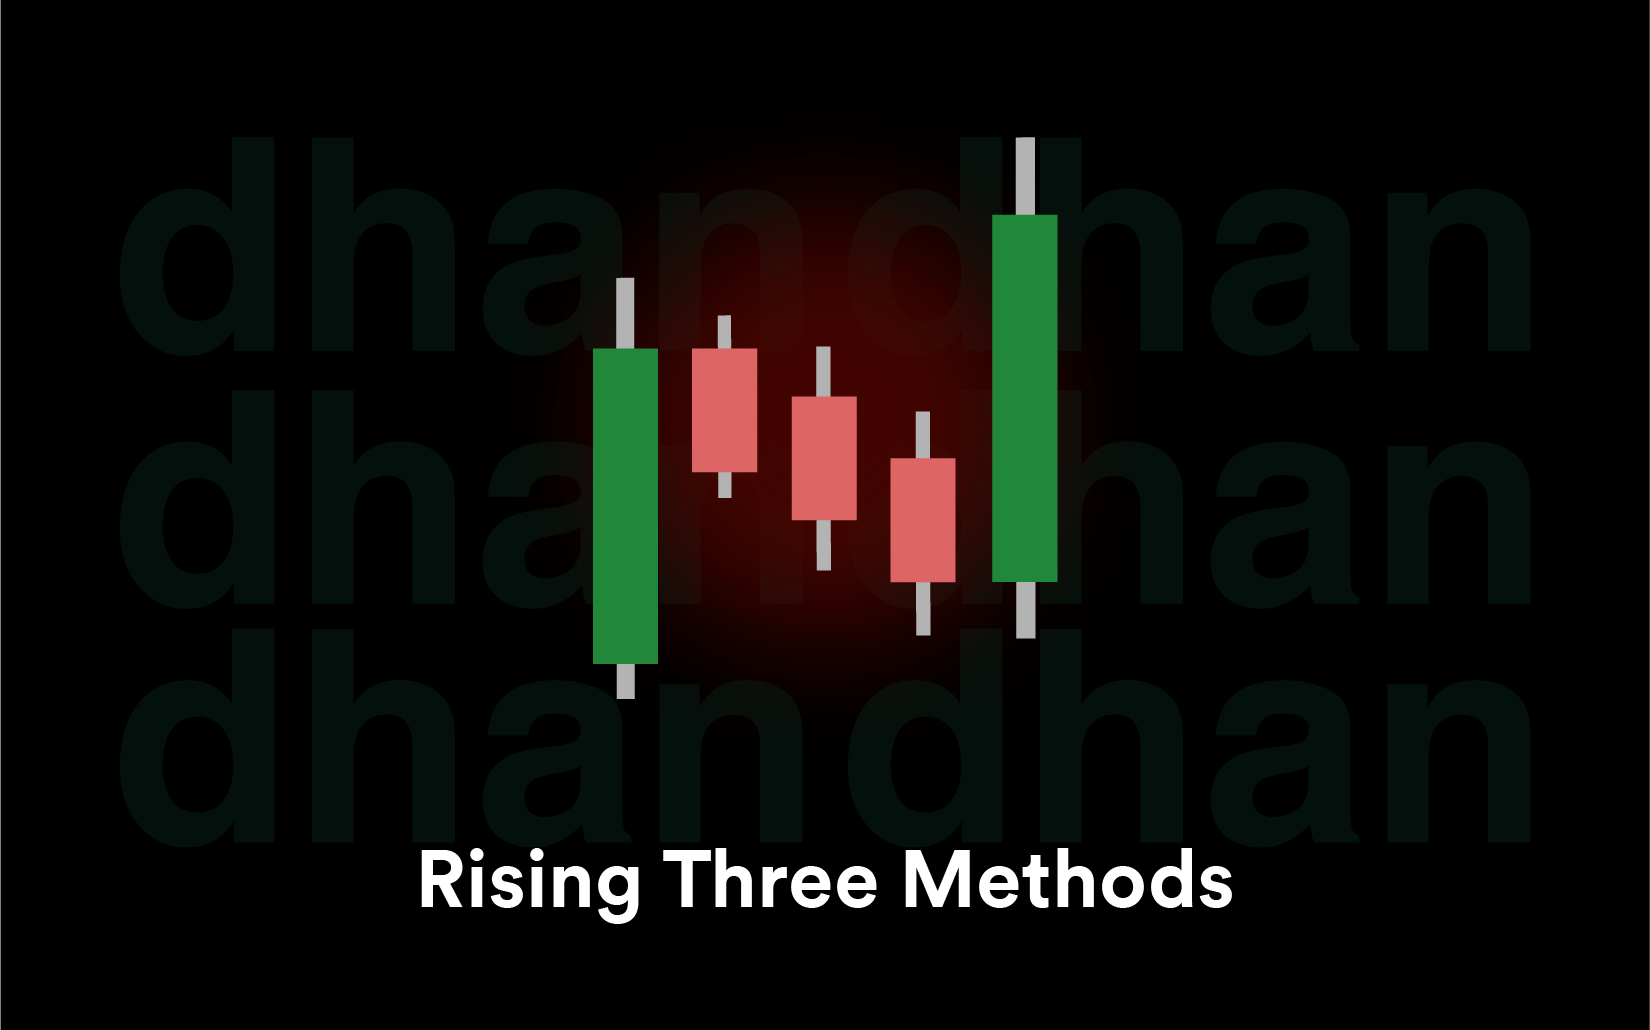
11. Rising Three Methods
The Rising Three Methods consists of a powerful bullish candle with three minor bearish candles in between and a powerful bullish candle. It is a short-lived consolidation and then further progress of the growing trend. This pattern forms between an uptrend, showing a small pullback.
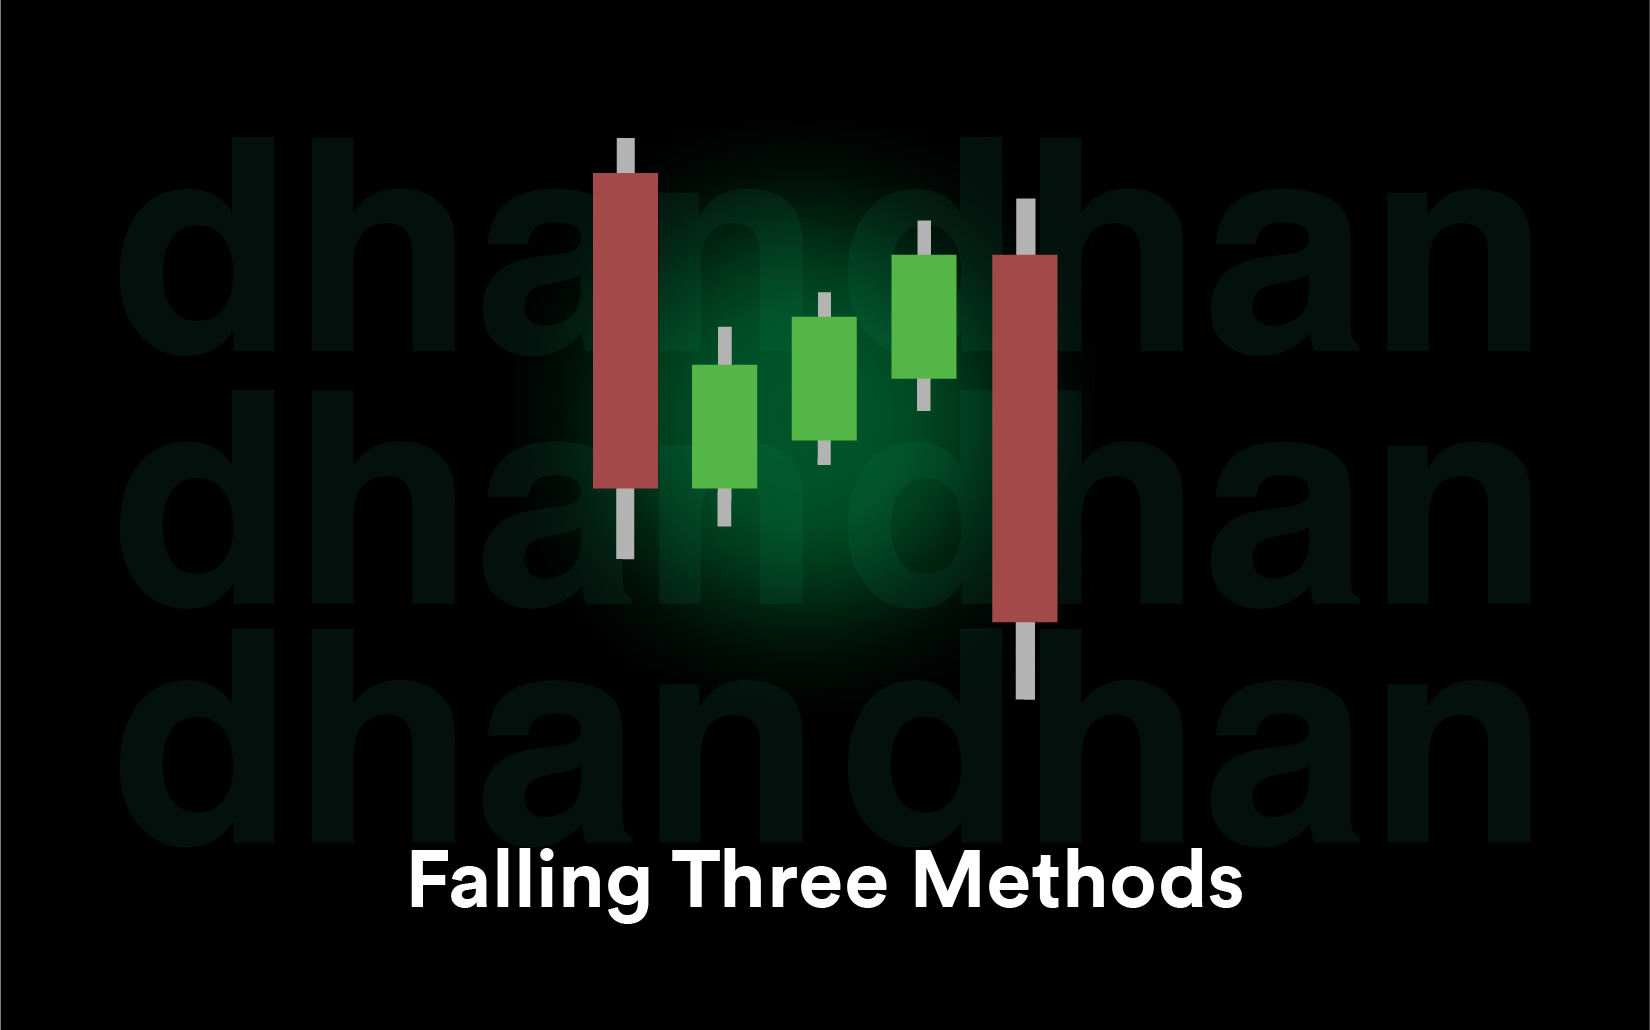
12. Falling Three Methods
Falling Three Methods is opposite to the rising three methods. The Falling Three Methods is a 5-candle bearish continuation pattern signalling a temporary pause in a downtrend. In this pattern, a strong bearish candle is followed by three small bullish candles within its range, and a strong bearish breakout confirming continuation of the downtrend.
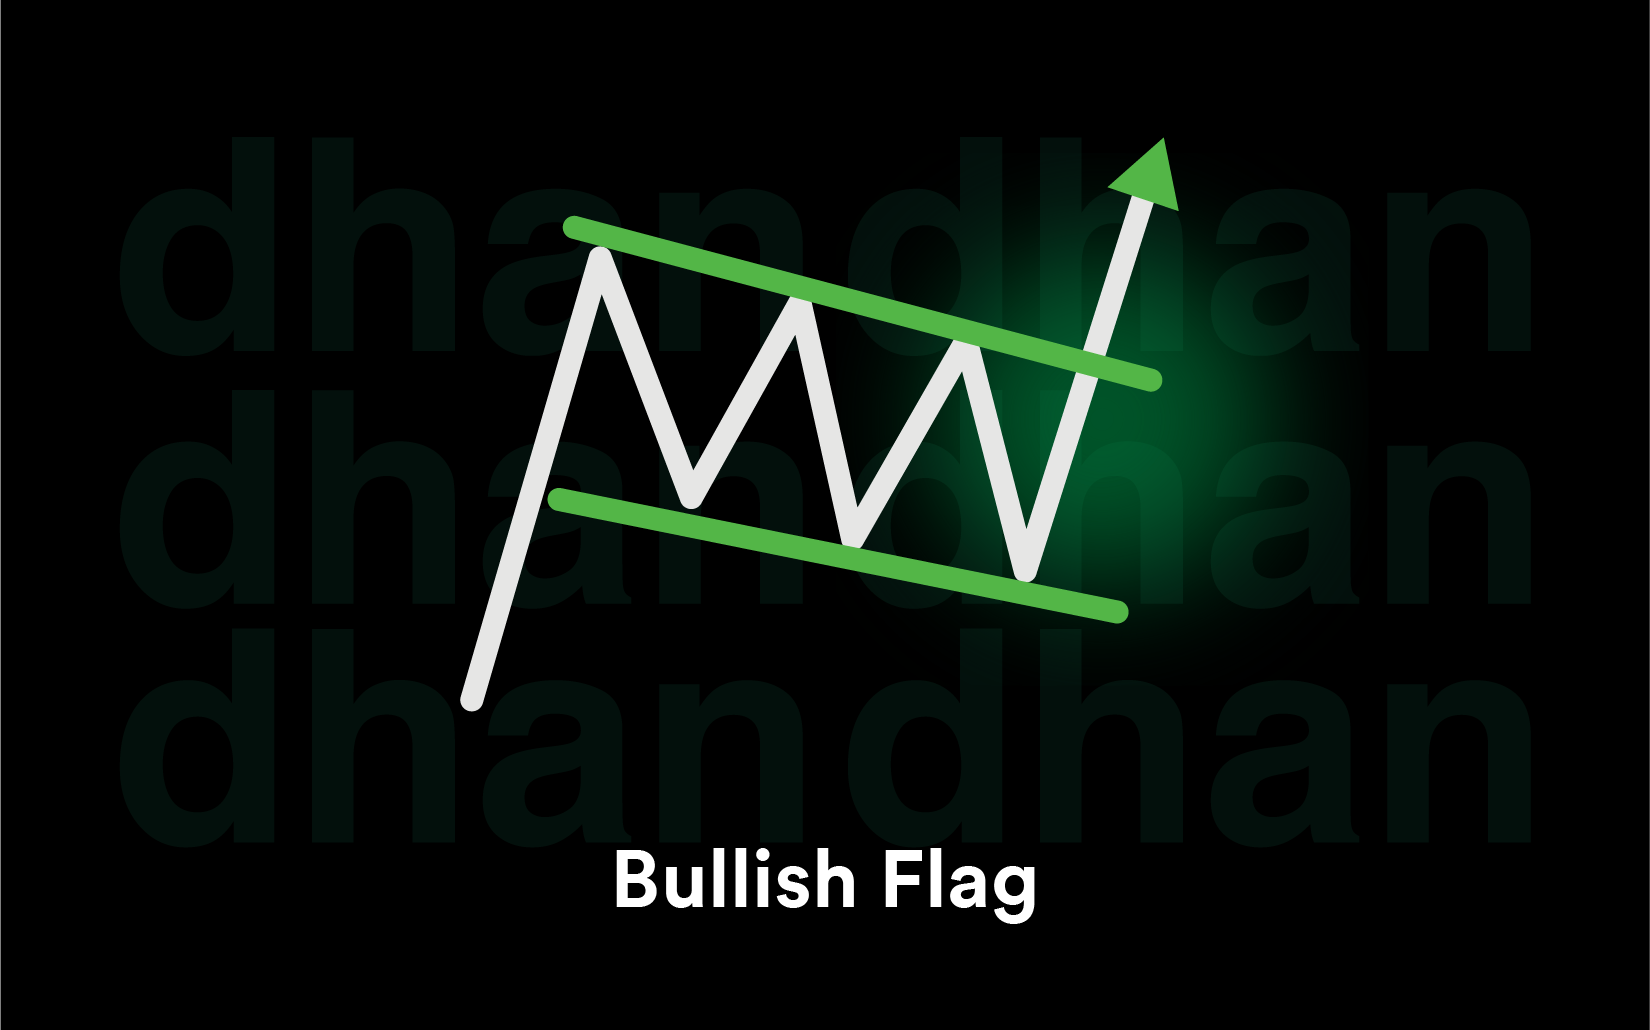
13. Bullish Flag
In Bullish flag pattern first candle is a strong bullish candle (flagpole), followed by a small bearish candle signalling consolidation, and a breakout upward. It signals that buyers remain in control after a brief profit-booking.
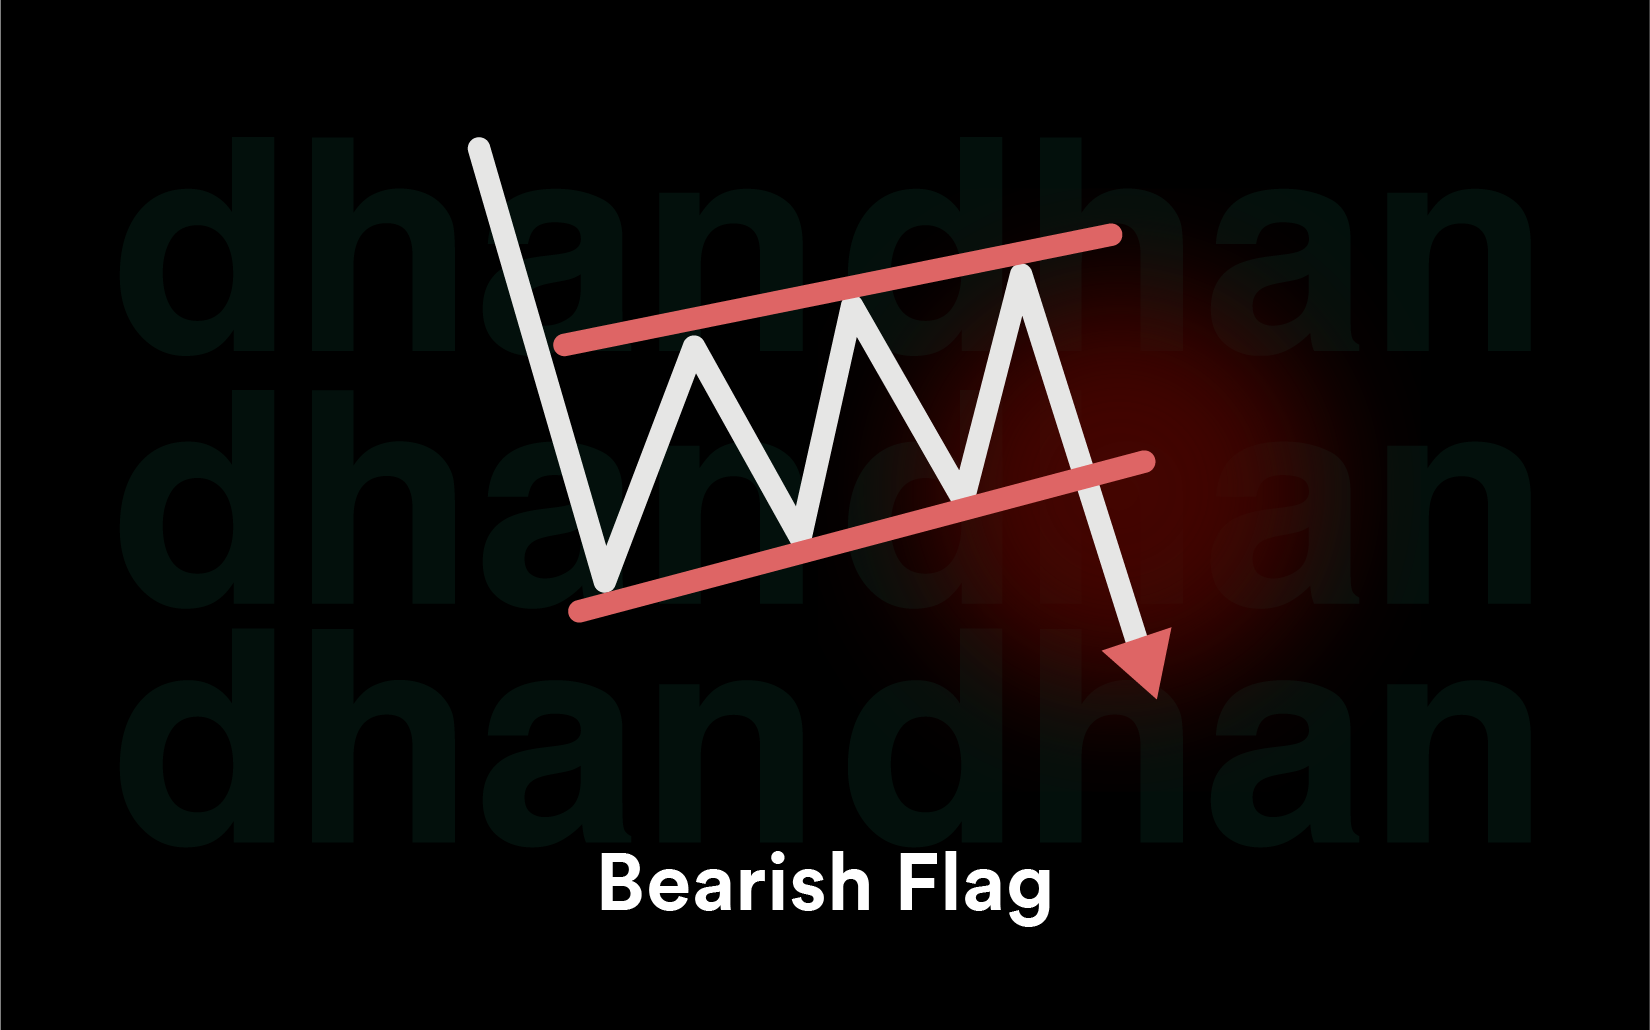
14. Bearish Flag
Bearish flag is a downtrend continuation pattern in which an upward consolidation candle forms during the downtrend, and then a subsequent slump. It signals a temporary pause before the downtrend resumes.
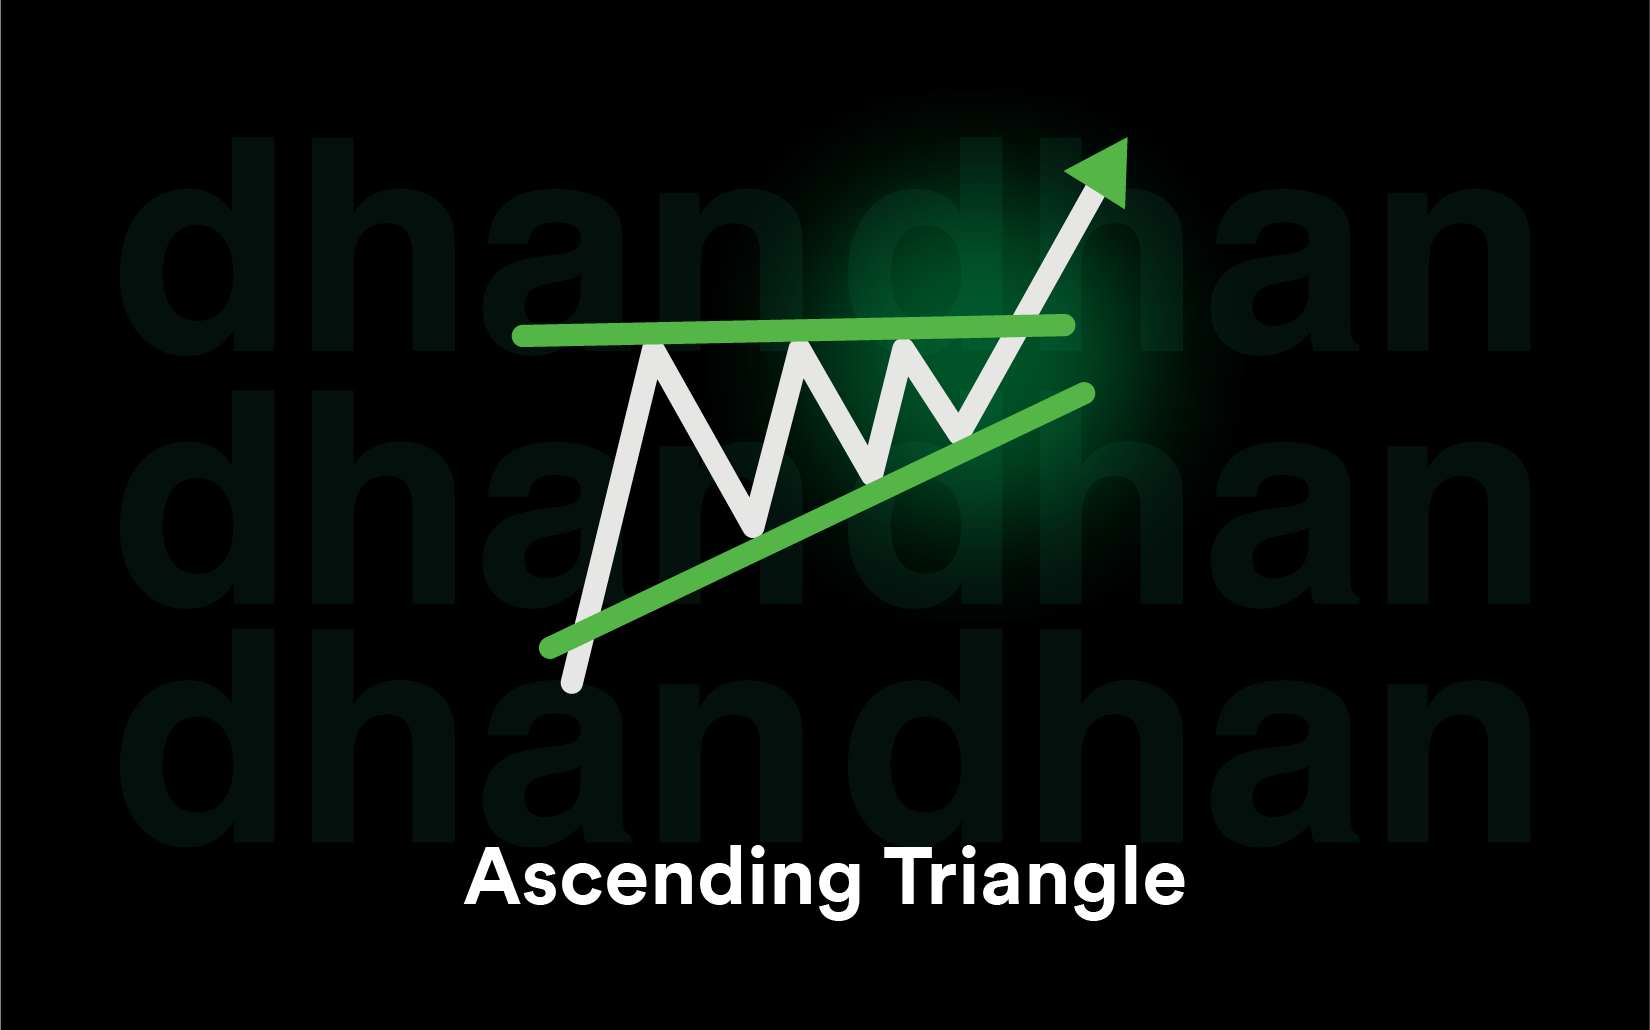
15. Ascending Triangle
In an Ascending Triangle pattern, price forms higher lows while facing horizontal resistance. A breakout above resistance confirms bullish continuation. This pattern reflects increasing buying pressure and weakening selling pressure.
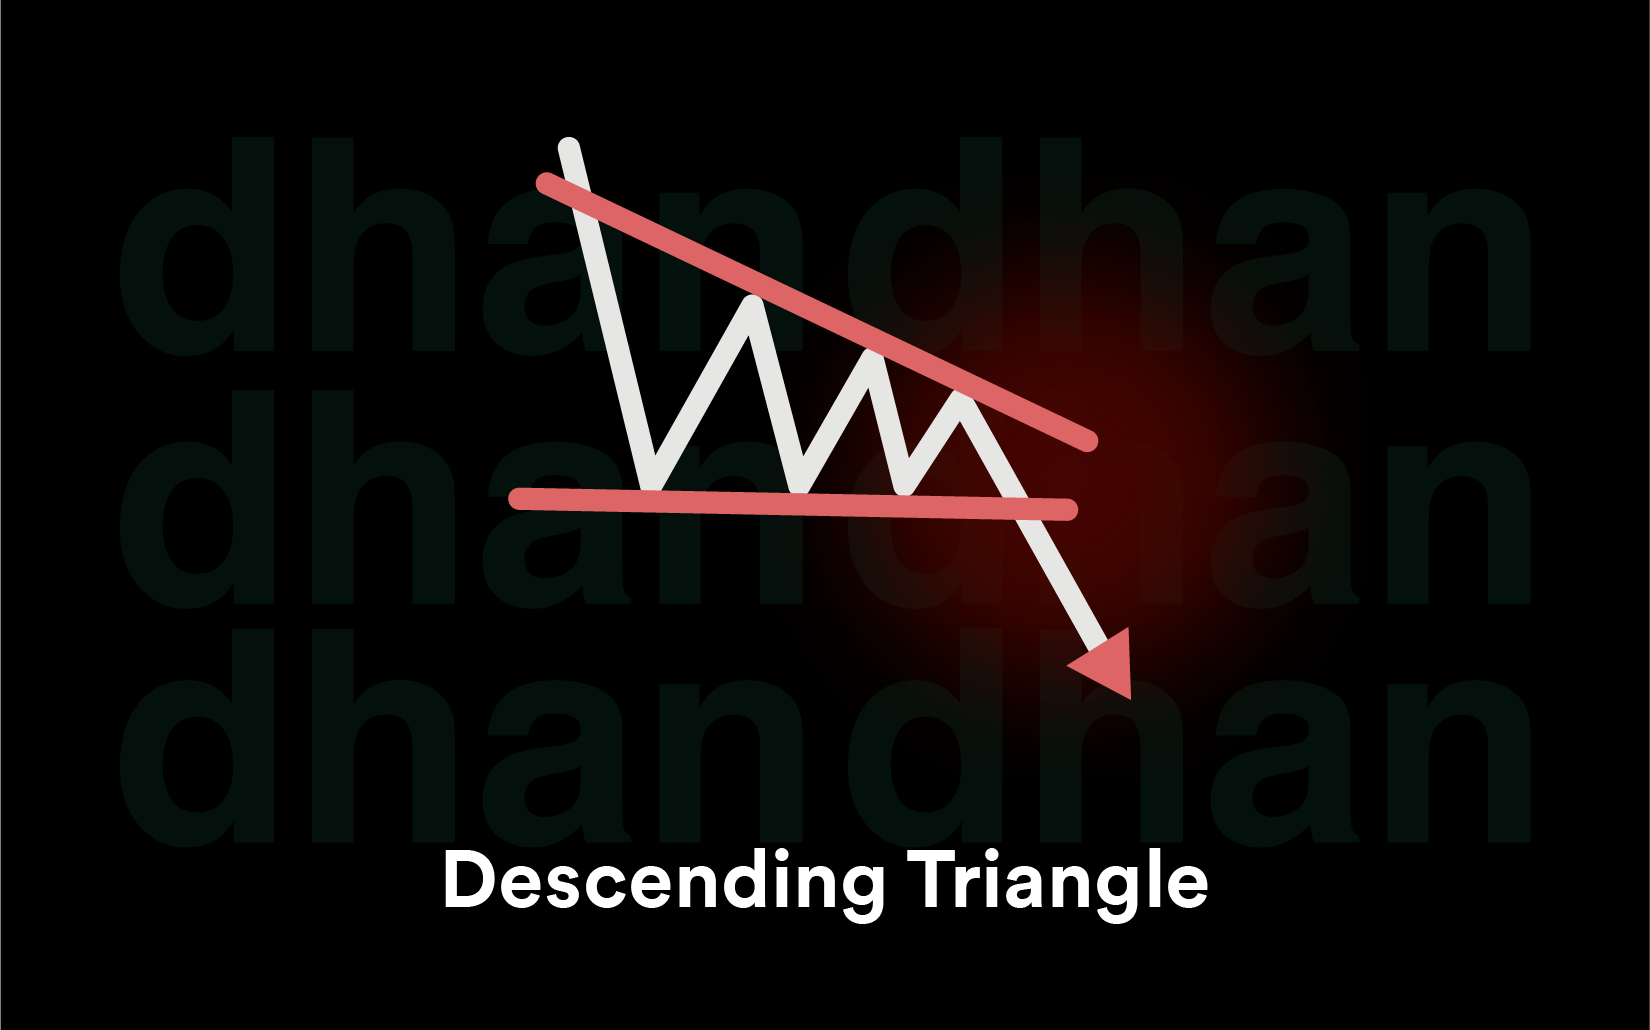
16. Descending Triangle
Descending Triangle pattern is the opposite of the ascending triangle pattern. In this pattern, price forms lower highs while support remains horizontal. A breakdown below support is a confirmation of bearish continuation.
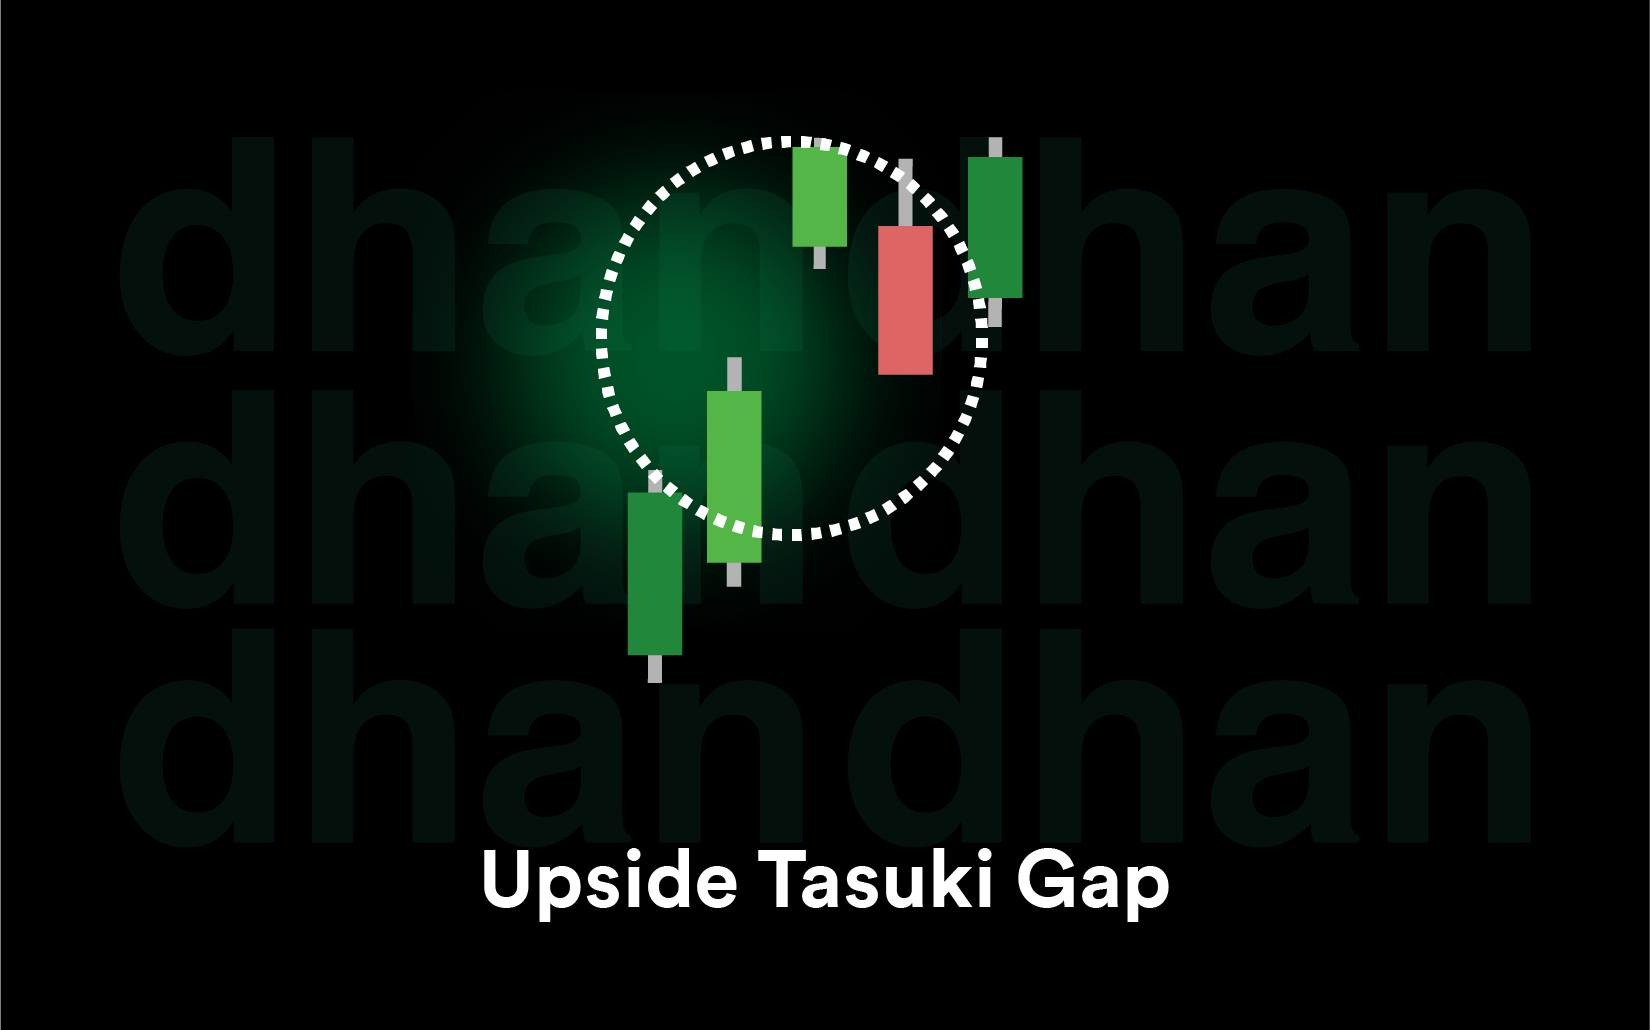
17. Upside Tasuki Gap
The Upside Tasuki Gap is a bullish continuation candlestick pattern that appears during a strong uptrend. It signals that buying momentum is likely to continue after a brief pause. It has a strong bullish candle followed by another bullish candle that opens with a gap up, and the second candle is a bearish candle that partially retraces but does not fill the gap.
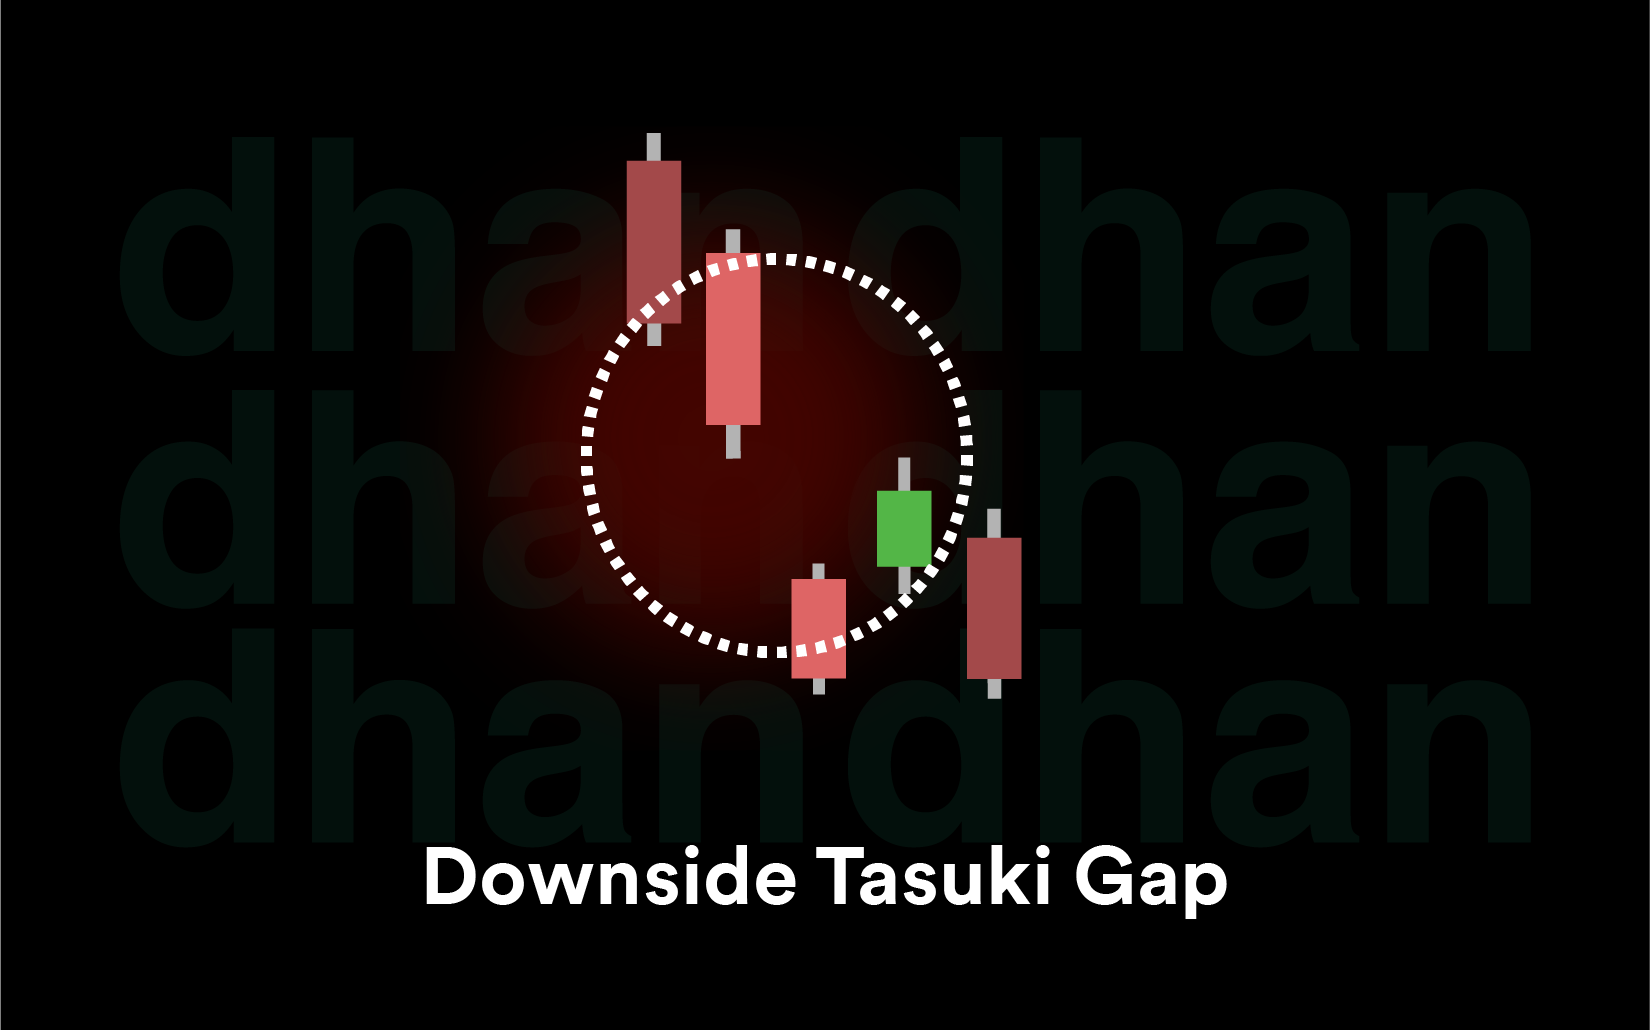
18. Downside Tasuki Gap
The Downside Tasuki Gap is a 3-candle bearish continuation pattern that signals a temporary pause in a downtrend before further declines. Forms in a downtrend, when a downward gap is followed by a partial retracement that fails to close the gap. A breakdown confirms continuation of the bearish trend.
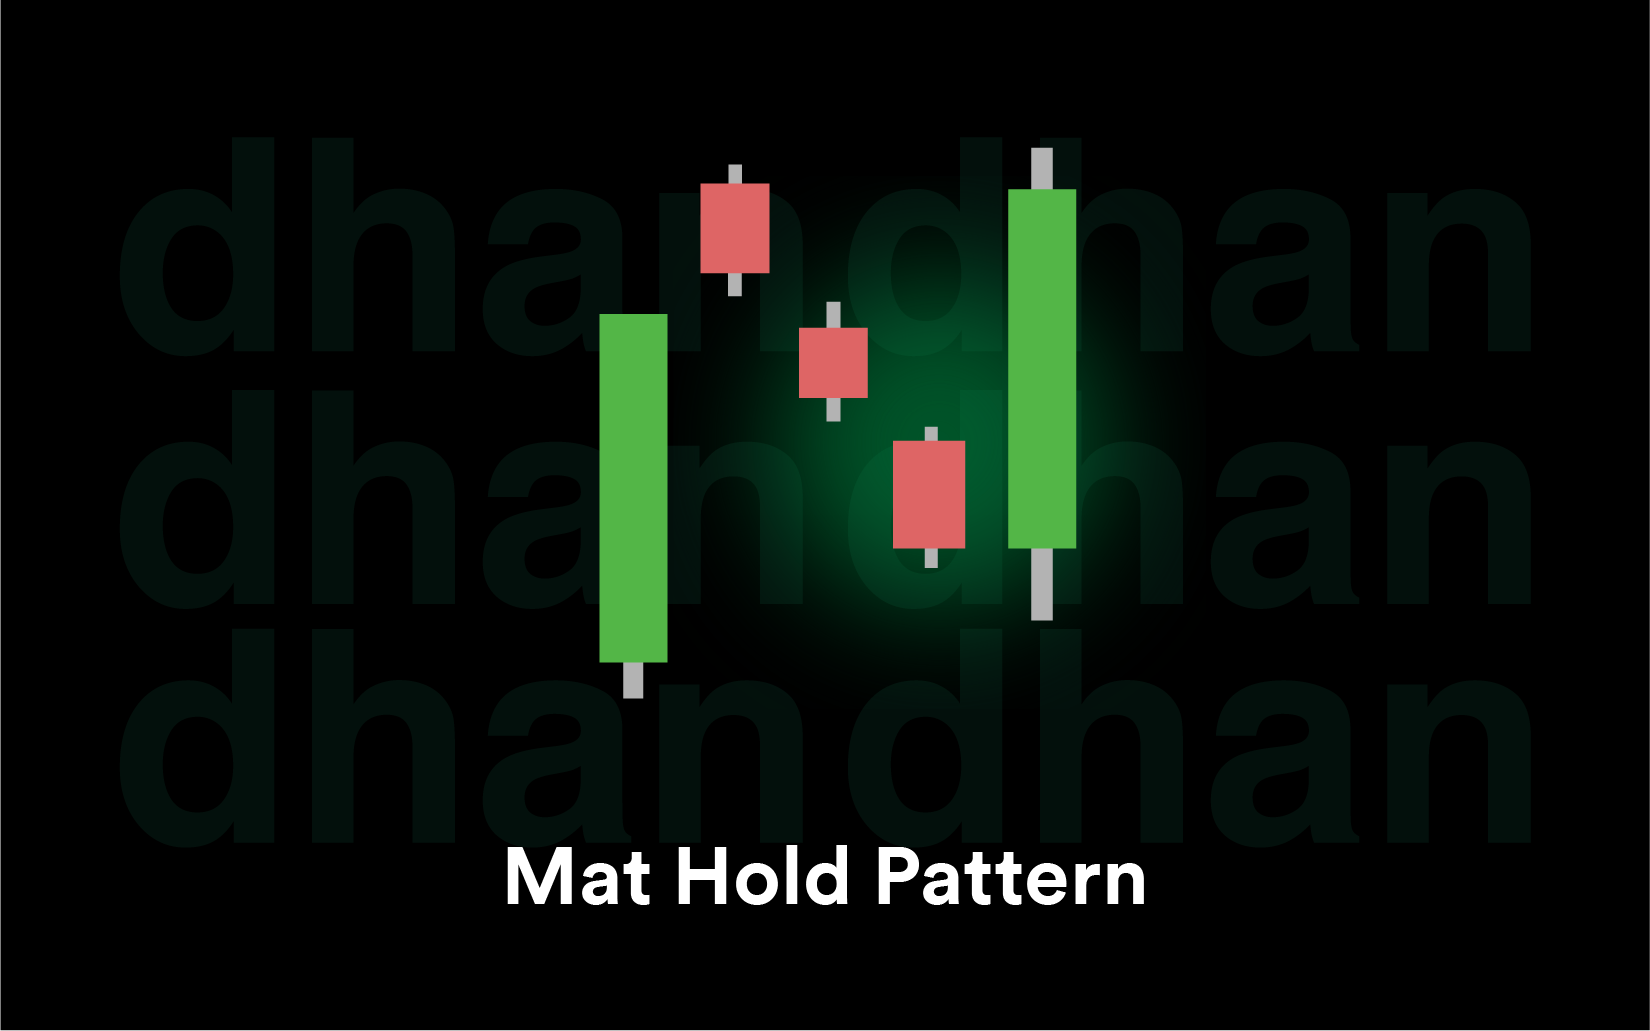
19. Mat Hold Pattern
The Mat Hold Pattern is a bullish continuation candlestick pattern that signals strong momentum in an existing uptrend. It consists of five candles, with the first candle being a strong bullish candle with a large body. Followed by a small bearish candle that gaps up, and a small bearish or sideways candle staying within the range of the first candle. The last candle is a strong bullish candle that closes above the high of the first candle. It represents a temporary pause within an uptrend.
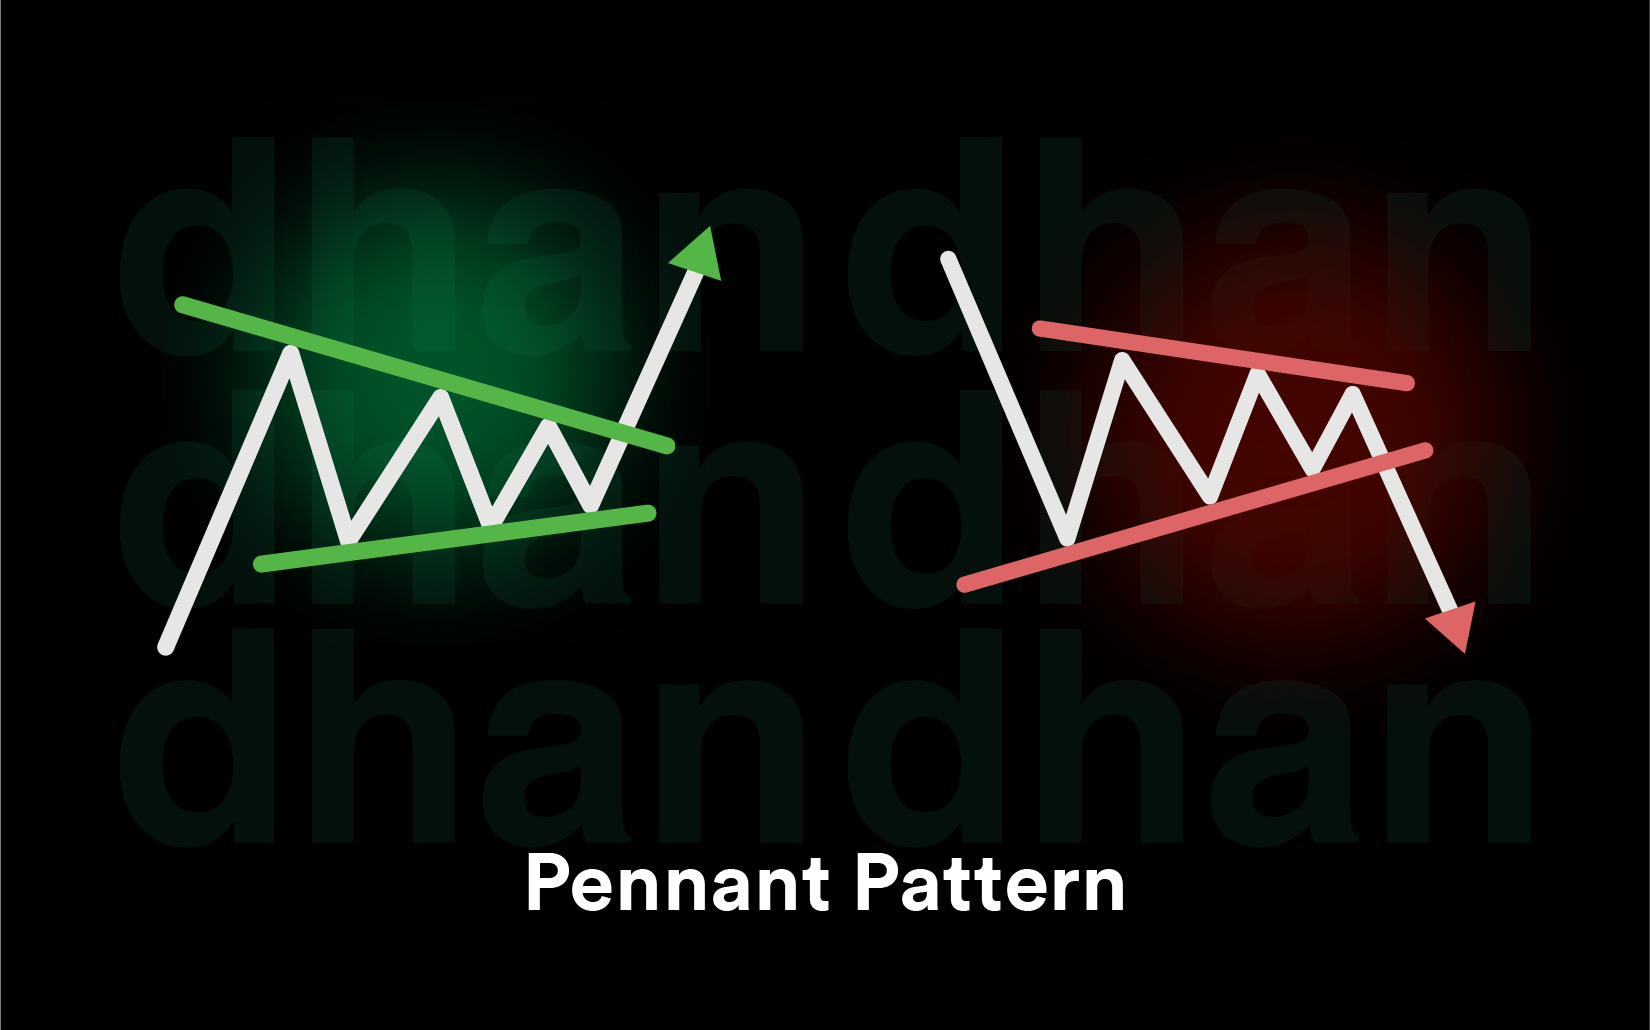
20. Pennant
The Pennant Pattern is a continuation chart pattern that is formed after a strong movement in the price. It indicates a slight pause in a trend before the last trend continues. It has two primary components: a flag pole and a pennant. A flag pole is a sharp upward or downward price move, and a pennant is a small symmetrical triangle created by the trend lines. Pennant can be bull pennant or bear pennant.
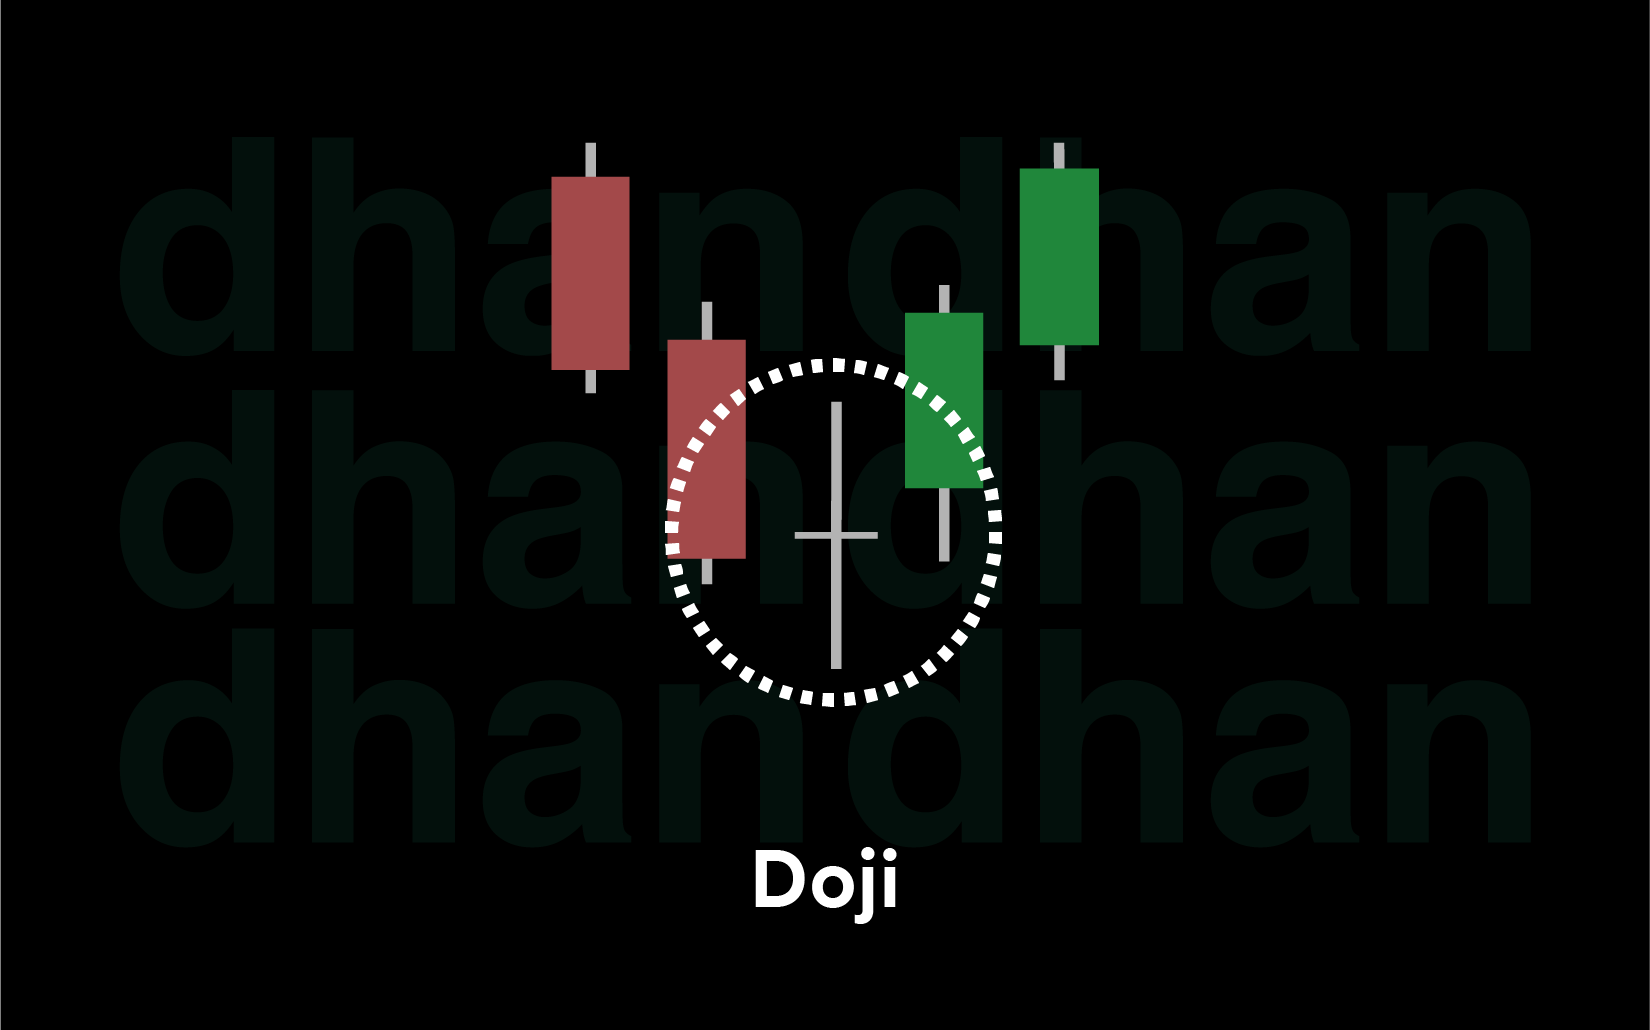
21. Doji
A Doji candle pattern forms when the opening and closing prices of a candle are nearly equal. It signals market indecision. Its meaning depends on the context. If it forms near resistance, it may indicate a reversal. If forms during trends, it may signal a temporary pause.
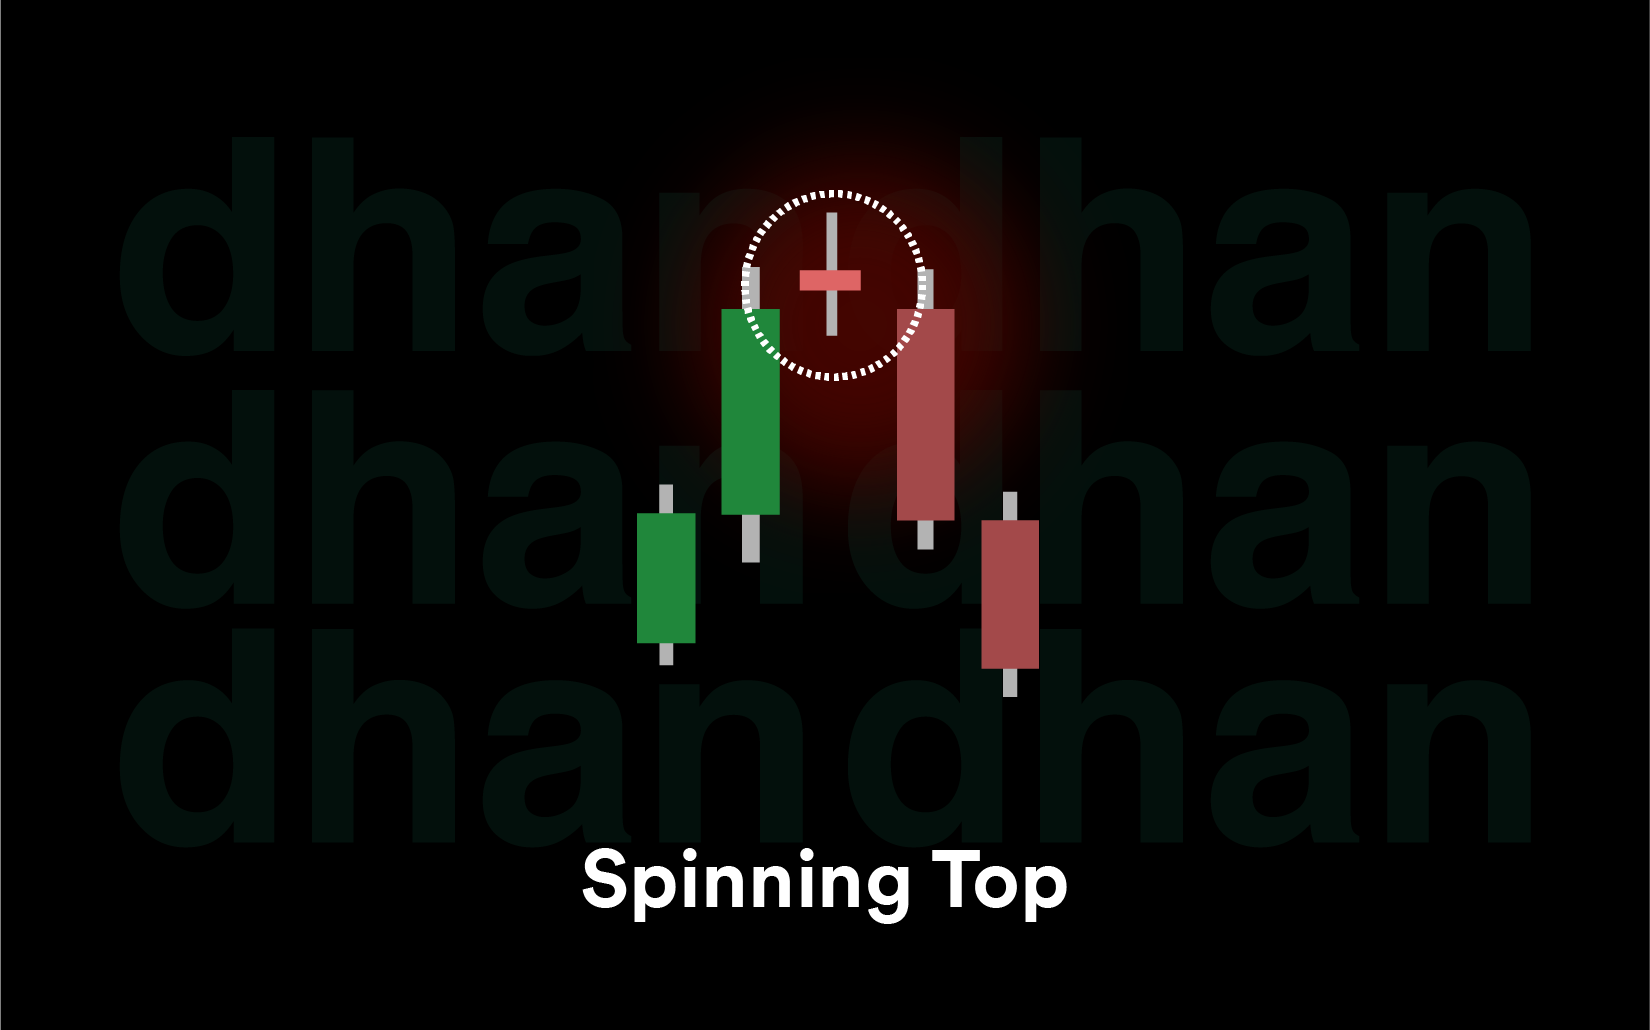
22. Spinning Top
A Spinning Top candlestick represents exhaustion when formed after a strong trend. It has a small body with upper and lower shadows. It shows a balance between buyers and sellers. It usually appears before reversals or during consolidation phases.
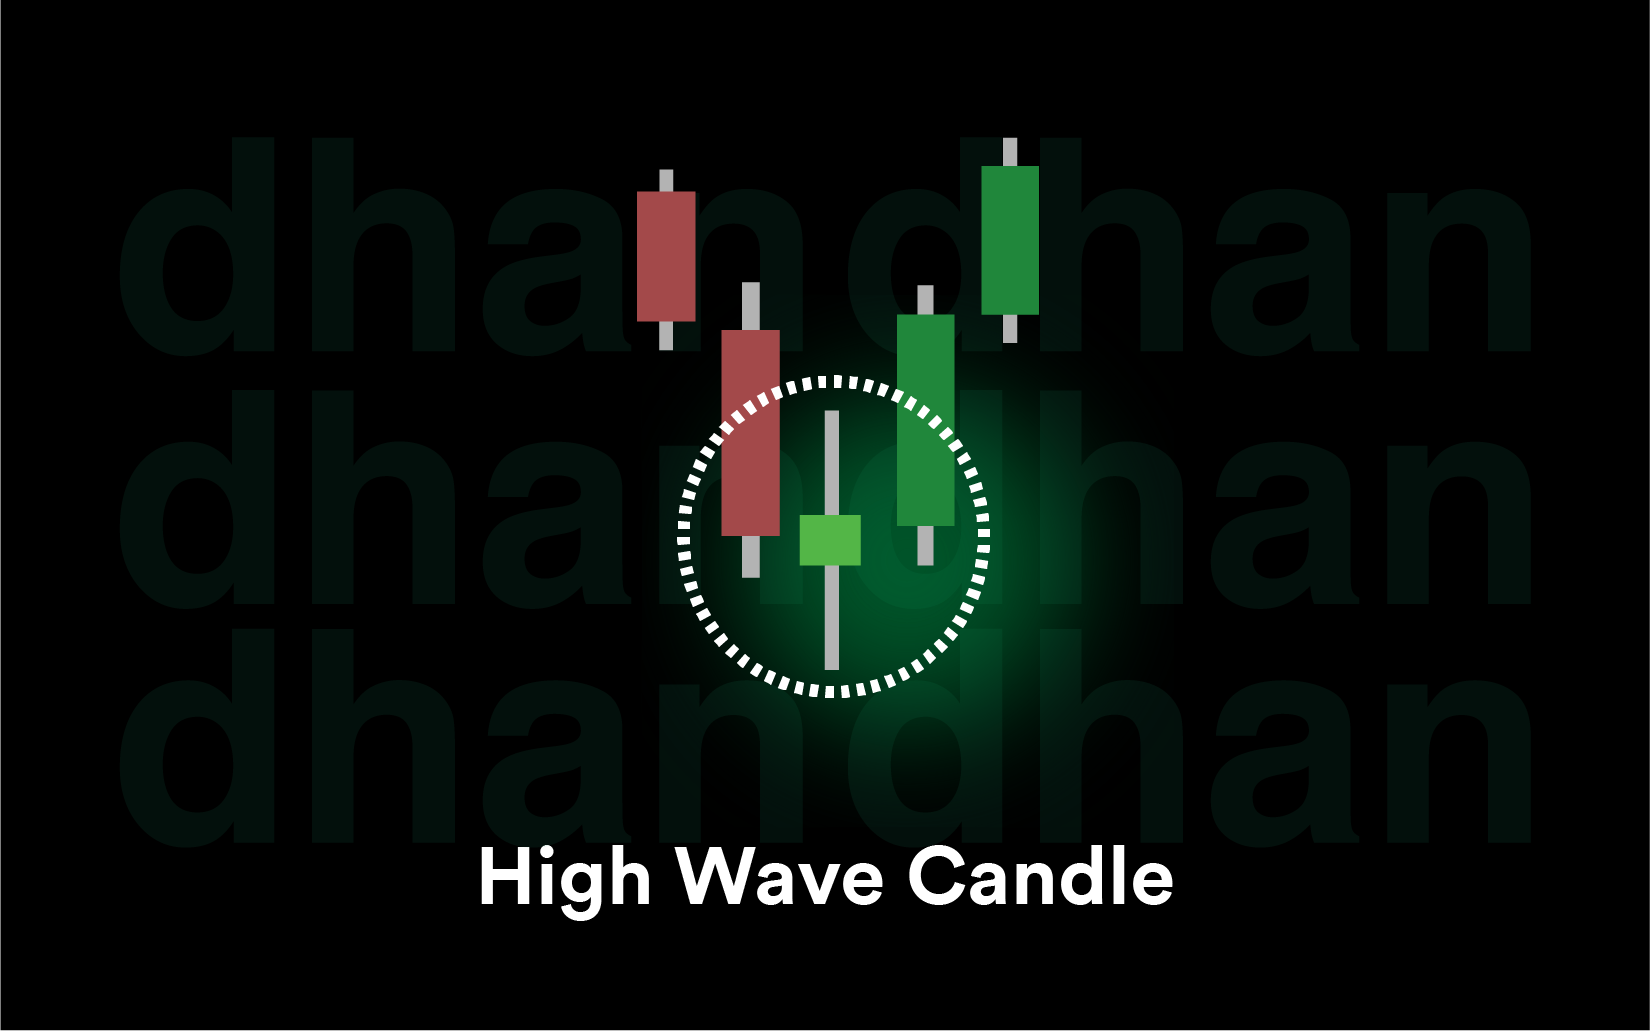
23. High Wave Candle
A High Wave candle pattern is similar to the Spinning Top pattern, but with very long shadows. It signals a high degree of volatility and uncertainty in the market.
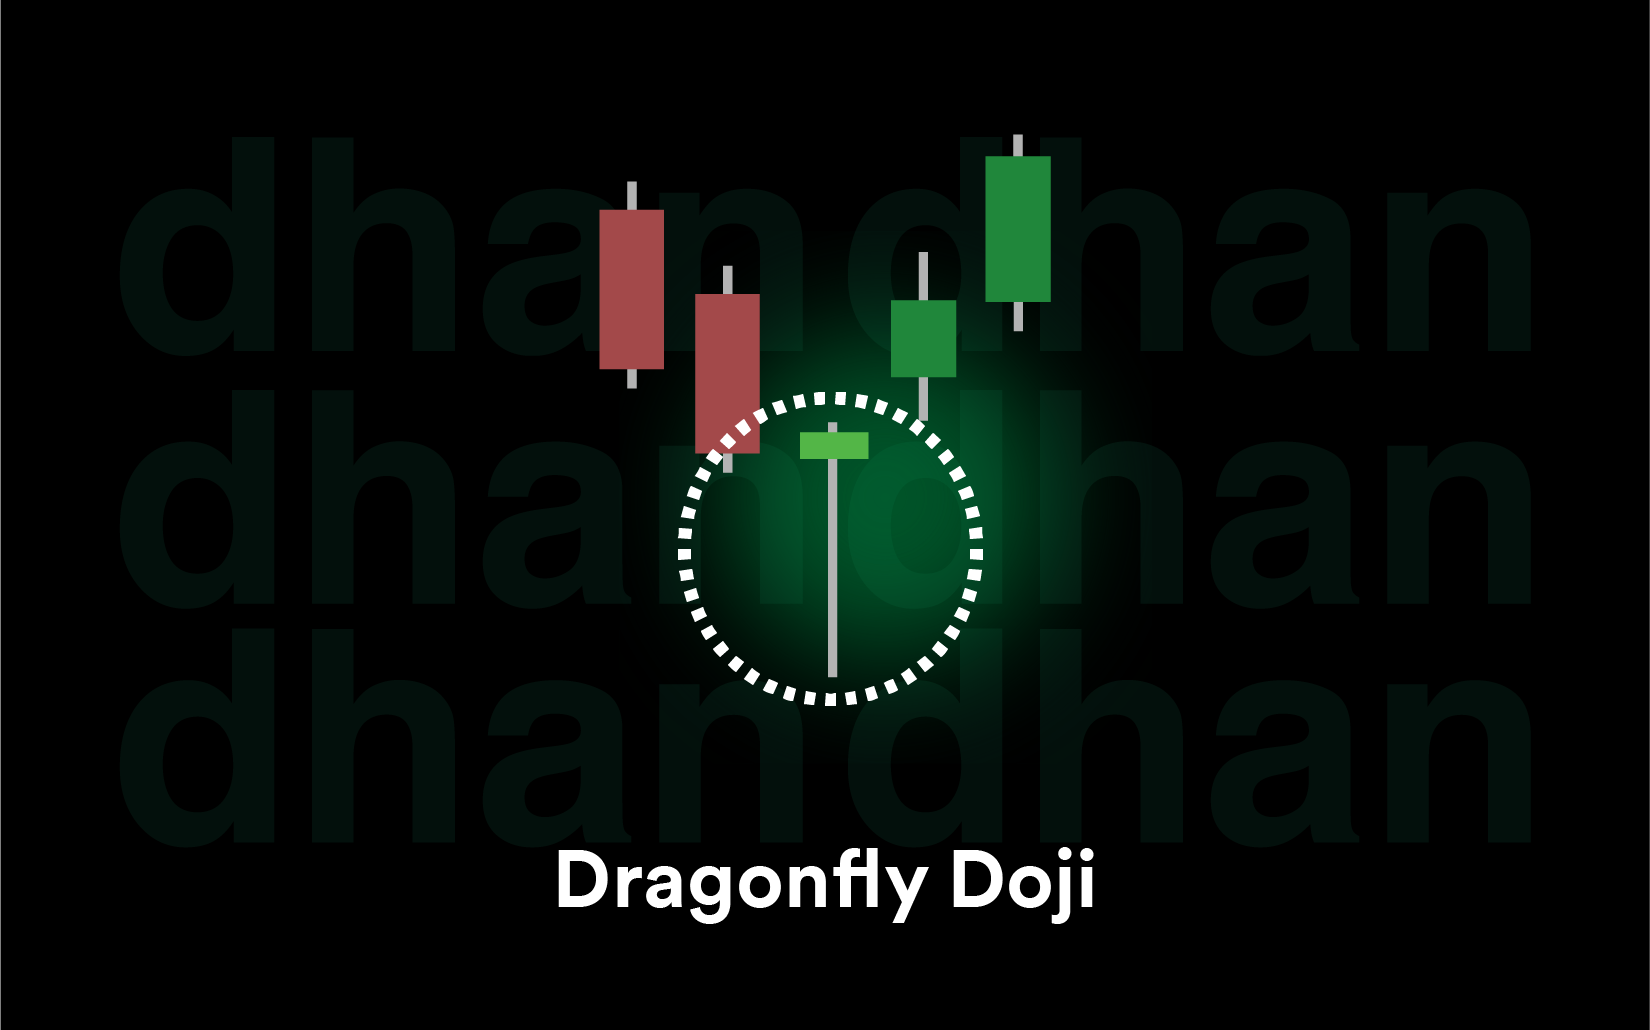
24. Dragonfly Doji
A Doji with a long lower shadow and no upper wick is called a Dragonfly Doji. It indicates a strong rejection of lower prices and a potential bullish reversal. This pattern is more reliable when formed near support zone.
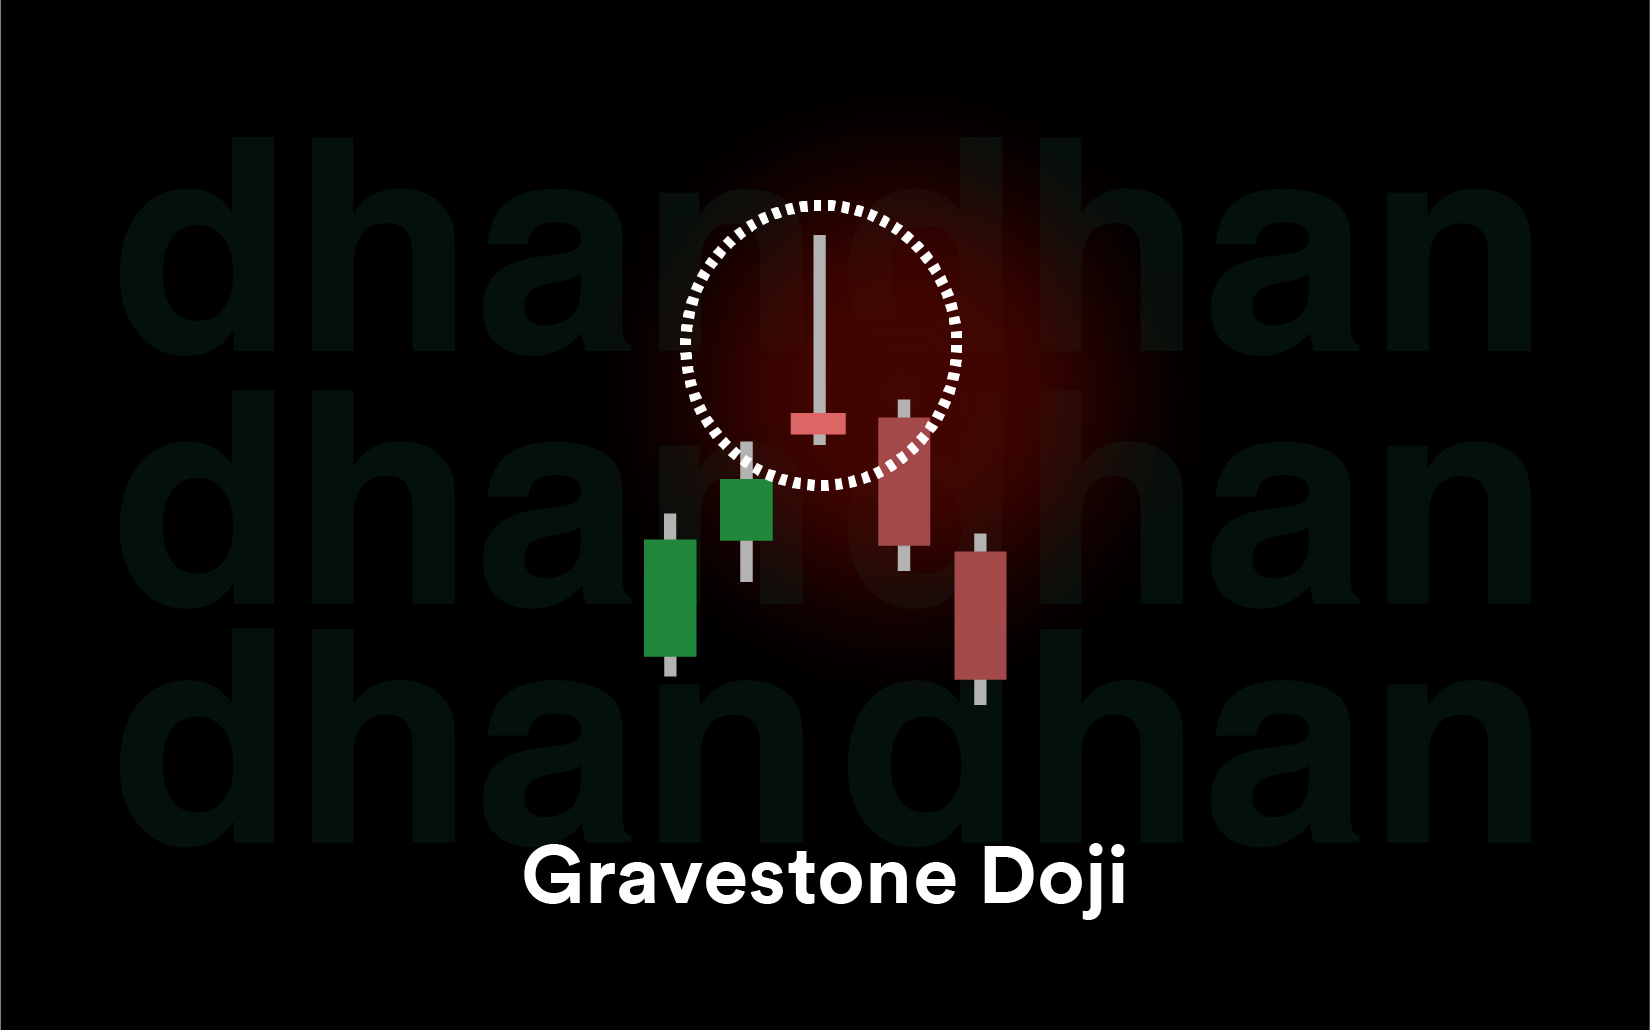
25. Gravestone Doji
The Gravestone Doji is a bearish reversal candlestick pattern that usually appears at the top of an uptrend. It signals a strong rejection of higher prices and indicates that buying momentum may be weakening.
26. Piercing Line
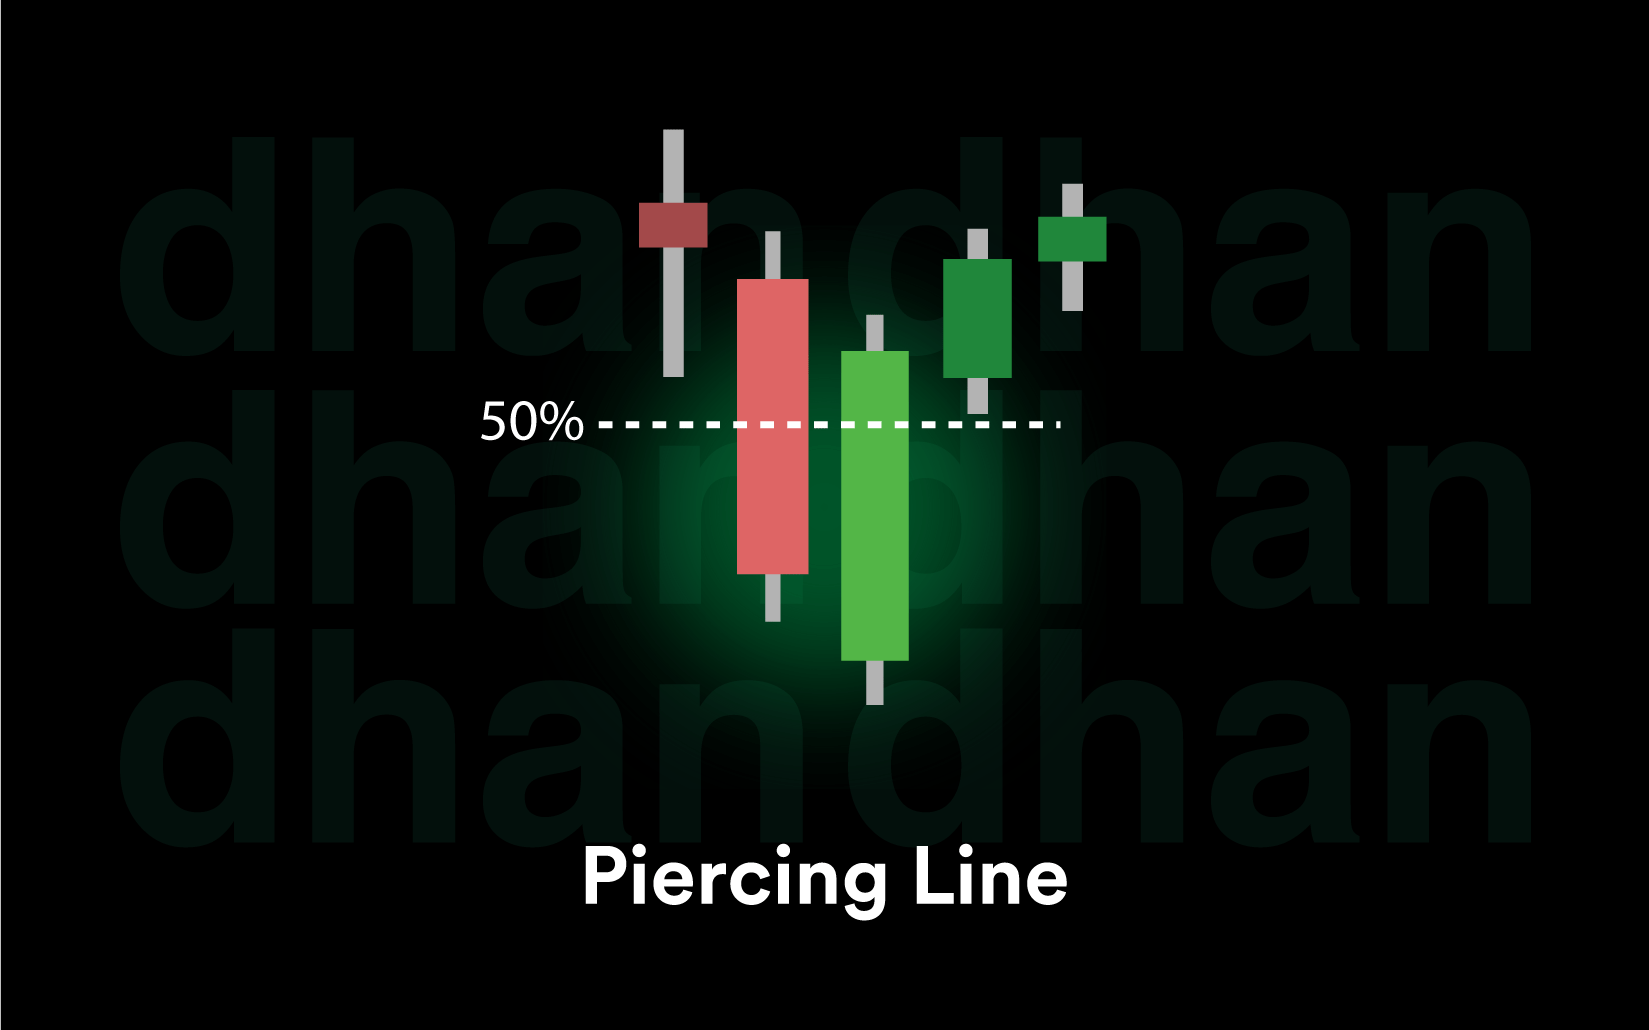
The Piercing pattern is a two-candle bullish reversal pattern that appears after a downtrend. The first candlestick is a strong red candle. The second candle opens below the previous low but closes above the midpoint of the first candle’s body. It shows that buyers are stepping in aggressively after heavy selling pressure. The pattern becomes more reliable when it forms near strong support levels.
27. Dark Cloud Cover
The first candle in a Dark Cloud Cover pattern is a strong bullish candle, and the second candle opens above the previous high but closes below the midpoint of the bullish candle. It indicates that sellers are gaining control after buyers initially pushed prices higher. The pattern is stronger when it appears near resistance zones.

28. Tweezer Bottom
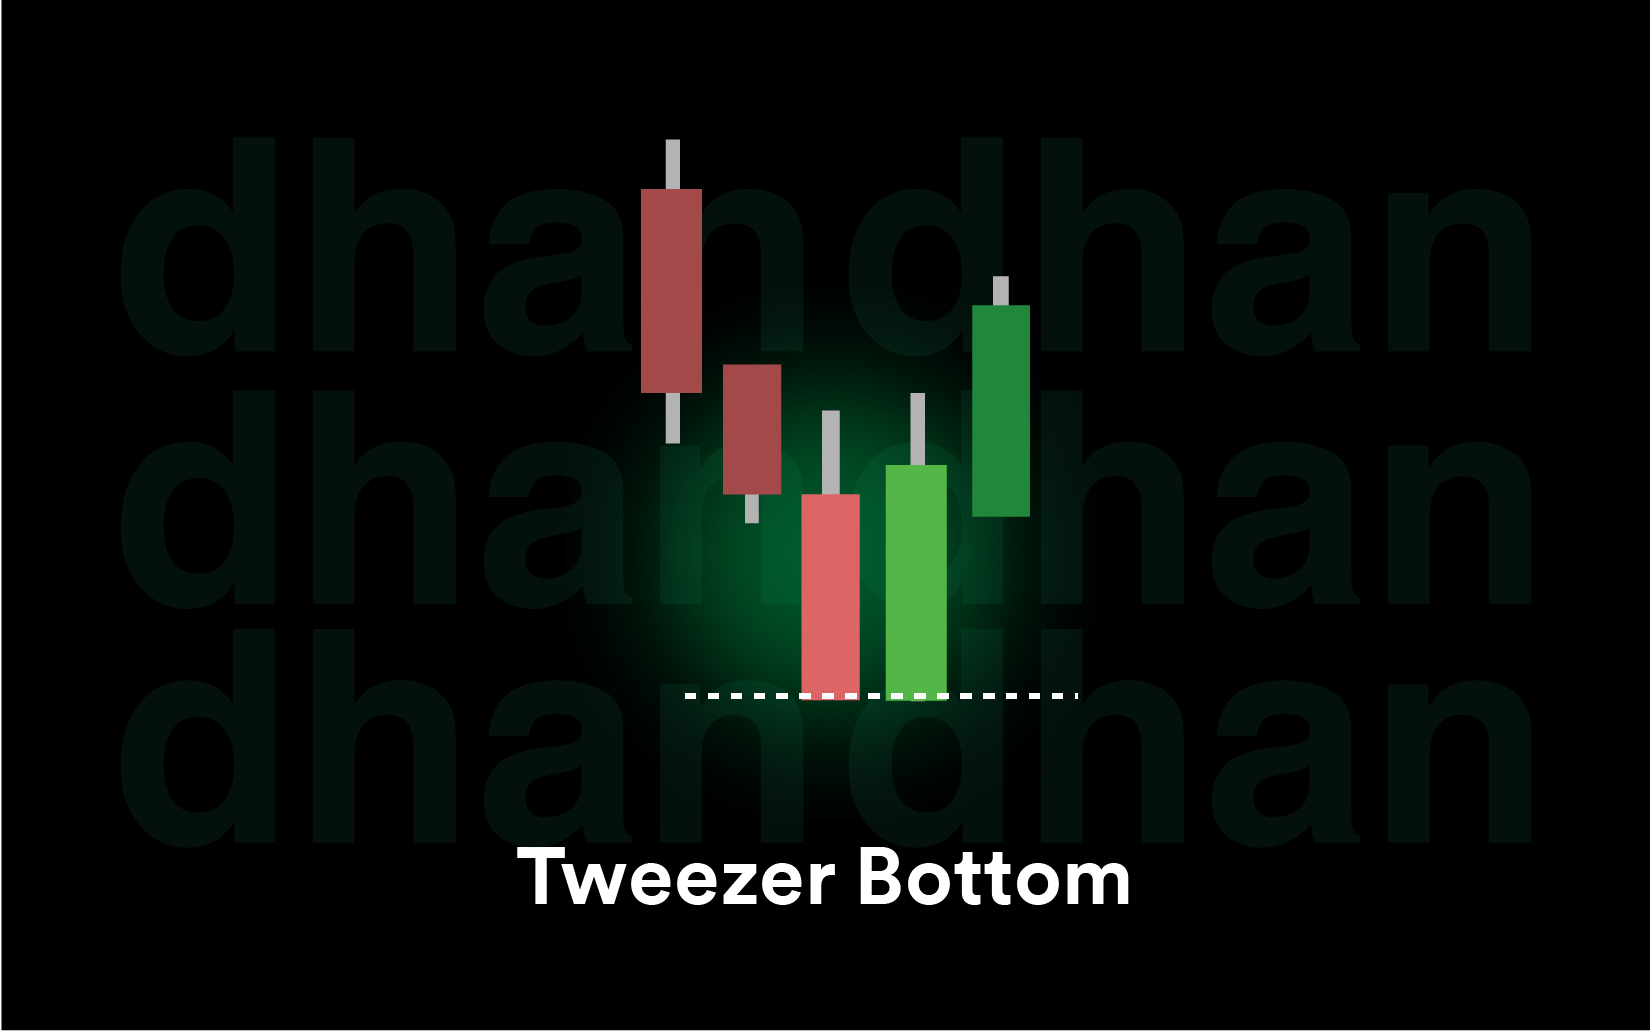
The Tweezer Bottom candle pattern consists of two candles with nearly the same low. The first candle is bearish, followed by a bullish candle. This pattern indicates that sellers attempted to push prices lower twice but failed, suggesting strong support at that level. It is a bullish reversal pattern that usually appears after a downtrend.
29. Tweezer Top
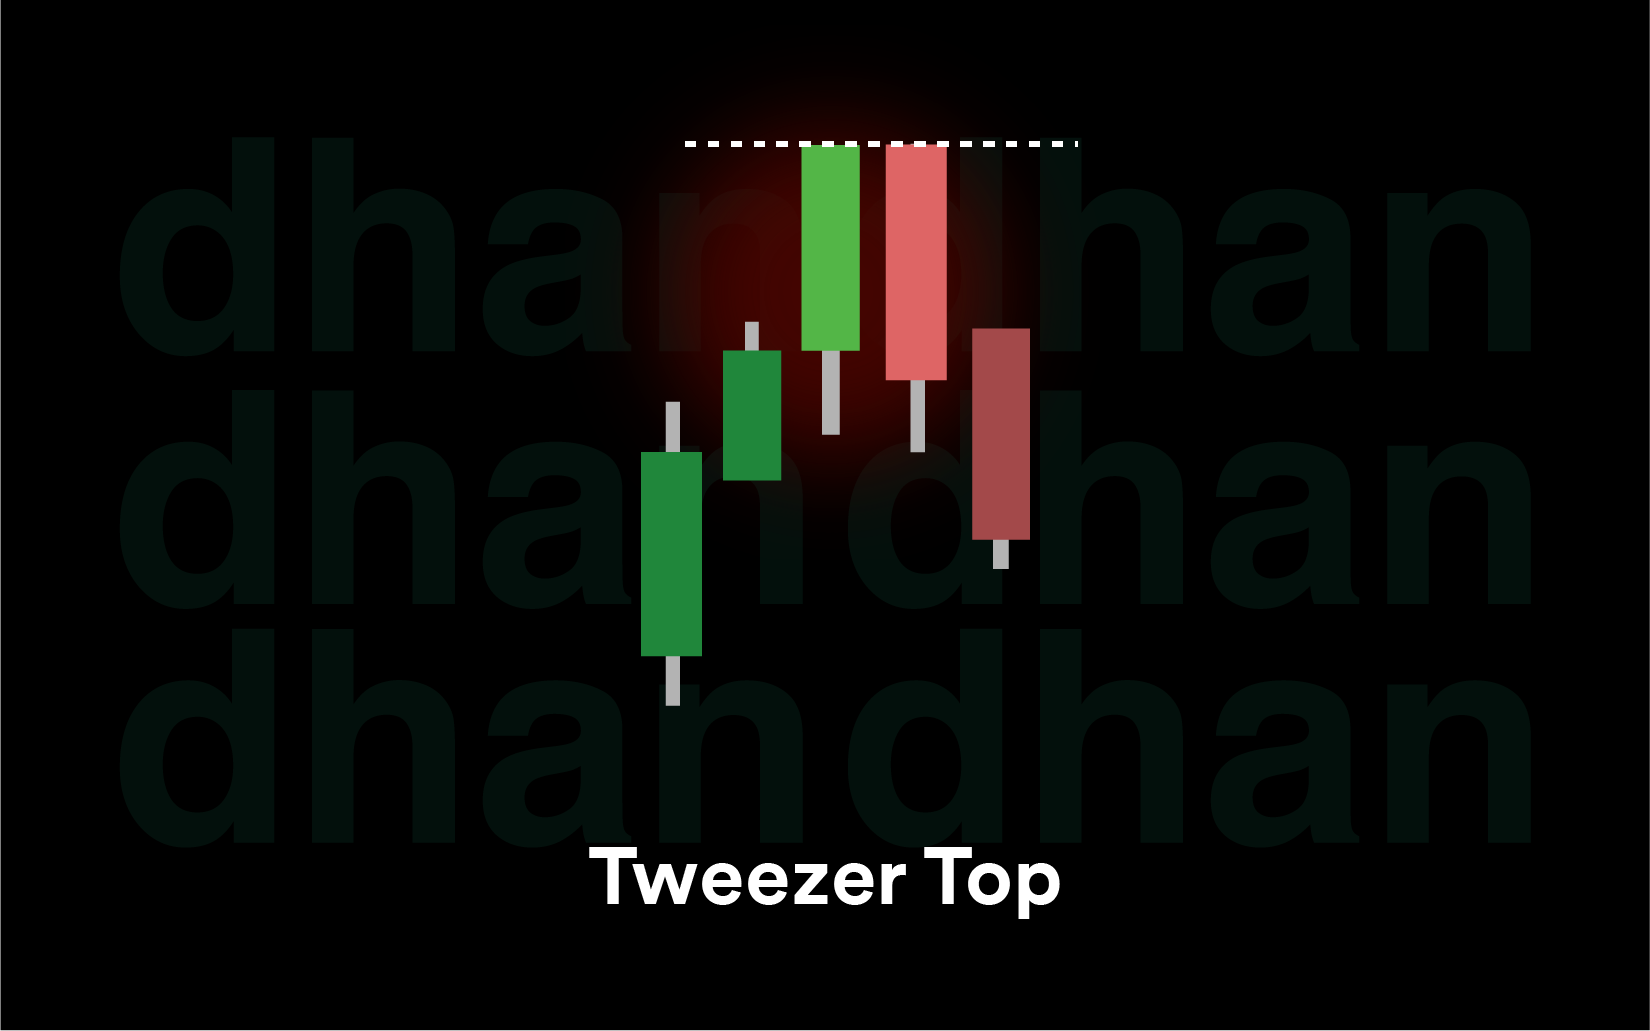
The Tweezer Top is a bearish reversal pattern that appears after an uptrend. It consists of two candles that have nearly identical highs. The first candle is bullish, followed by a bearish candle. This pattern indicates that buyers failed to break above a certain price level, suggesting strong resistance and a potential downward reversal.
30. Bearish Harami
The Bearish Harami is a bearish reversal pattern that appears after an uptrend. The first candle is a large bullish candle with a subsequent smaller bearish candle that forms within the body of the previous candle. This pattern suggests that buying momentum is slowing down, and a potential bearish reversal may occur.

31. Bullish Harami
The Bullish Harami Pattern is a two candle bullish reversal pattern that forms after a downtrend. The first candle is a large bearish candle, followed by a smaller bullish candle that forms completely within the body of the previous candle. It shows that the selling momentum is weakening, and buyers may start gaining control.

32. Kicking Pattern
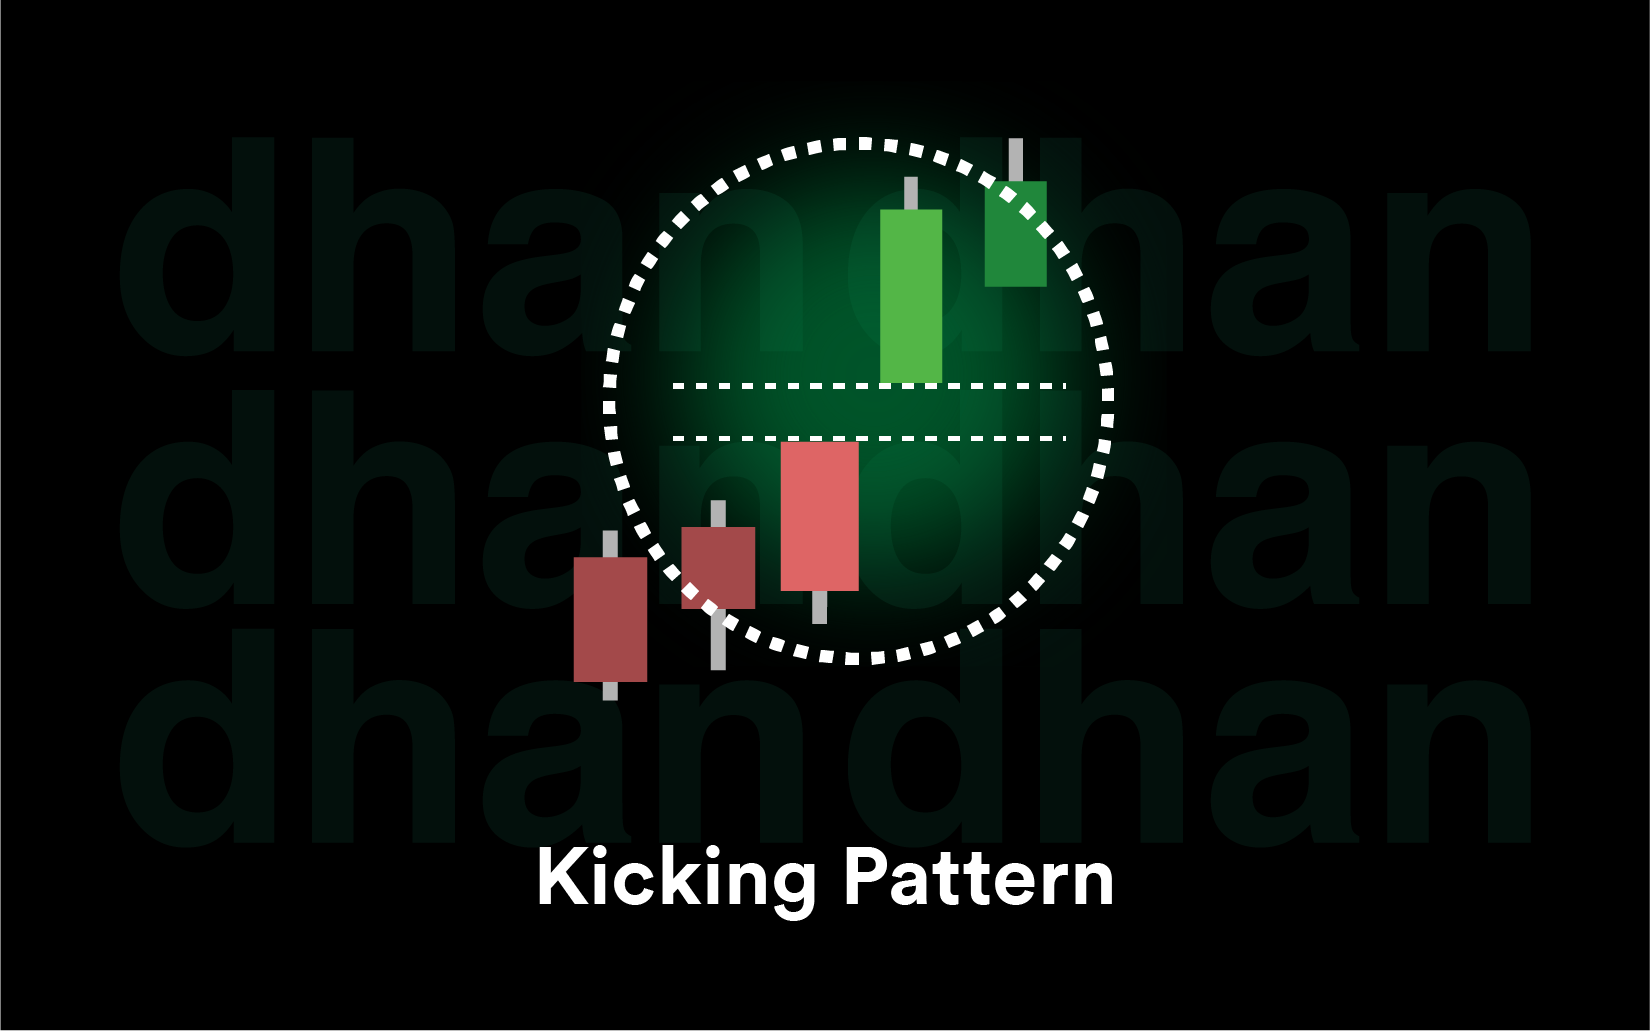
This pattern consists of two Marubozu candles with a gap between them. The first candle follows the existing trend, while the second candle gaps in the opposite direction and continues strongly. It is a strong reversal pattern.
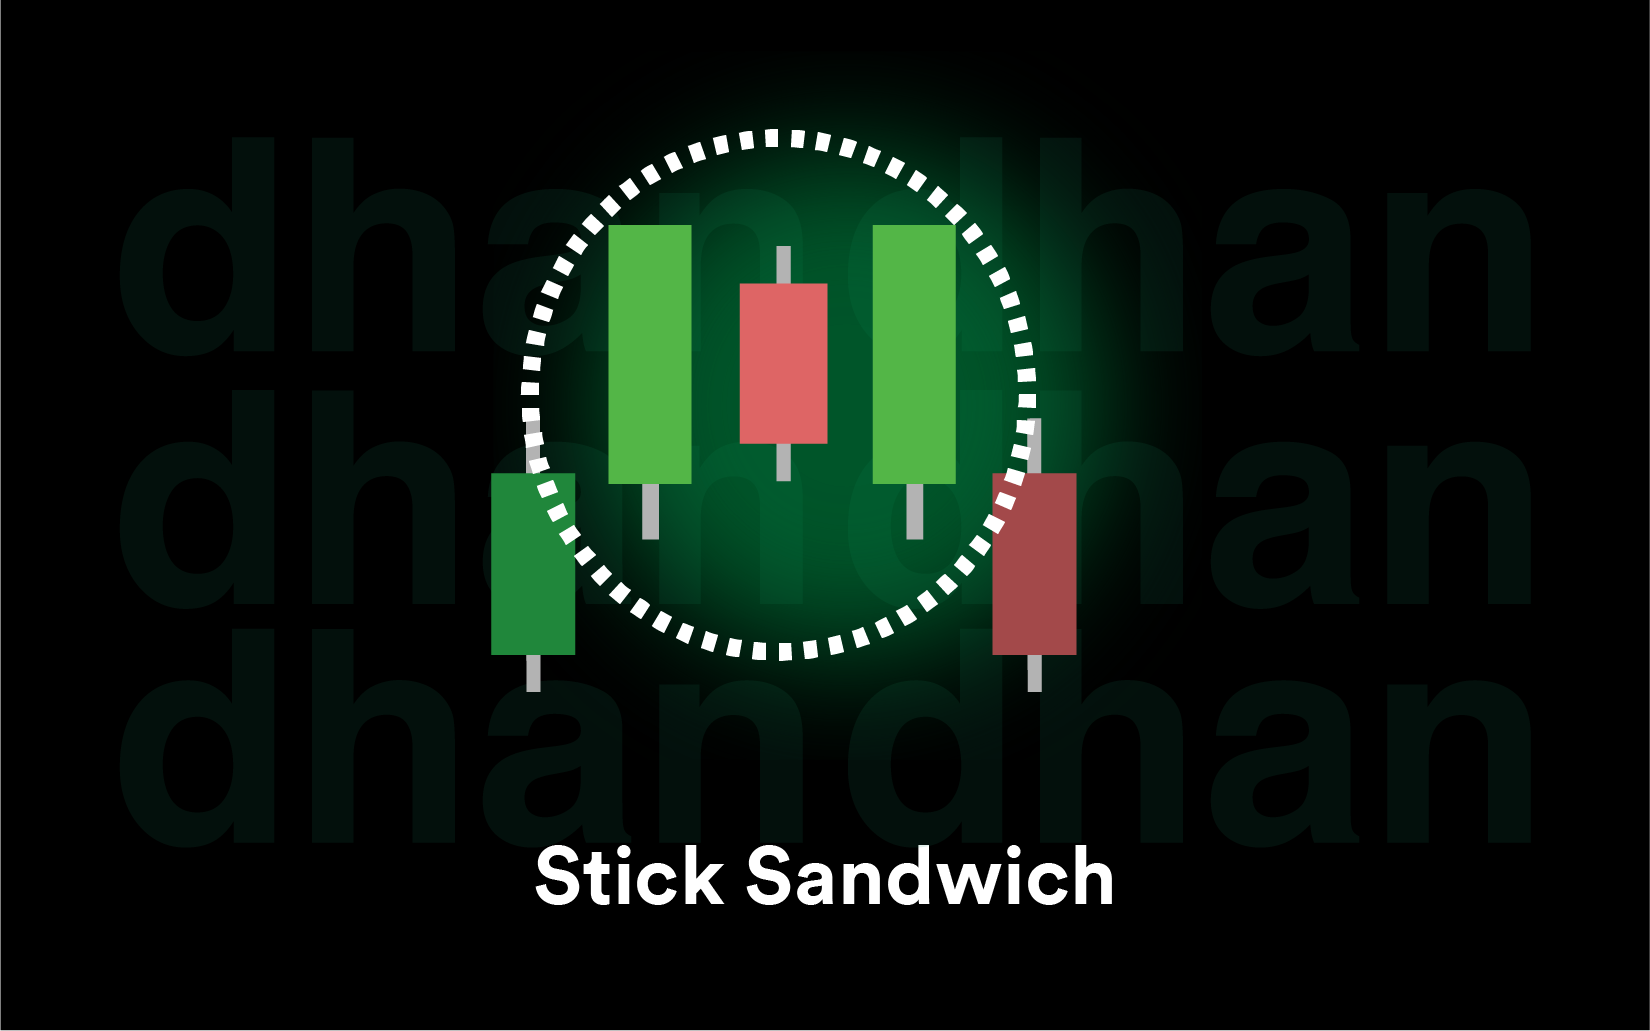
33. Stick Sandwich
The Stick Sandwich is a three candle bullish reversal pattern. It consists of a bearish candle followed by a bullish candle and then another bearish candle. The first and third candles close at nearly the same level. This pattern indicates that the market has found a strong support level. It usually appears after a downtrend.
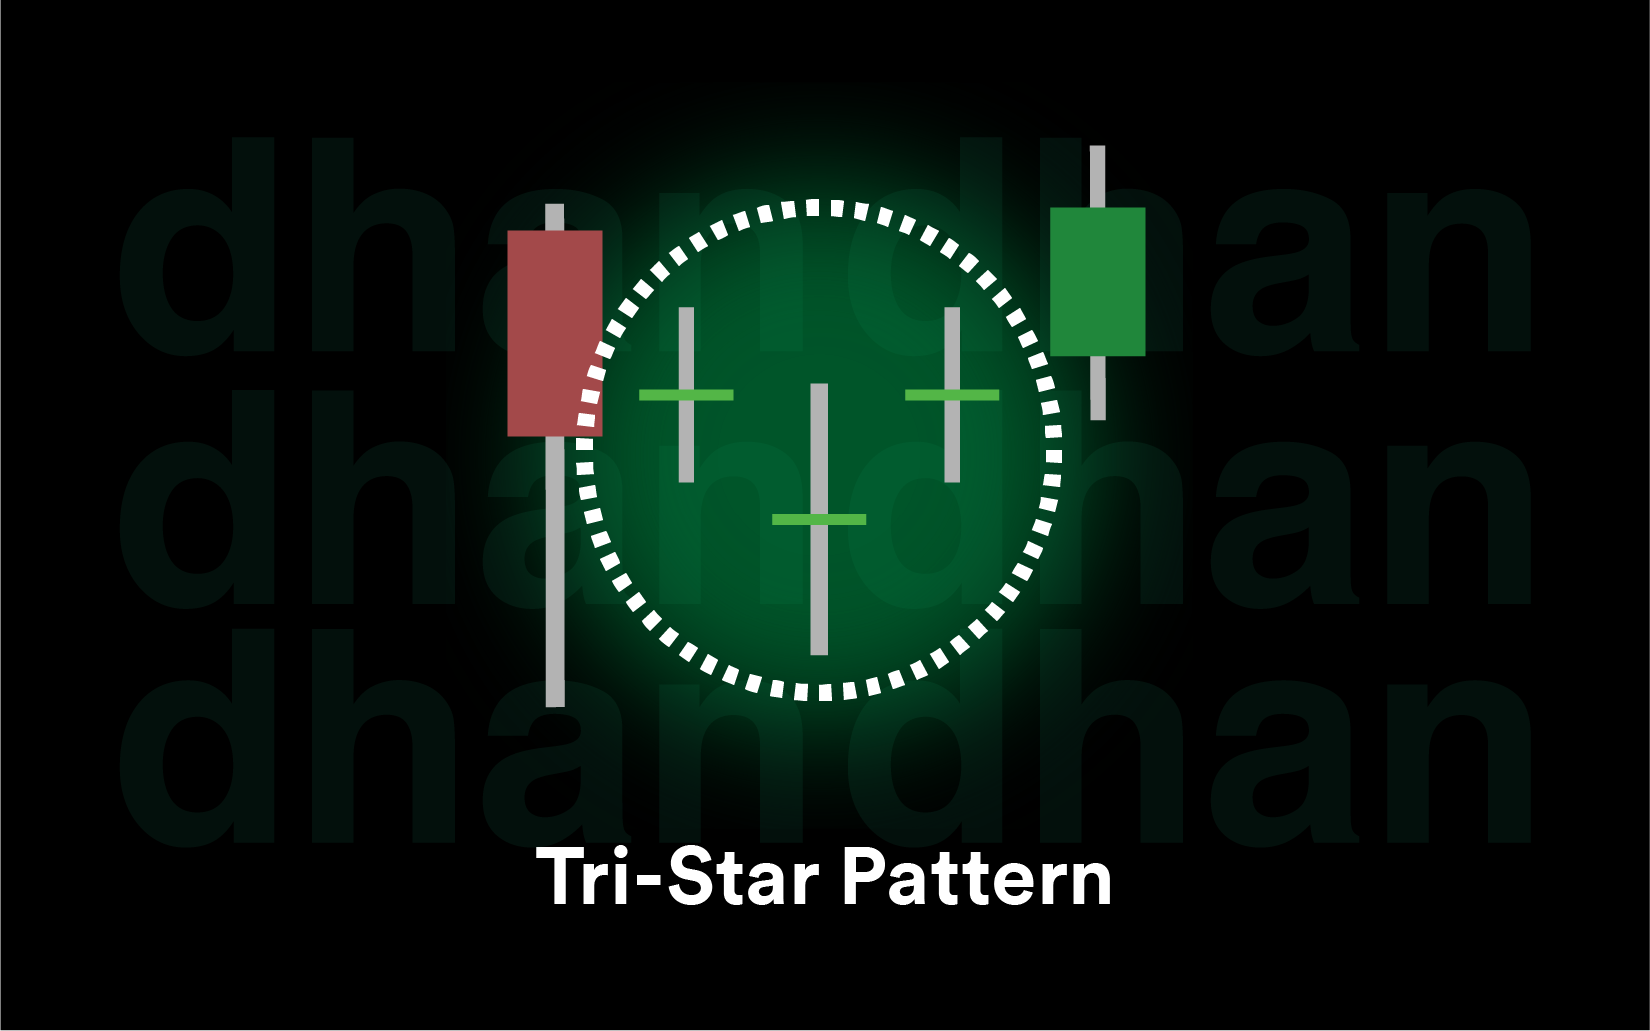
34. Tri-Star Pattern
The Stick Sandwich is a three candle bullish reversal pattern. It consists of a bearish candle followed by a bullish candle and then another bearish candle. The first and third candles close at nearly the same level. This pattern indicates that the market has found a strong support level. It usually appears after a downtrend.
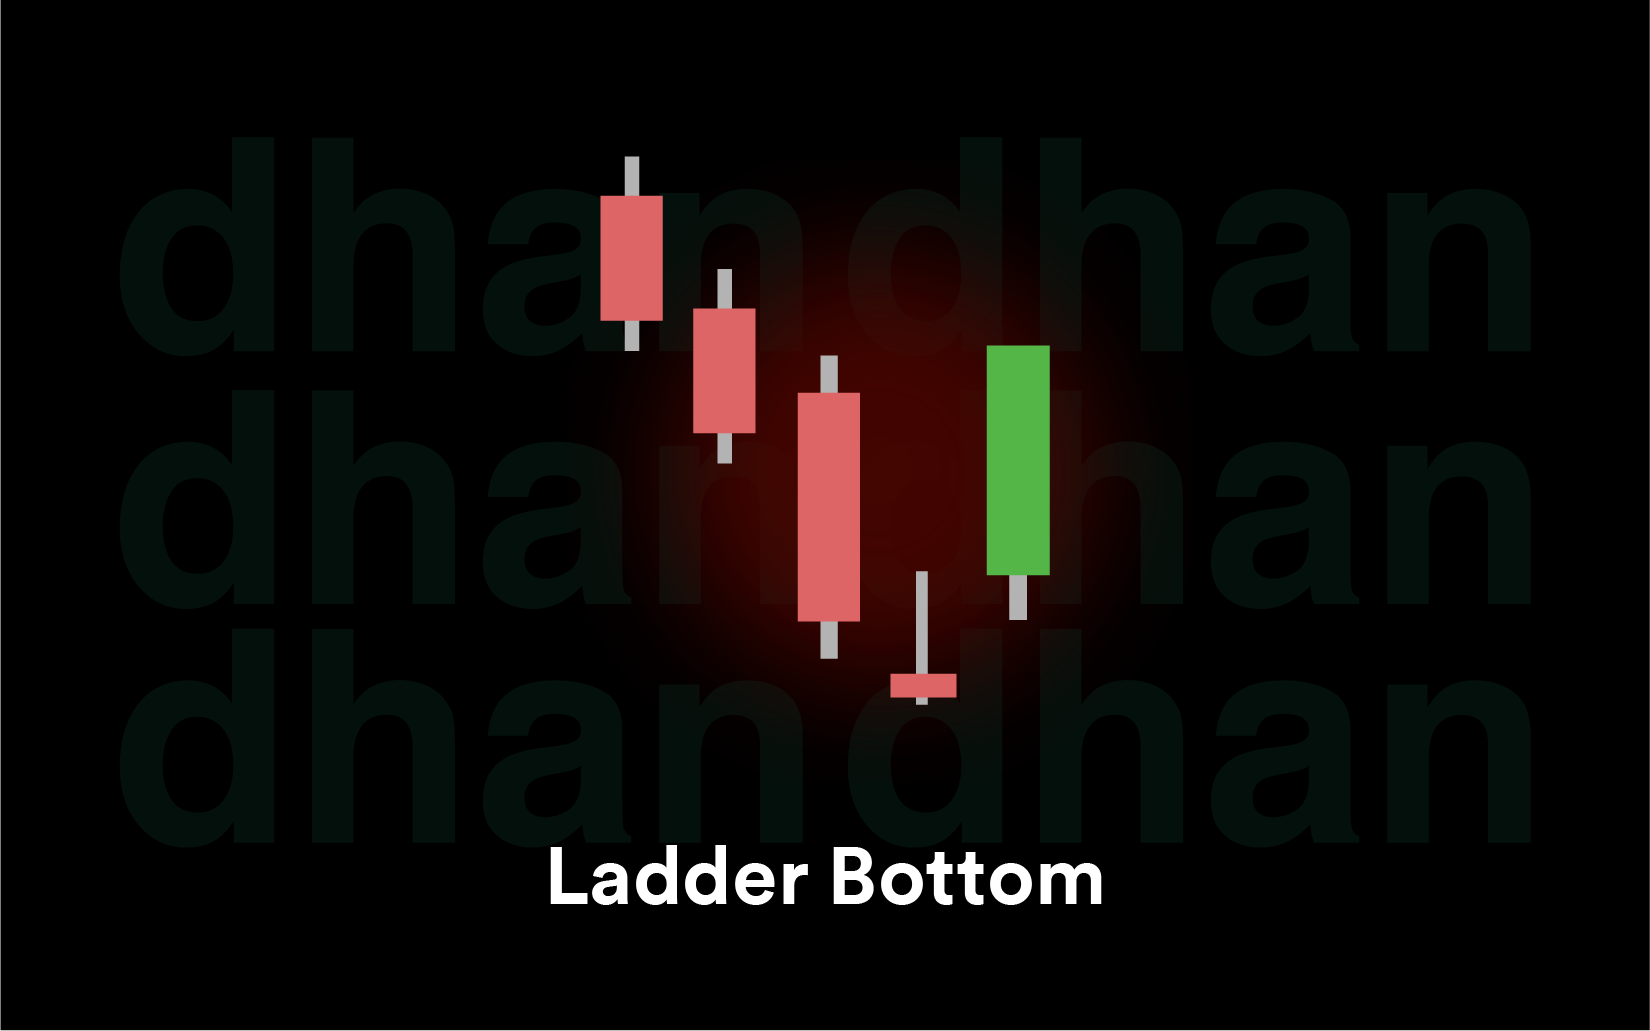
35. Ladder Bottom
The Ladder Bottom is a five candle bullish reversal pattern that appears after a strong downtrend. It starts with three consecutive bearish candles followed by a small bullish candle, and then a strong bullish candle. This pattern signals that sellers are losing momentum and buyers are beginning to take control.
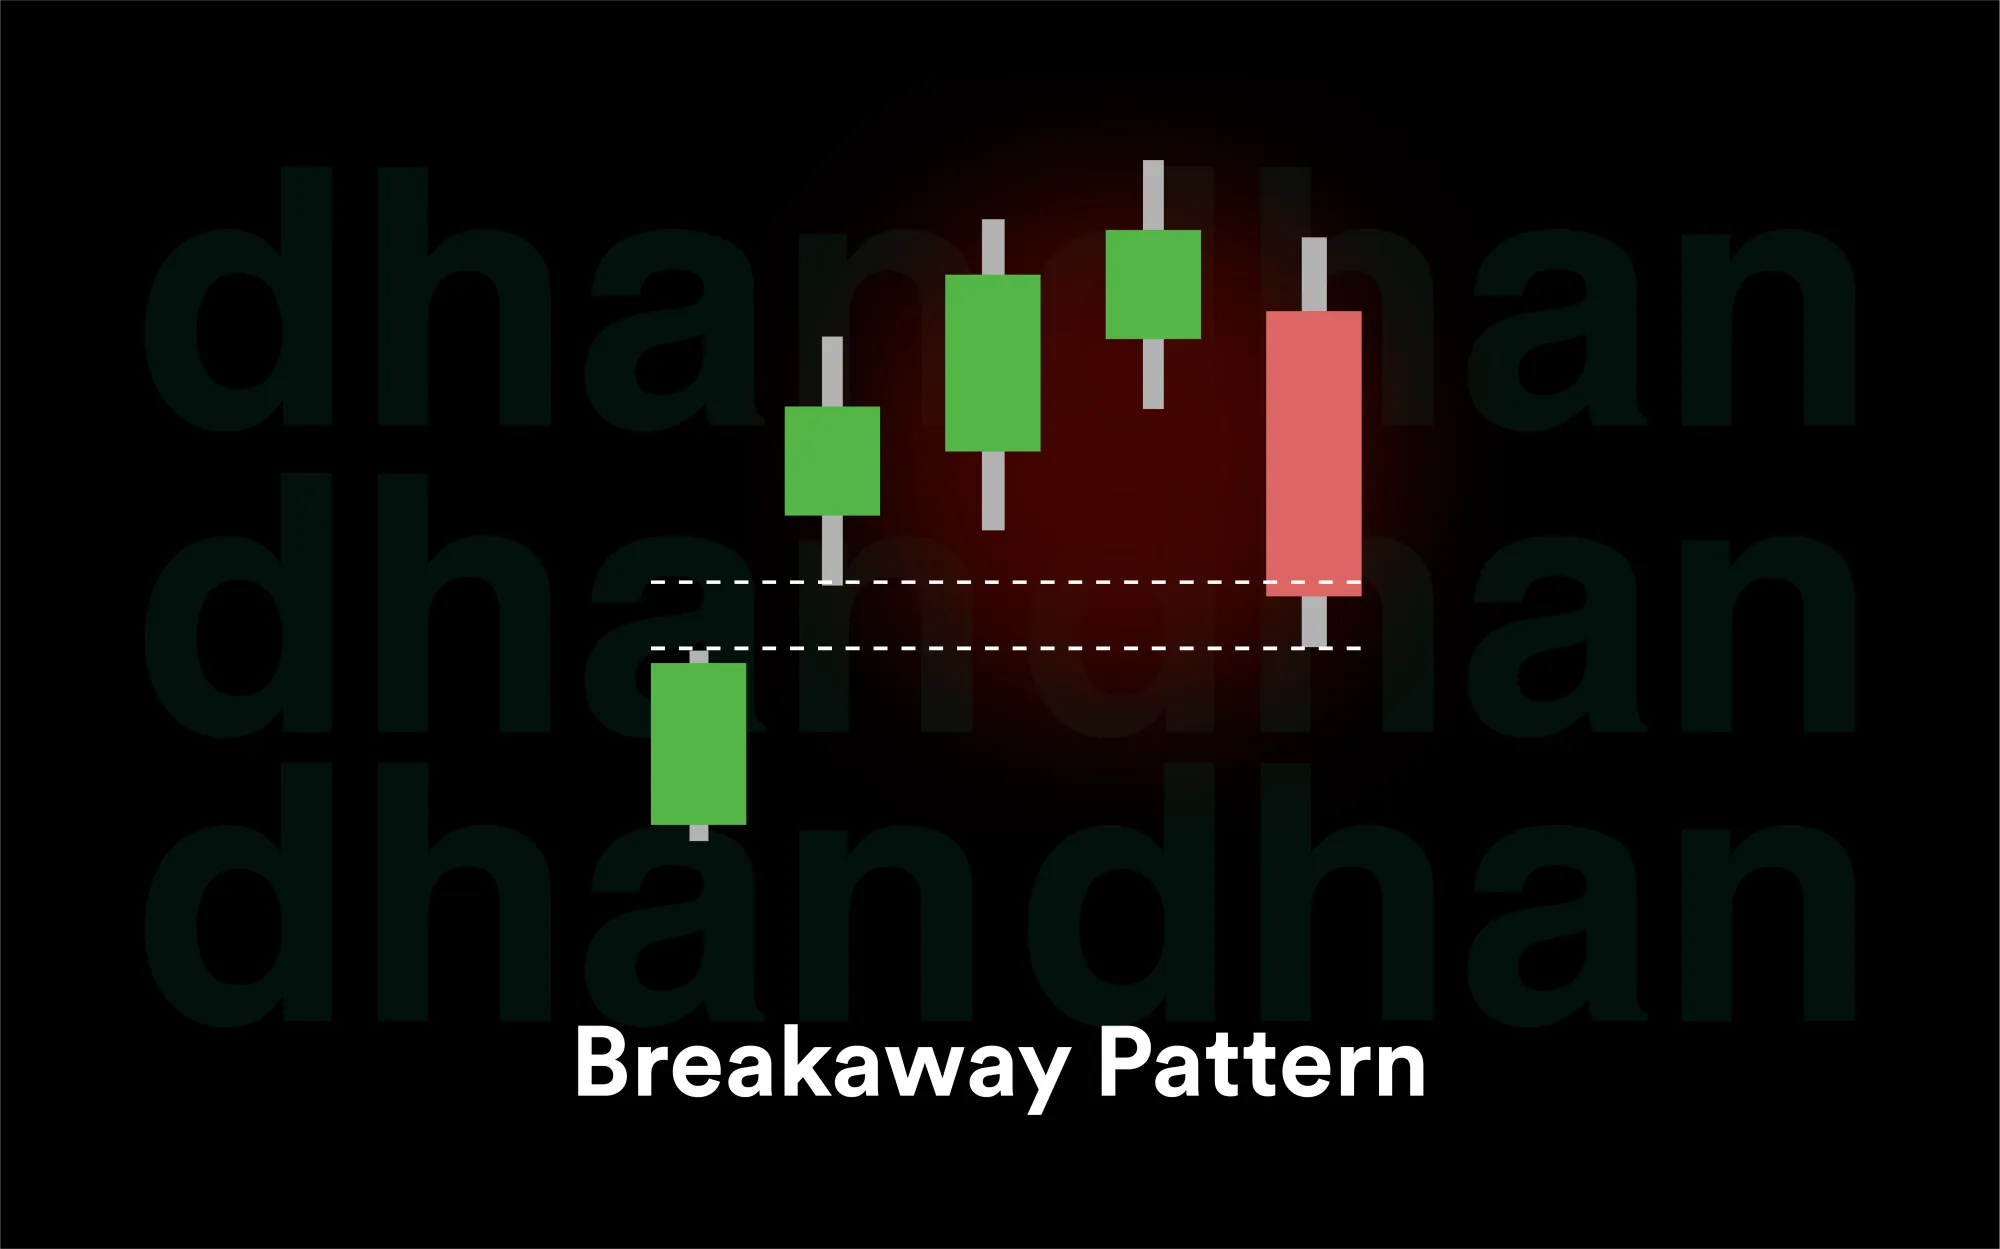
36. Breakaway
This pattern generally forms after an extended trend. The Breakaway Pattern is a five candle reversal pattern that can be bearish or bullish. It starts with a strong candle in the direction of the current trend, then the second candle opens with a gap and several continuation candles. A reversal is indicated by the final candle moving in the opposite direction.
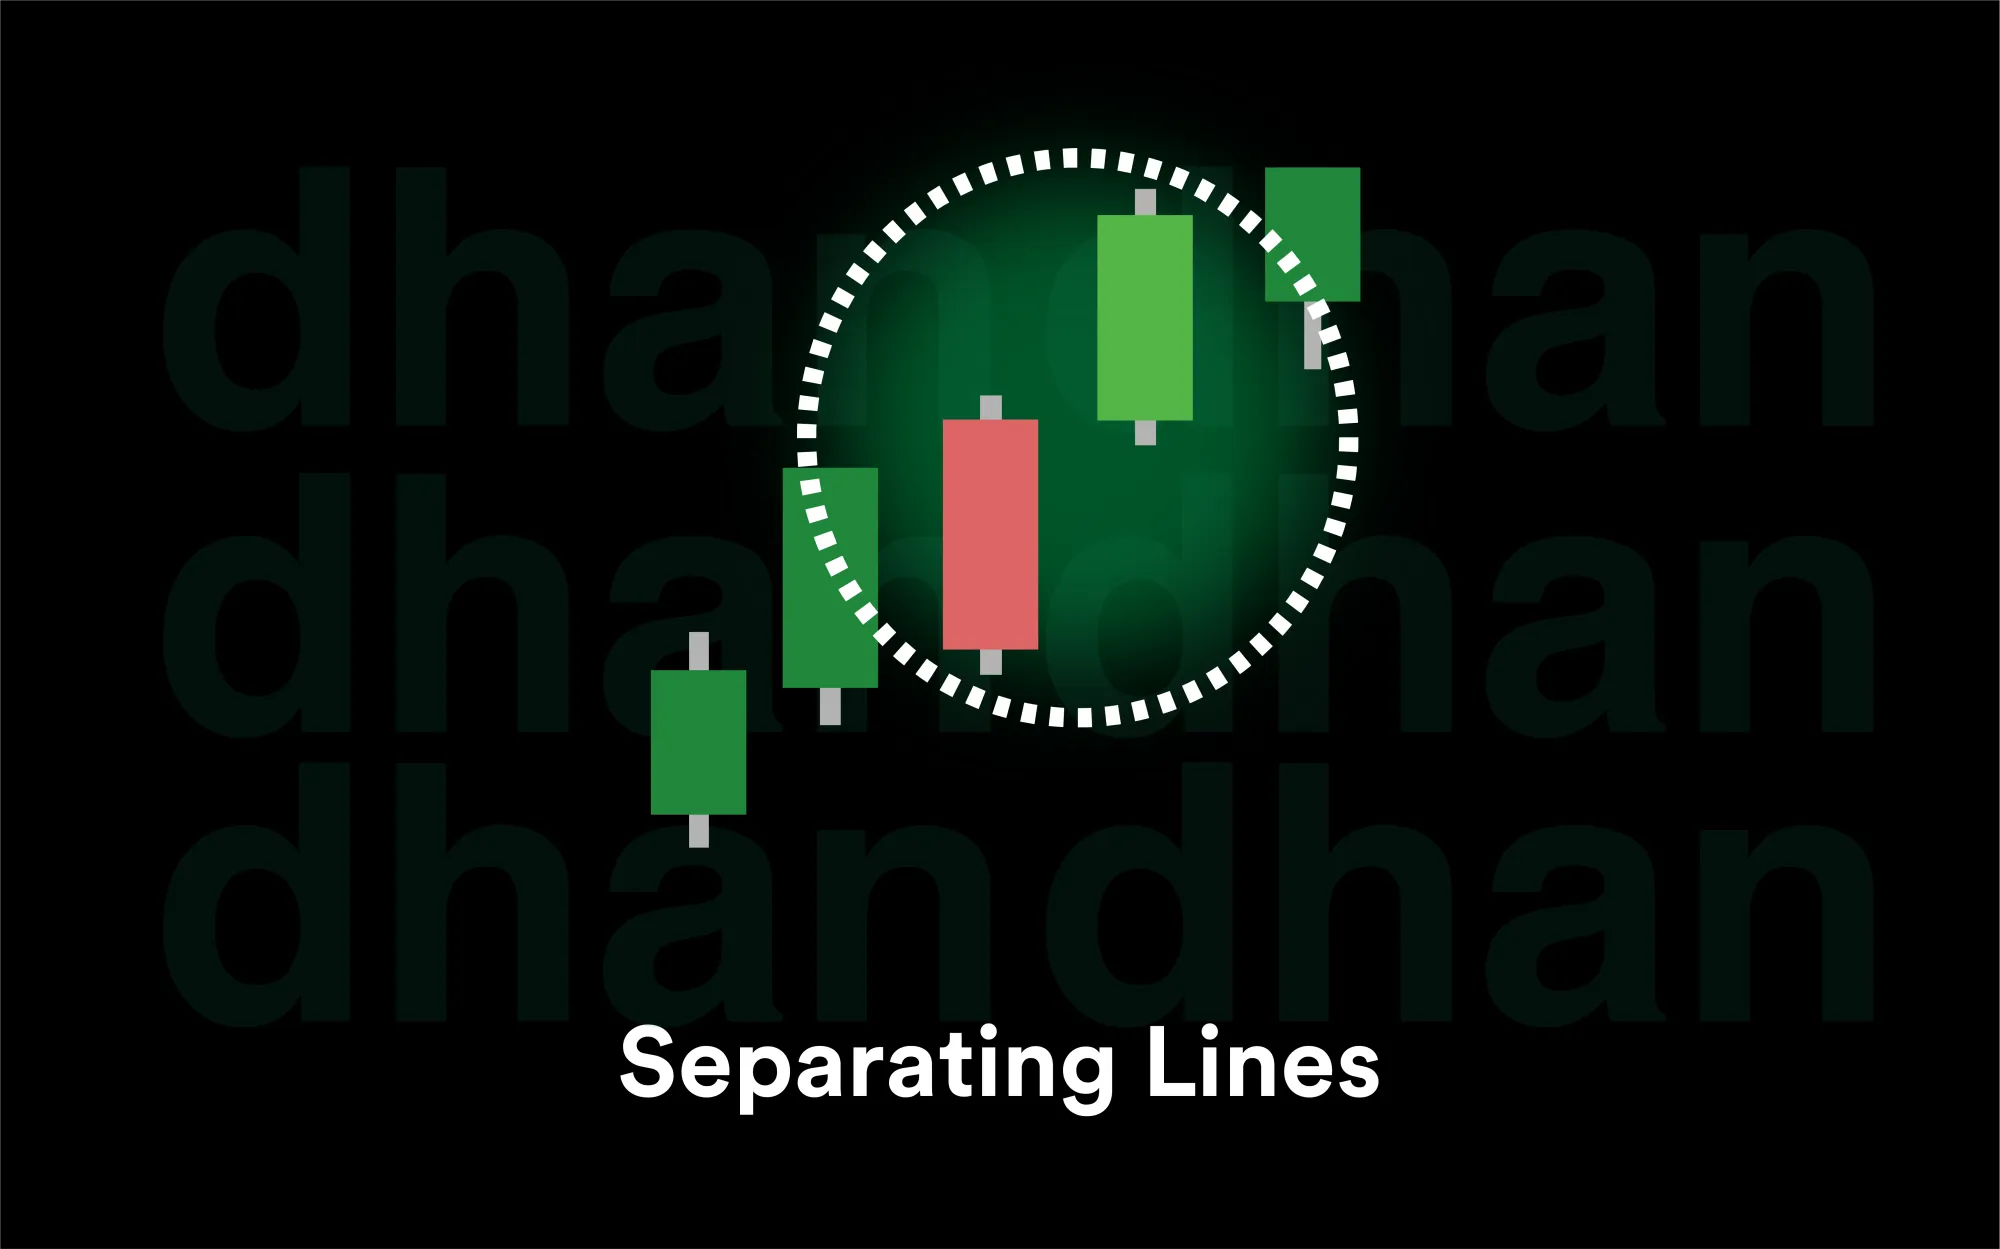
37. Separating Lines
The Separating Lines pattern is a continuation pattern consisting of two candles with the same opening price but opposite colours. In an uptrend, a bullish candle follows a bearish candle with the same open, indicating continuation of the uptrend. In a downtrend, a bearish candle follows a bullish candle, signalling continuation of the downtrend.
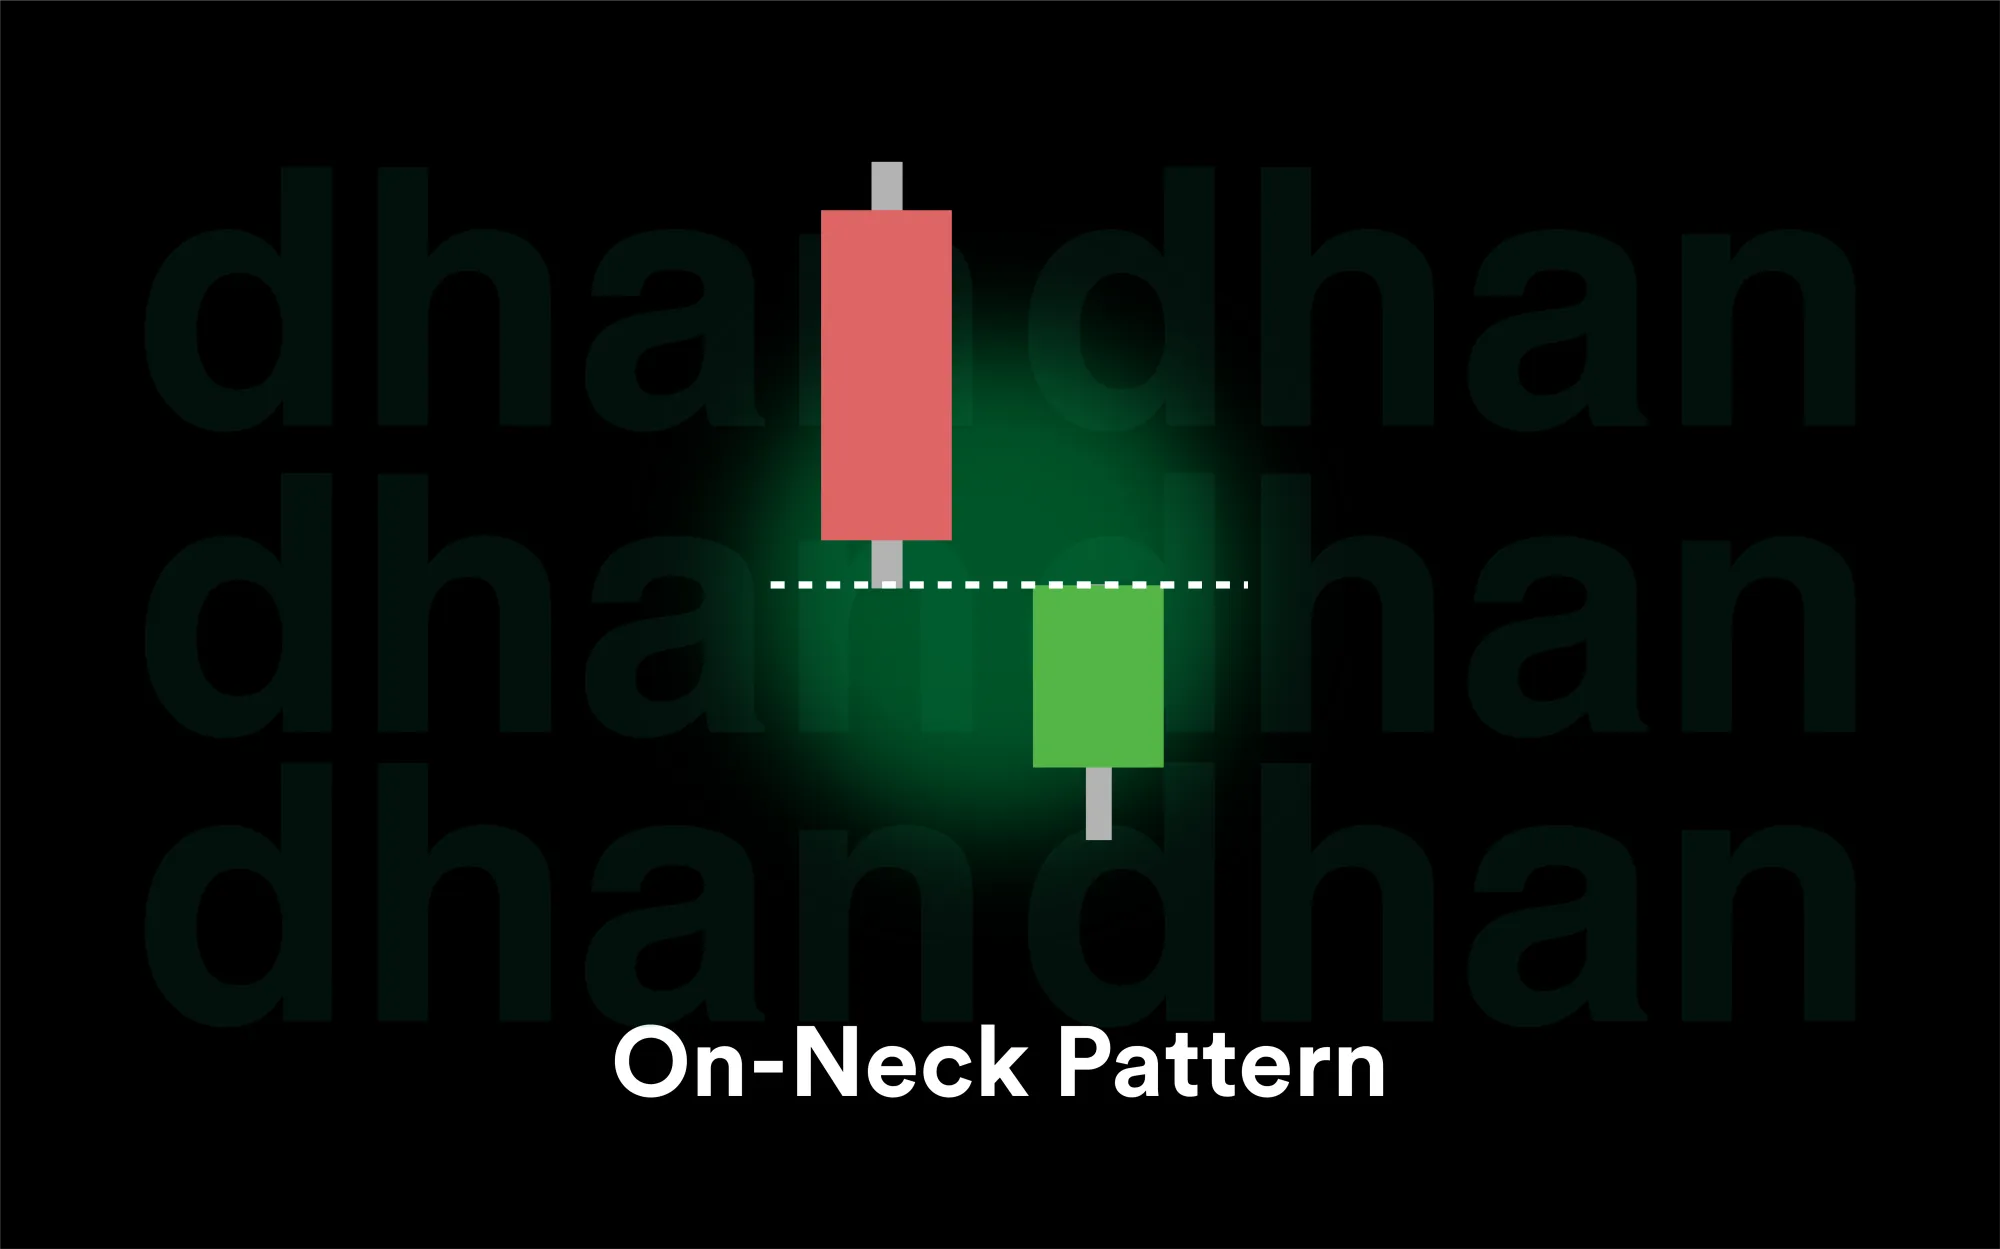
38. On-Neck Pattern
The On-Neck Pattern is a bearish continuation pattern that appears in a downtrend. It consists of a strong bearish candle followed by a small bullish candle that closes near the low of the previous candle. This pattern indicates that buyers attempted a small recovery, but selling pressure remains strong.
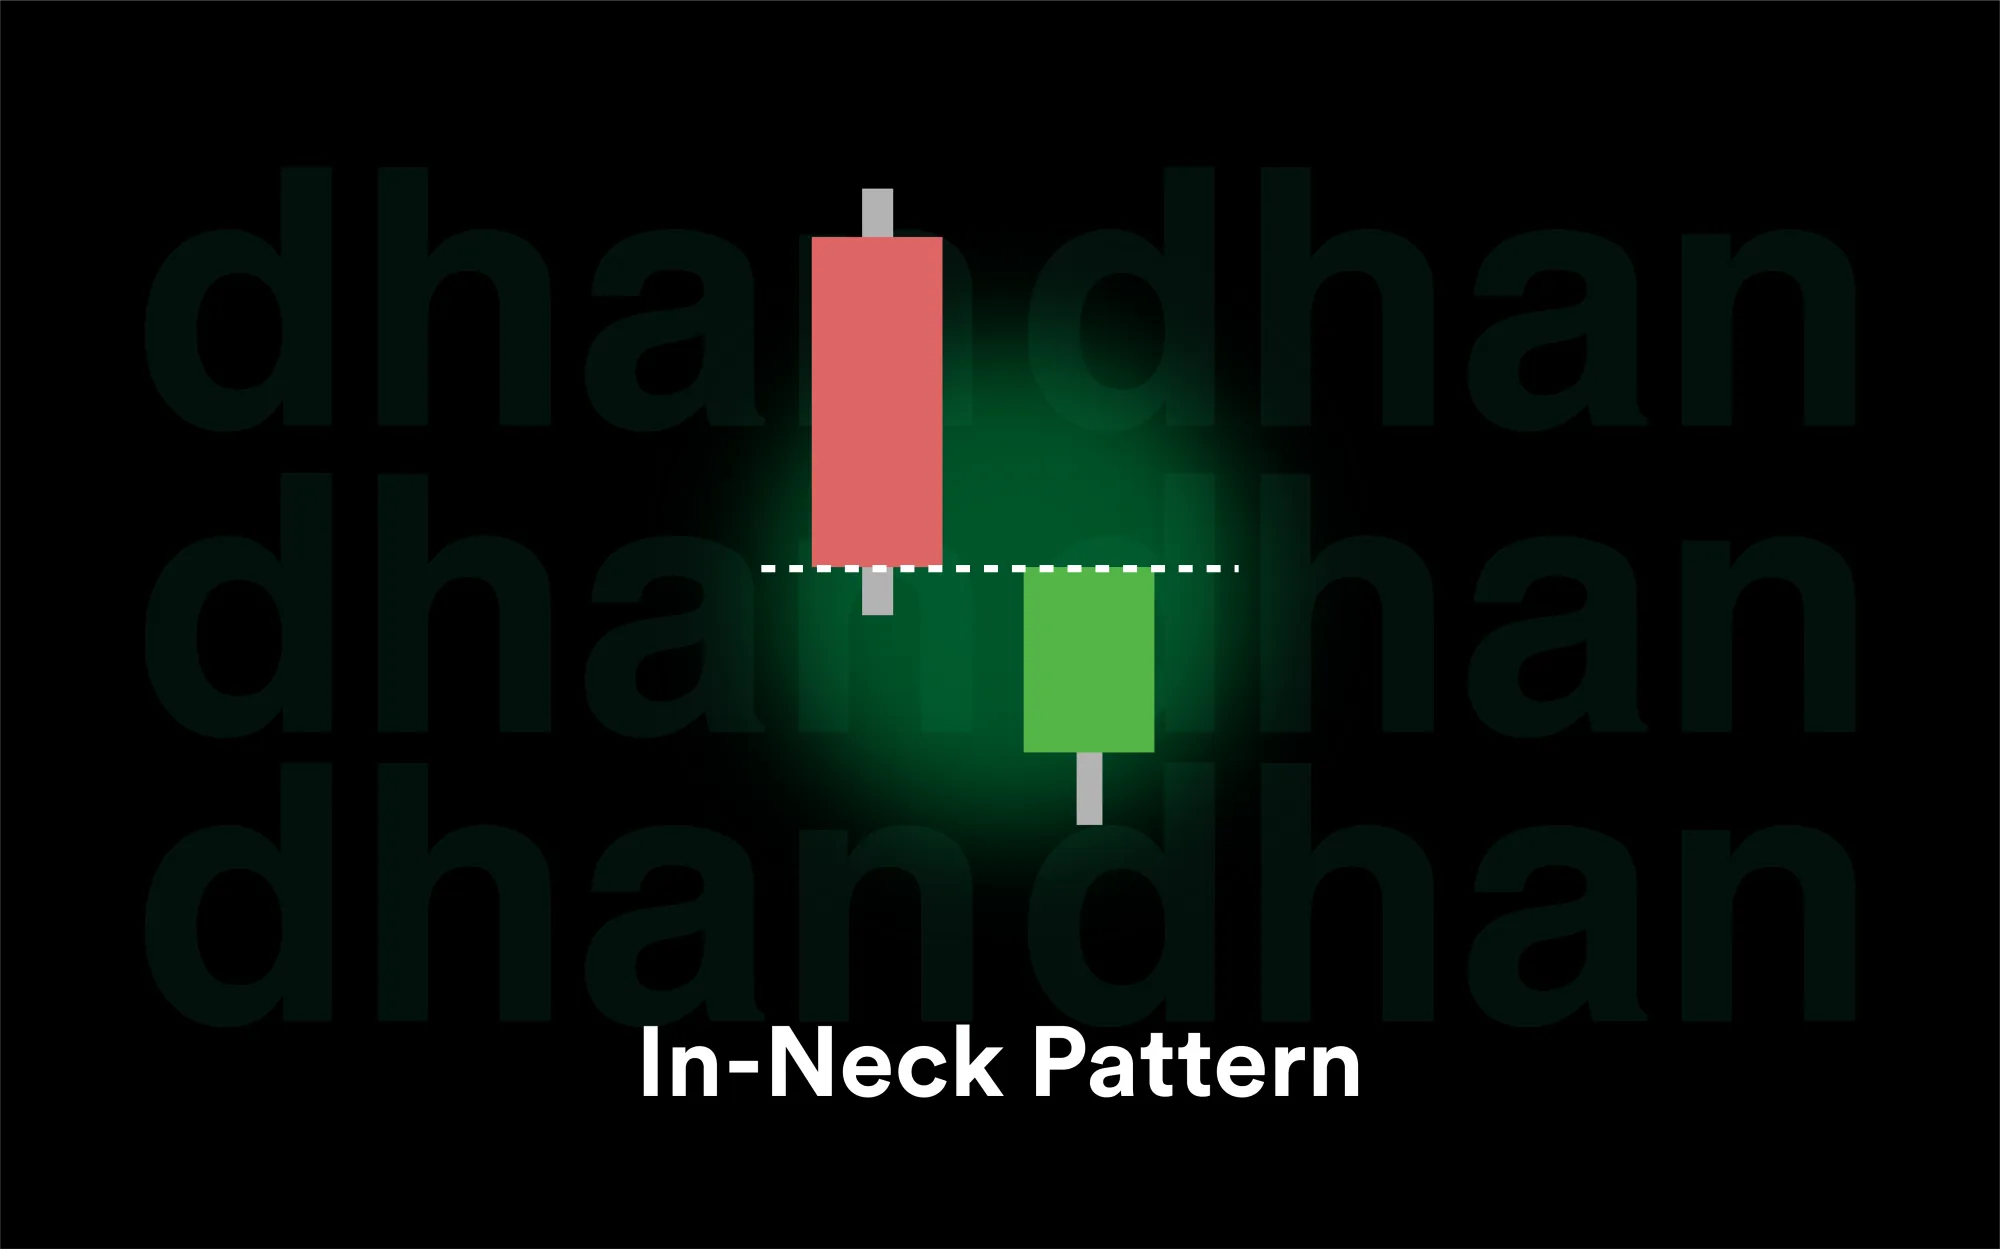
39. In-Neck Pattern
The In-Neck Pattern is similar to the On-Neck pattern but slightly stronger. It consists of a bearish candle followed by a small bullish candle that closes slightly above the previous close but still within the lower range. It suggests that the downtrend may continue despite minor buying interest.
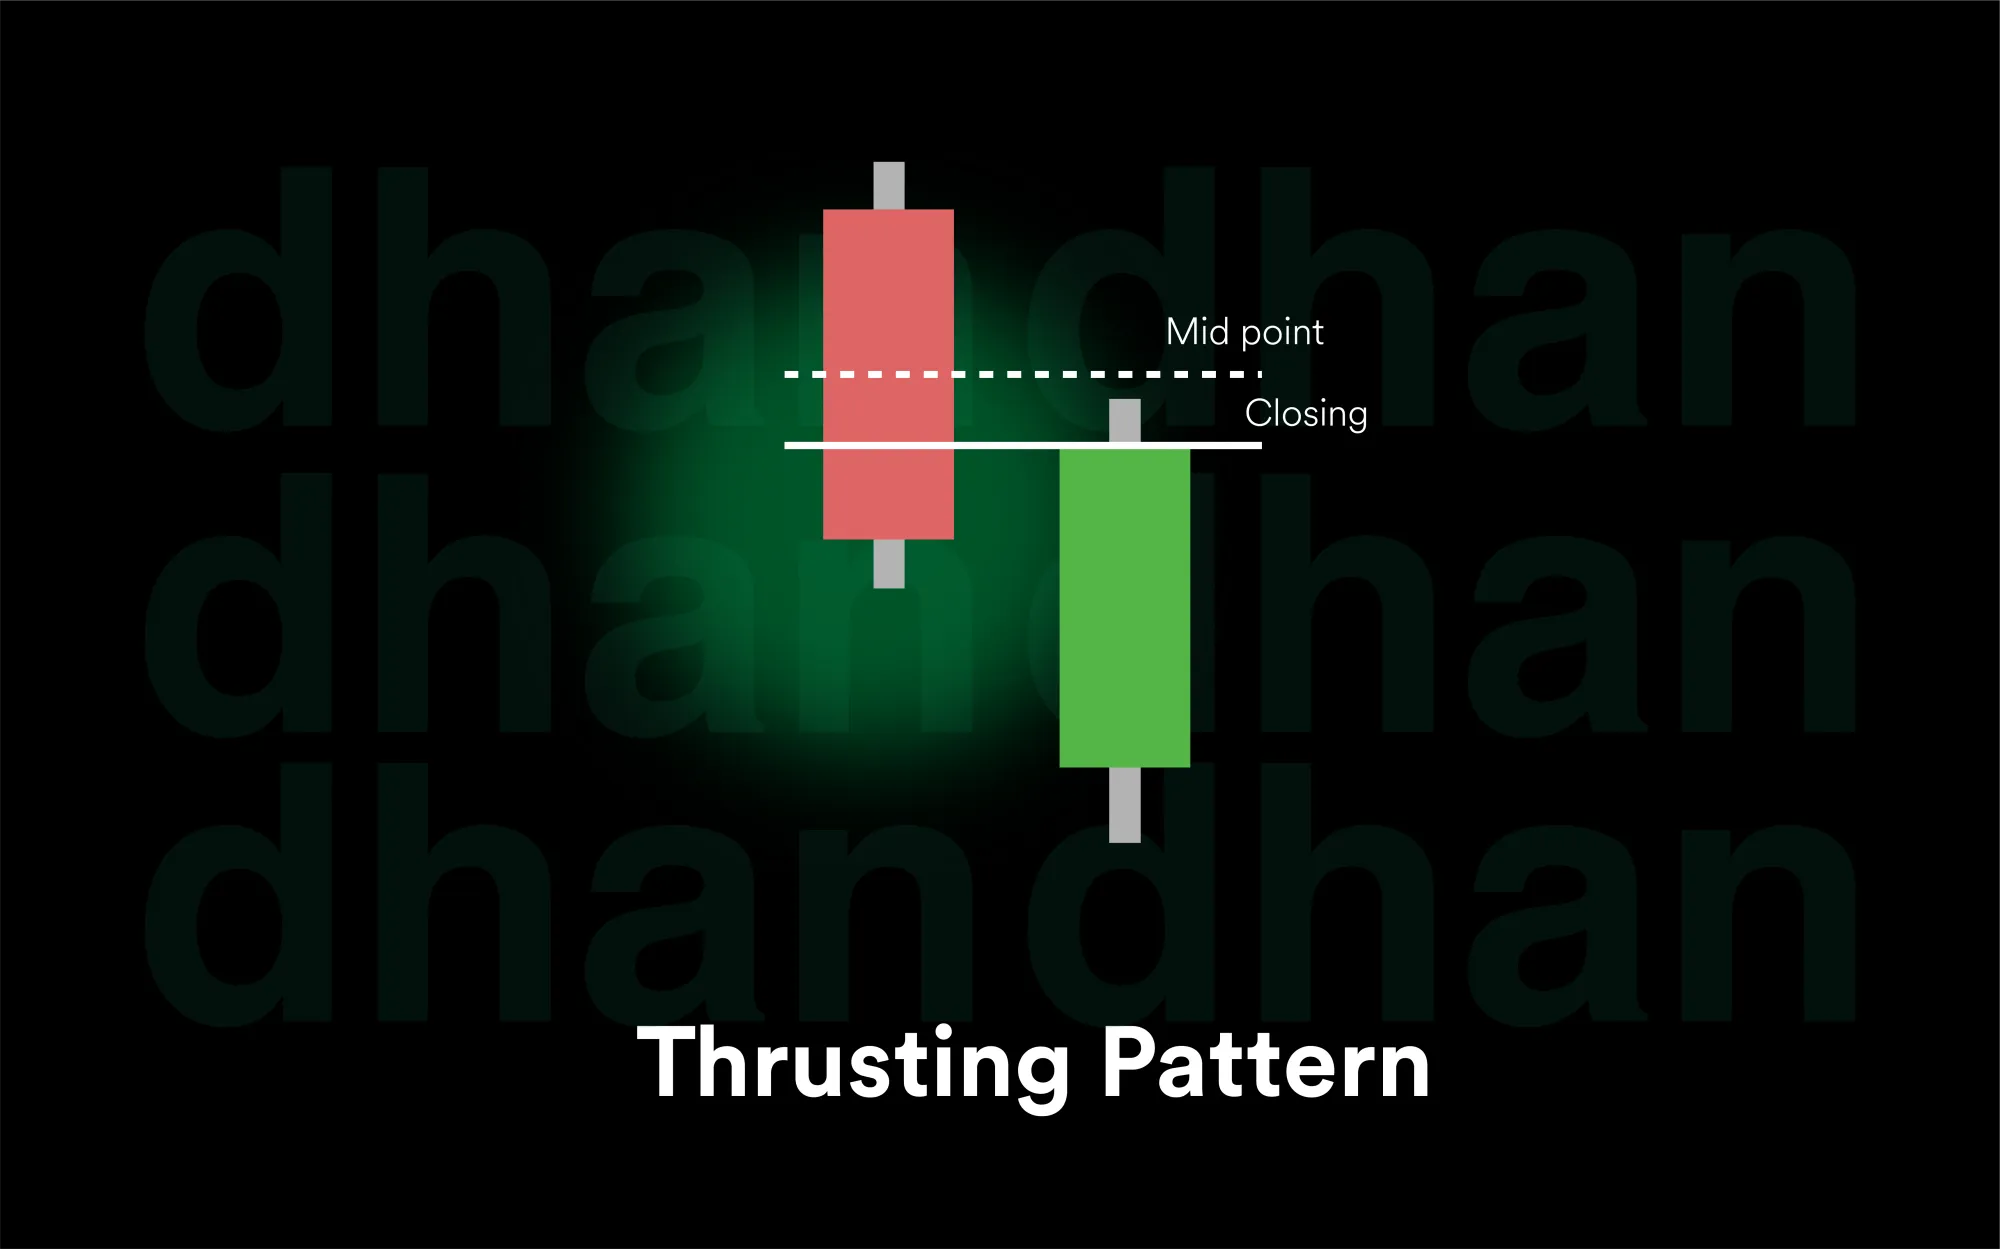
40. Thrusting Pattern
The Thrusting Pattern is another bearish continuation pattern that appears during a downtrend. It consists of a strong bearish candle followed by a bullish candle that retraces into the body of the first candle but fails to close above its midpoint. This indicates that sellers still have control over the market.
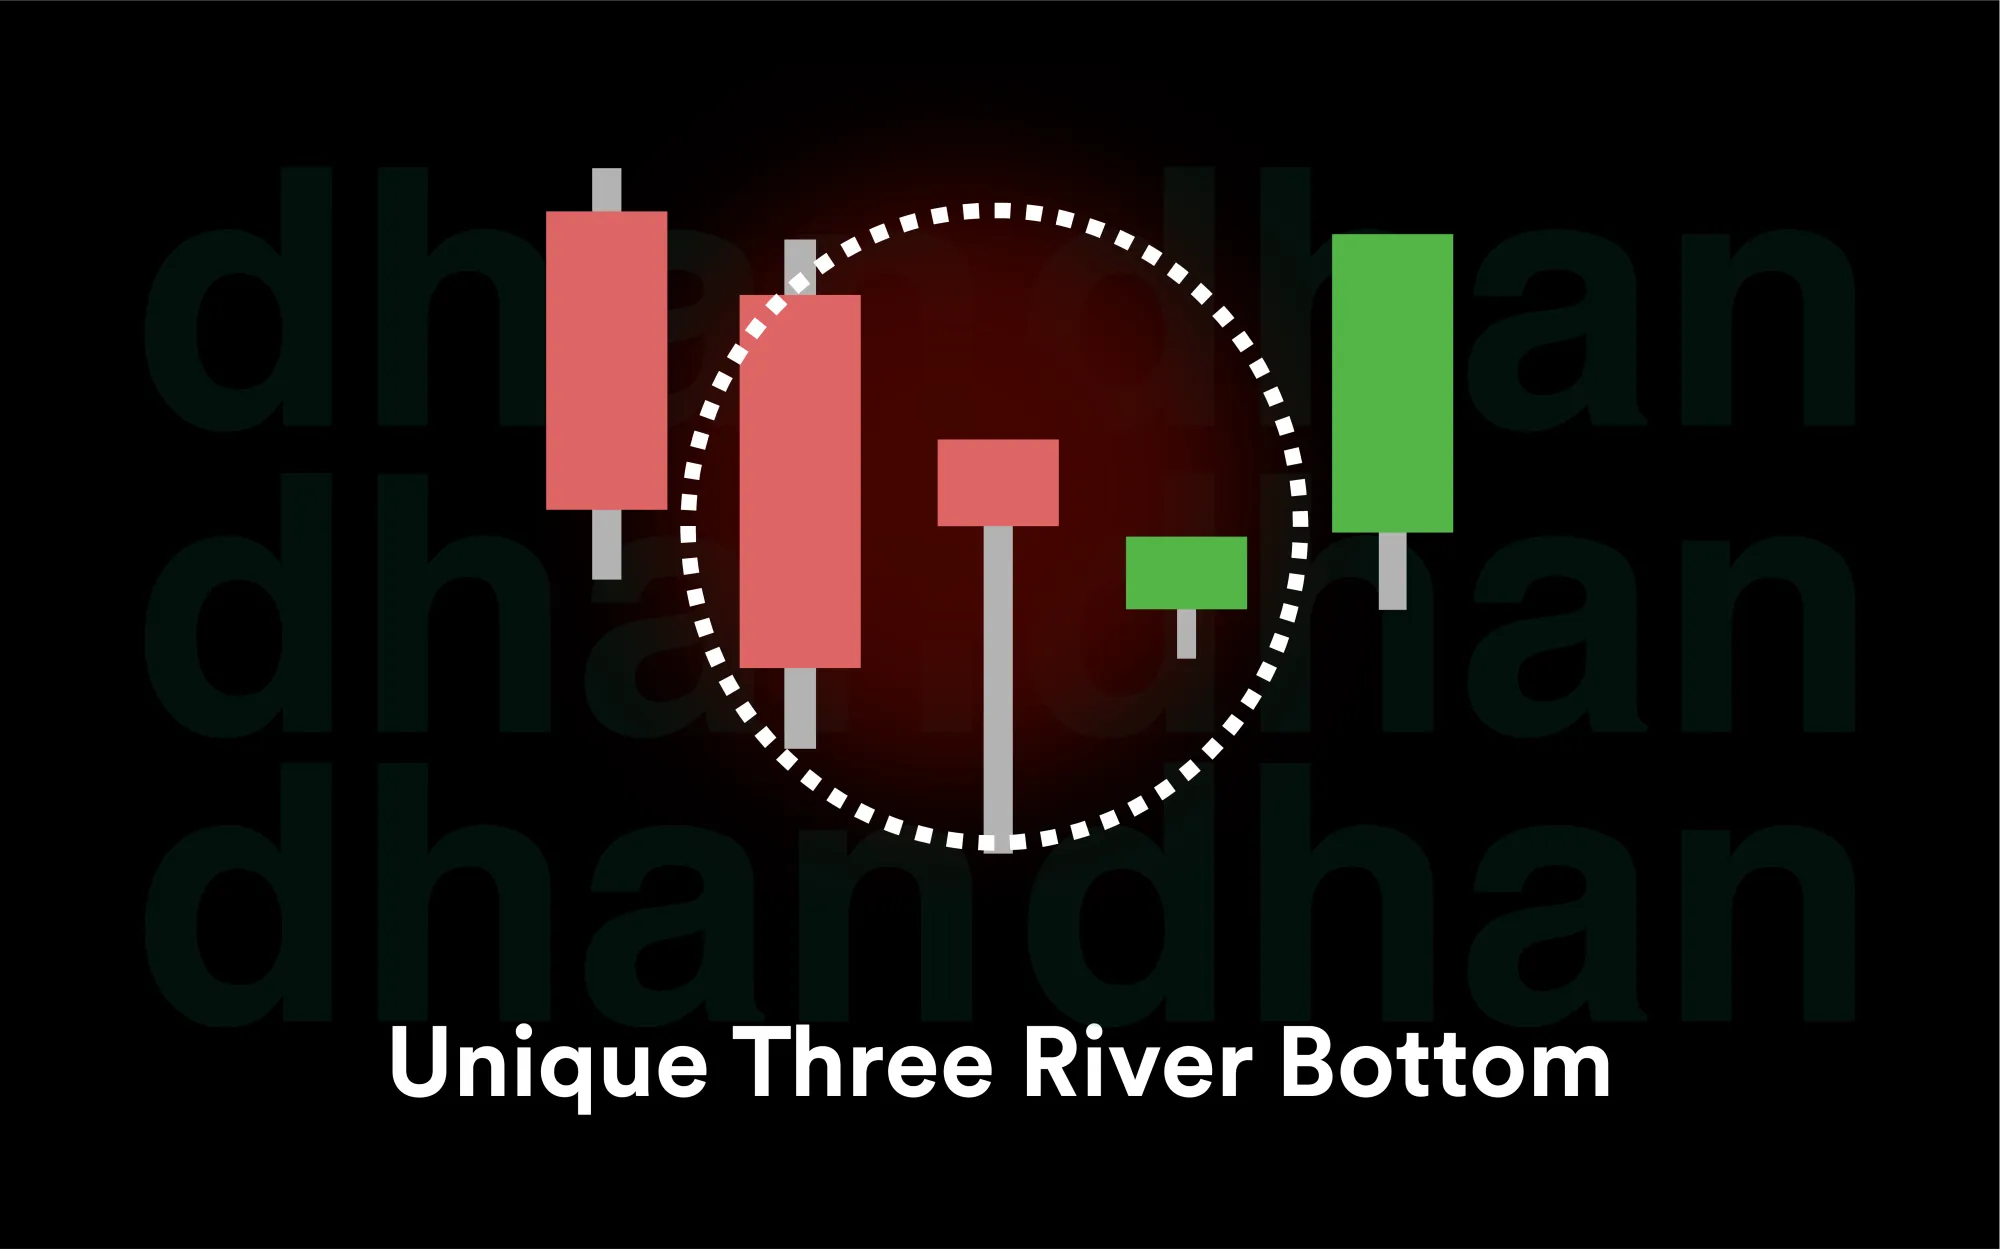
41. Unique Three River Bottom
The Unique Three River Bottom is a three candle bullish reversal pattern that appears after a downtrend. It begins with a strong bearish candle followed by a hammer-like candle with a long lower shadow. The third candle is a small bullish candle. This pattern suggests that selling pressure is weakening and buyers may soon take control.
42. Bullish Harami Cross
The Bullish Harami Cross is similar to the bullish harami pattern, but the second candle is a Doji instead of a small bullish candle. It indicates strong market indecision after a strong downtrend. When confirmed with a bullish candle in the next session, it can signal a potential reversal.

43. Bearish Harami Cross
The Bearish Harami Cross appears after an uptrend. It forms when the first candle is a large bullish candle with a subsequent Doji candle that forms within its body. This pattern signals uncertainty in the market and suggests that buying momentum may be weakening. A bearish confirmation candle strengthens the signal.

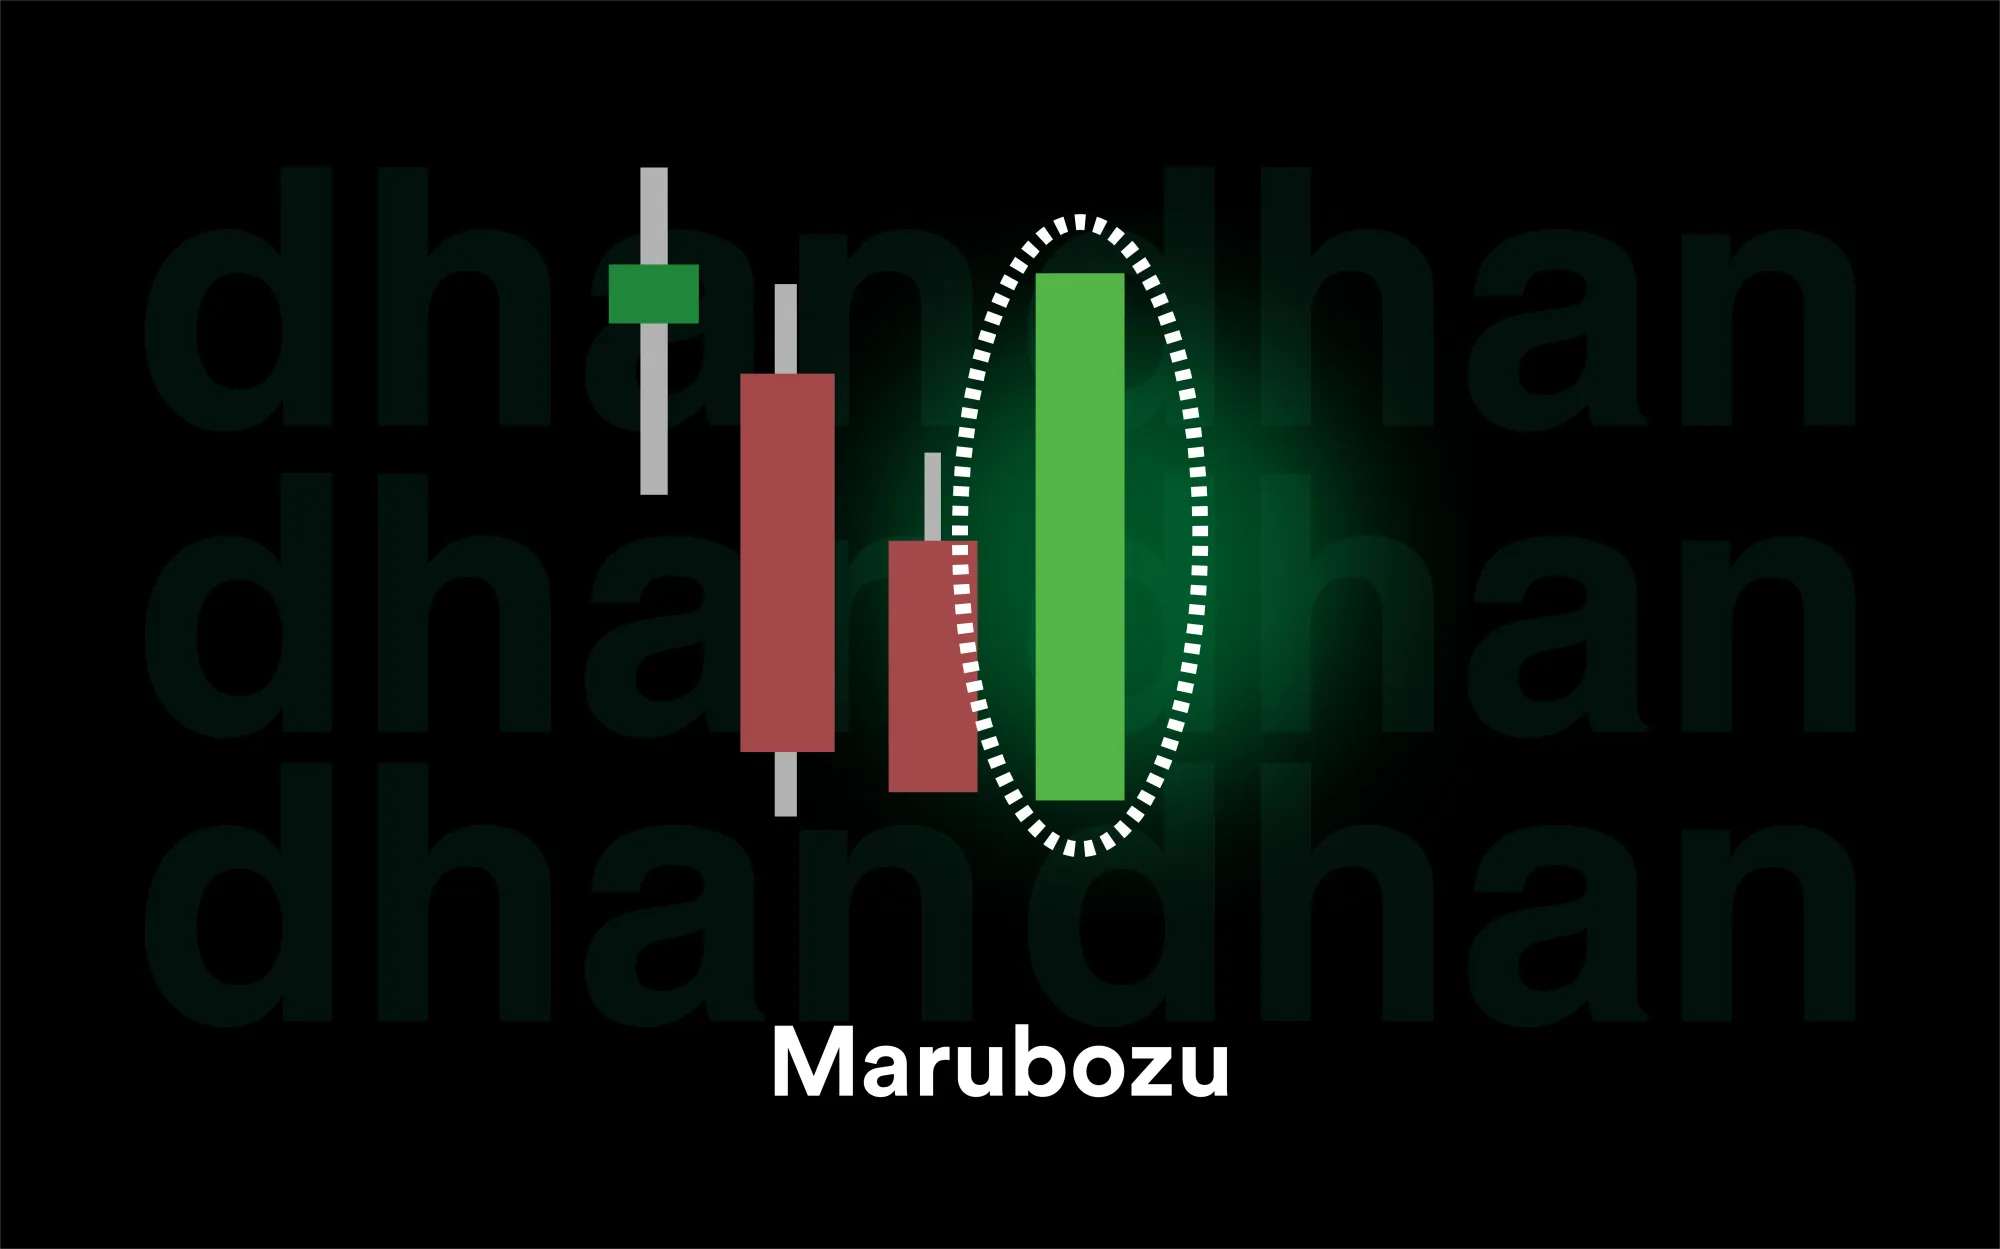
44. Marubozu
A Marubozu candle has no upper or lower shadow, meaning the price opens at one extreme and closes at the other. A bearish Marubozu opens at the high and closes at the low, indicating strong selling pressure. A bullish Marubozu opens at the low and closes at the high, indicating strong buying pressure.
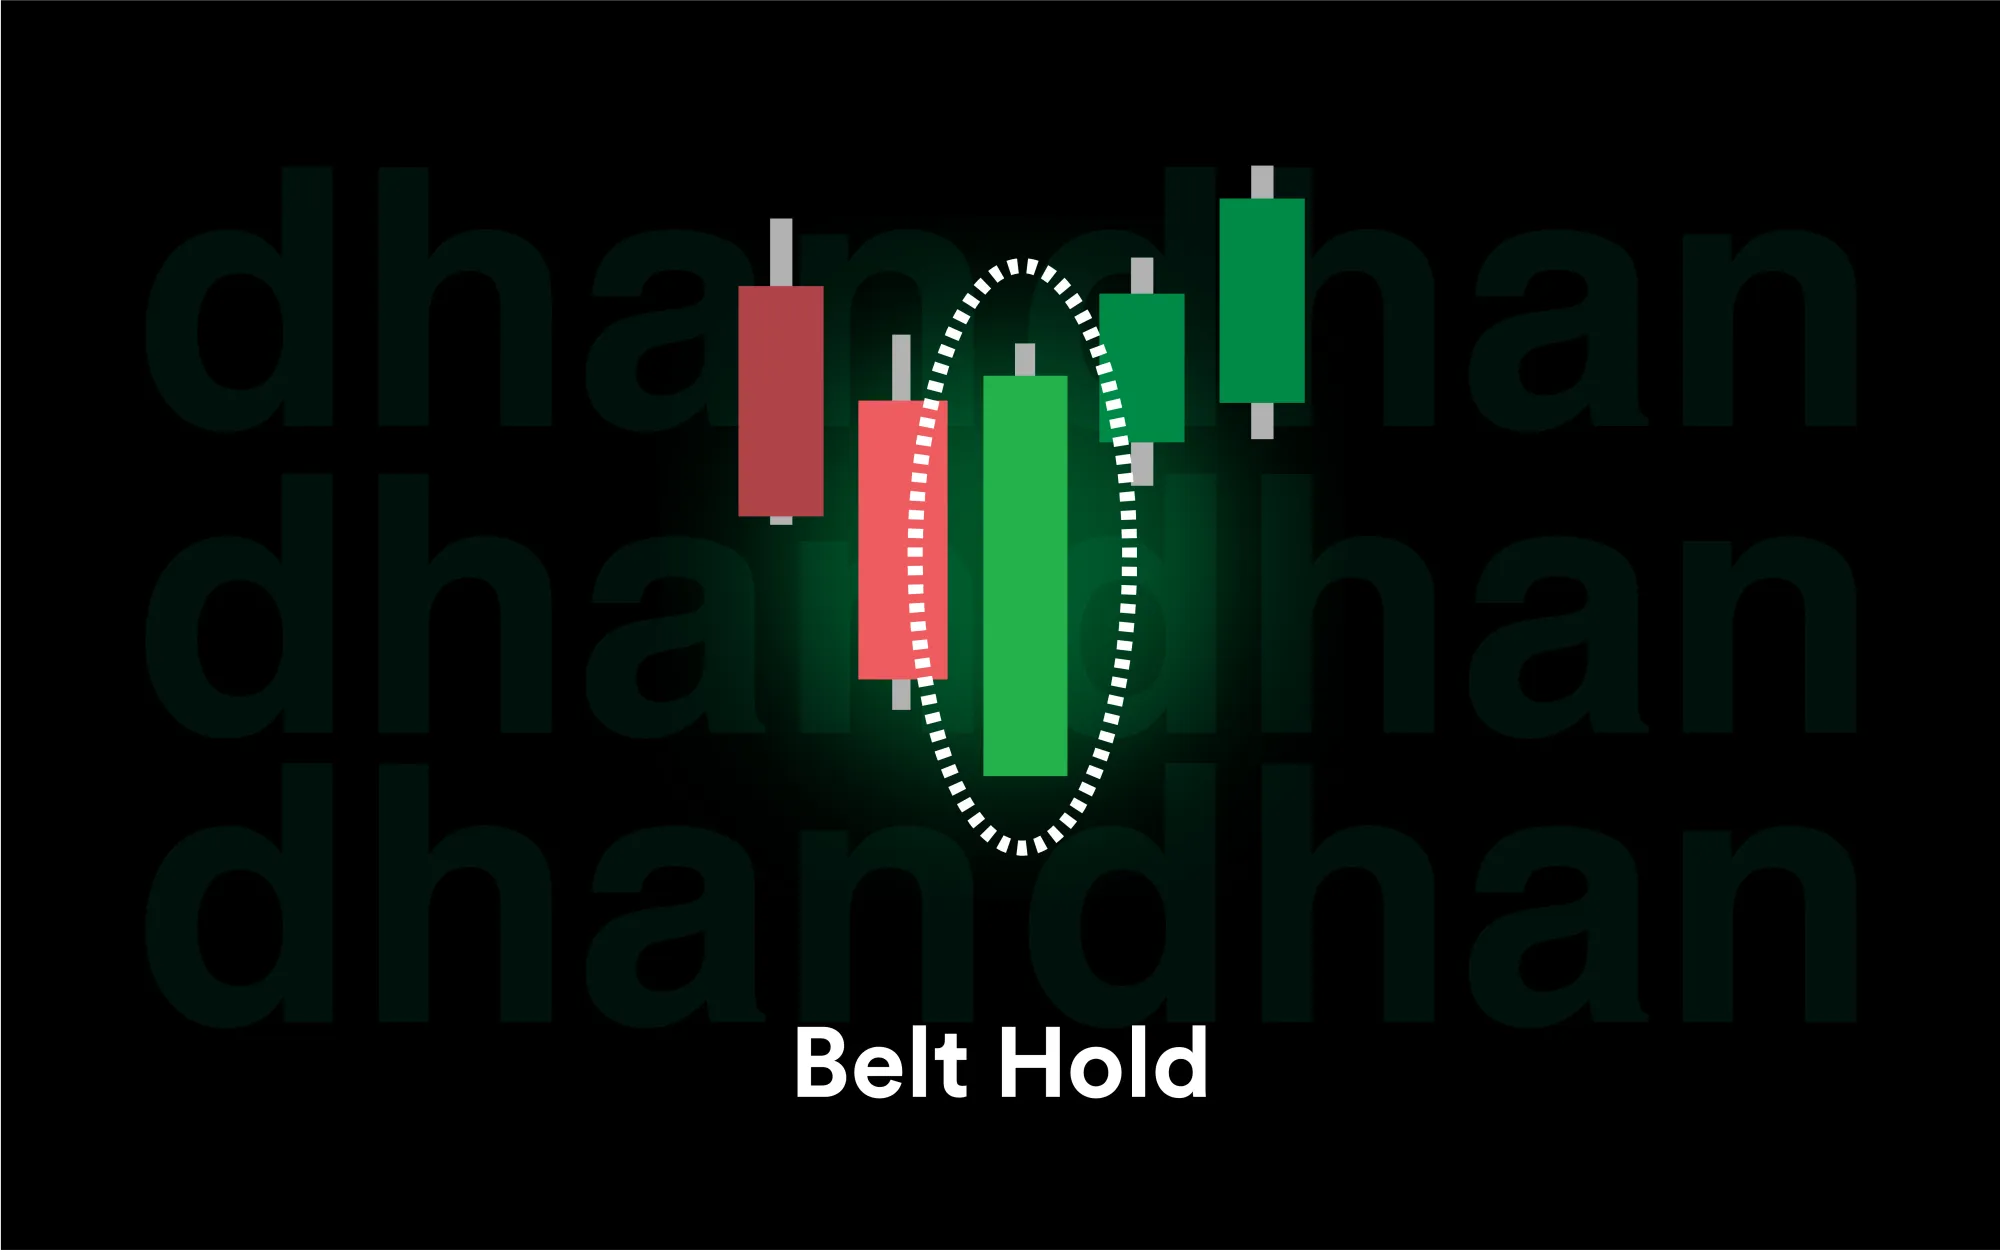
45. Belt Hold
The Belt Hold pattern can be bullish belt hold or bearish depending on the trend. A bullish belt hold appears after a downtrend and opens at the low with a strong bullish move upward. A bearish belt hold appears after an uptrend and opens at the high before moving downward. It signals a sudden shift in market sentiment.
Final thoughts
Candlestick patterns remain a core part of technical analysis because they visually represent market psychology in real time. Although the indicators, tools, and trading systems have been and are still evolving, the candlestick patterns can be really helpful for traders in understanding market behaviour.
FAQs
What are candlestick patterns?
Candlestick patterns are price formations shown on candlestick charts that reflect market psychology.
Which candlestick pattern is most reliable?
There is no single pattern that can be said to be most reliable, but patterns like Bullish Engulfing, Morning Star, Hammer, and Three White Soldiers are considered strong when confirmed with trend and volume.
Should candlestick patterns be used alone?
No. Candlestick patterns work best when combined with trend direction, support and resistance levels, and volume.
What is the difference between reversal and continuation patterns?
Reversal pattern signals a potential change in the trend direction, while continuation pattern suggests a small pause in the trend, and it will continue.
Can beginners trade using candlestick patterns?
Yes, beginners can use candlestick patterns. But they should practice with demo trading before putting their real money.







