



Best Moving Averages for Swing Trading




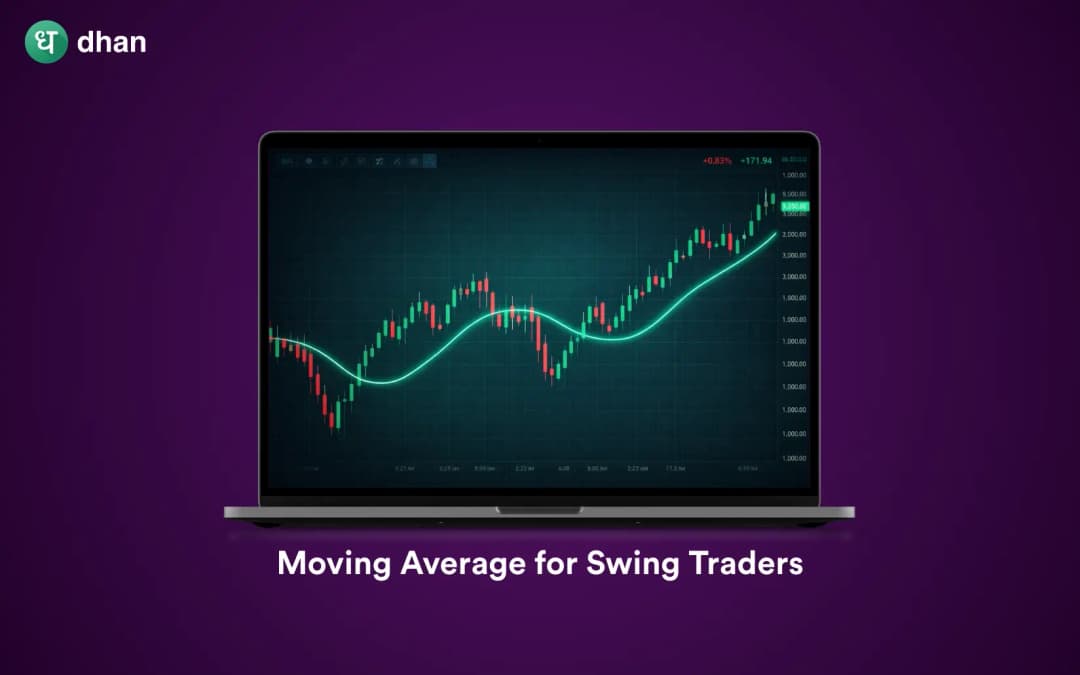




For swing traders, choosing the correct moving average is an important skill when determining market direction, deciding on entry points, and planning exits.
Moving averages help to smooth out price action and show the ongoing trends by removing short-term changes. Traders often mix averages, like 20-day, 50-day, and even longer ones, to keep a balance between quick reactions and making sure of a trend when setting up daily swings.
This blog will cover the best moving average for swing trading and how to use them.
Why moving averages work well for swing trading
For swing traders, moving averages are useful because they even out the daily changes in price and show the main trend in the market.
By removing short-term distractions, a moving average makes it easy to see if prices are mostly going up or down during the time you're watching.
For instance, if a stock's price stays above its 20-day moving average, that means it's going up, and buyers are in charge, so it can be a suitable time to hold onto your position.
On the other hand, if prices drop below the moving average, the trend might be getting weaker, and you might think about selling.
Top moving averages for swing trading
When swing trading, it's important to choose the right moving average. You want one that reacts quickly enough to catch price changes, but not so quickly that it gets thrown off by minor fluctuations. Here are some of the best moving average for swing trading.
1. 20 EMA (Exponential Moving Average)
The 20-period EMA is a fast-moving average that puts more emphasis on recent price changes. Regular moving averages treat all past prices the same, but the 20 EMA reacts more quickly to what’s happening now in the market. Swing traders like it since it helps them spot short-term momentum right away.
On a daily chart, the 20 EMA shows the average price over about a month of trading. If the price stays above the 20 EMA, that usually means the price is trending up. If the price keeps dropping to this level and then rising again, it might be a good time to buy. But, if the price goes below the 20 EMA and stays there, the trend might be changing or losing strength.
A lot of traders see the 20 EMA as a changing level of support or resistance, especially when paired with strong price moves. It's more than just something to look at; it's a guide that shows how a trend is flowing. If used the right way, it can give clearer signals for when to get in and out of swing trades.
2. 50 EMA (Exponential Moving Average)
For swing traders, the 50-period EMA is a useful tool. It calculates the average price over the last 50 periods, putting more importance on recent prices. This helps it track trends without overreacting to short-term swings.
If the price stays above the 50 EMA, it usually means the trend is going up. Traders watch this level to find chances to buy when the price dips. If the price drops below the 50 EMA and stays there, it could mean the trend is getting weaker.
Compared to shorter EMAs that can be noisy, the 50 EMA ignores small changes and gives a clearer picture of the trend. It works well with price action or volume to confirm when to buy or sell.
3. 100 SMA and 200 SMA (Simple Moving Averages)
The 100 and 200-day simple moving averages are often used to see how strong a trend is overall. They aren't meant to tell you exactly when to buy or sell, but rather to give you a general idea of where things are headed.
The 100 SMA can help you figure out the direction of a trend over the medium term. If the price stays above this average, it usually means that the momentum is still good. Traders might use this to stay with the trend, mostly when looking at setups that last for several weeks.
The 200 SMA is more important. Big investors and traders everywhere keep a close eye on it. If the price stays above the 200-day average, the asset is usually seen as being in a long-term uptrend. If it falls below, it could mean wider weakness or a change in how people feel about it.
Together, these averages work as support or resistance that changes with the market. A bounce near the 100 or 200 SMA could mean the trend will continue, while a break below it might mean it's reversing. They're helpful because they give you background information, which can help swing traders avoid going against the main direction of the market.
Final words
Selecting the right moving average for swing trading depends on understanding and sticking to your trading plan. The 20-day EMA can help spot quick entry points, while the 50-day EMA offers a more stable view of the market. Longer-term averages can show the overall trend. If used with price action analysis and good risk management, moving averages can be helpful tools for making steady and informed trading choices.
FAQs
1. What is the best moving average for swing trading?
There is no one-size-fits-all answer to this, as it depends on individual traders' trading style. However, the 50-day EMA is widely regarded as the most balanced moving average for swing trading. It provides the middle ground as it is reactive enough to capture new trends, while stable enough to filter out the market's noise. Many swing traders use the 50 EMA as their primary filter to determine the trend.
2. Should I use SMA or EMA for Swing Trading?
For swing trading on a short-term basis, the EMA (Exponential Moving Average) is often more favoured as it gives more importance to recent price information, which helps you to quickly respond to trend changes. The SMA (Simple Moving Average) is more preferable in spotting long-term support and resistance zones (such as the 100 or 200 SMA), where slower reactions help avoid false signals.
3. What is a moving average crossover, and how do I use it?
A crossover is formed when a faster-moving average crosses a slower one. A popular swing trading signal is the Golden Cross, which is a cross between a short-term average (such as the 50 EMA) and a long-term average (such as the 200 SMA), indicating a potential bullish breakout. Conversely, a Death Cross (short-term crossing below long-term) represents a bearish downtrend.
4. What timeframe should I use with these moving averages?
Swing traders often use the Daily time frame (D) for their analysis. This aligns best with holding positions for days or weeks. However, some traders also refer to the weekly chart to get the larger picture (using the 100 or 200 SMA), while some also refer to the 4-hour chart to fine-tune their entries.
5. Do moving averages work in sideways or choppy markets?
No, moving averages are trend-following indicators, which implies that they work best when the market is in a clear direction, either up or down. In a sideways or range-bound market, moving averages tend to flatten out and can provide false signals (whipsaws), which cause traders to buy and sell frequently for small losses. It is best to use them in conjunction with other tools, such as price action or RSI, in order to confirm trends.







