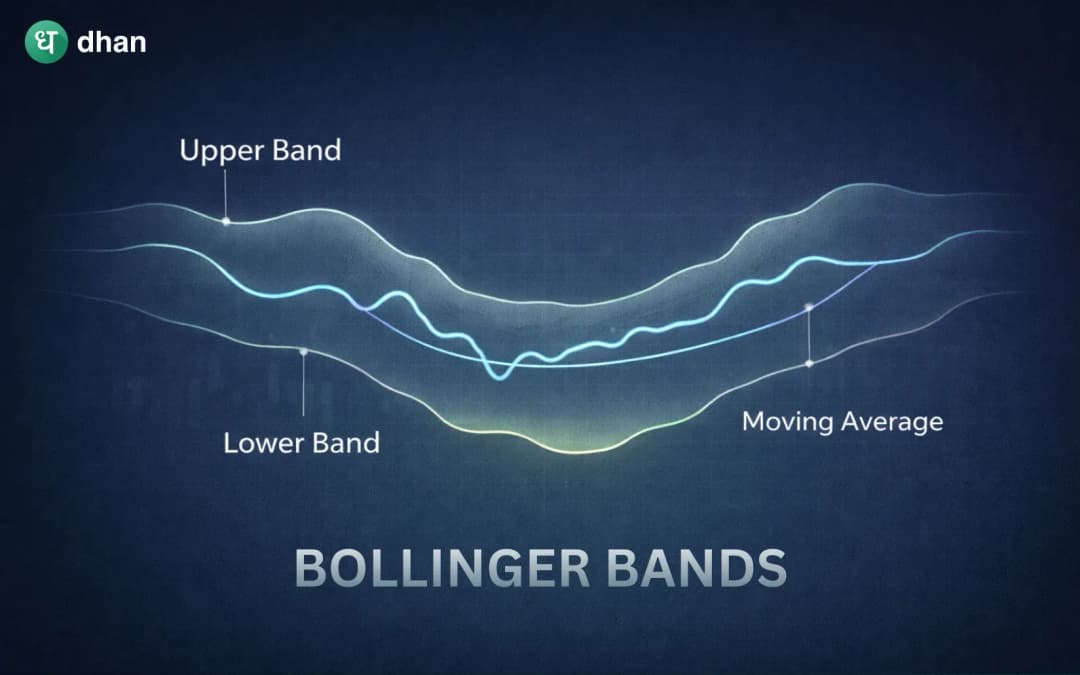
Dhan
Search
Search
Loading...
Scanning the Markets...

Home

Bollinger Bands


Bollinger Bands

For traders, analysing market volatility is crucial to make safe entries and exits from trades. Traders use various technical indicators to measure volatility. These indicators help traders manage risk, identify the breakouts, and analyse market sentiment.

Fact Checked
Team Dhan
Team Dhan
|Jan 23, 2026, 04:05 PM
WhatsAppTelegramXLinkedIn
Bollinger Bands


fuzz
technical-analysis banner

Read More on Technical Analysis

Expanding Triangle Pattern

Riya Dey  Jul 3, 2026, 06:48 PM
Expanding Triangle Pattern

Double Candlestick Patterns

Riya Dey  Jul 2, 2026, 06:42 PM
Double Candlestick Patterns

Bullish Rectangle Pattern

Shriram Shekhar  Jul 2, 2026, 03:08 PM
Bullish Rectangle Pattern

Read Other Articles


Closing Bell 19th June: Nifty 50 down by 0.64% & Sensex by 0.78%

Team Dhan  Jun 19, 2026, 03:57 PM
Closing Bell 19th June: Nifty 50 down by 0.64% & Sensex by 0.78%

How to read a Candle Chart Pattern?

Shriram Shekhar  Jun 16, 2026, 02:04 PM
How to read a Candle Chart Pattern?

Closing Bell 25th June: Nifty 50 & Sensex up by 0.14%

Team Dhan  Jun 25, 2026, 04:01 PM
Closing Bell 25th June: Nifty 50 & Sensex up by 0.14%

Loved & Trusted by 1 Cr+ Indians!