



Stick Sandwich Candlestick Pattern






Key takeaways
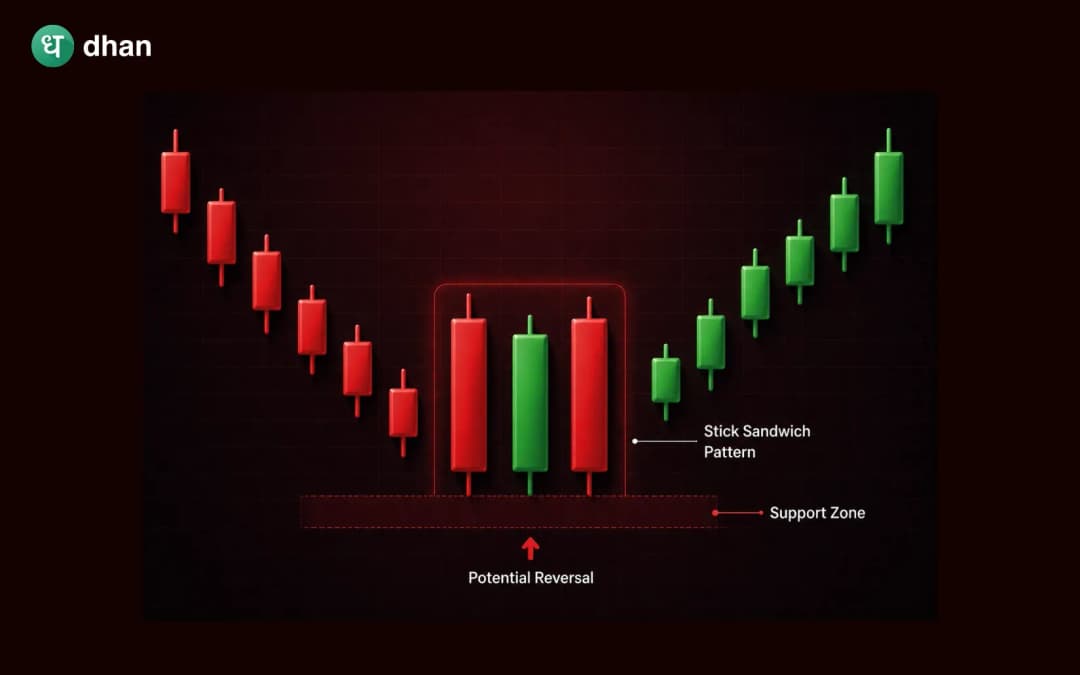
- The stick sandwich is a three-candlestick bullish reversal pattern that usually appears after a downtrend and indicates weakened selling pressure.
- The pattern is identified by two bearish candles with identical or nearly identical closing prices, separated by a bullish candle.
- Although the stick sandwich pattern can indicate a potential trend reversal, traders should always confirm the signal through the following price action, volume, and technical indicators.
Recognising when a market is about to reverse can be difficult, especially during a strong downtrend. Prices often continue falling despite temporary buying interest, making it challenging for traders to identify a genuine change in momentum. This is where candlestick patterns can provide valuable insights into market sentiment.
A more obscure but interesting reversal pattern is the stick sandwich candlestick pattern. It is three candles in a row that signal market sentiment. It shows that buyers are starting to come in to support price at some level, even though sellers appear to be in control initially.
Although the stick sandwich pattern is not as common as the bullish engulfing or morning star, it can offer useful clues when it appears in the right market conditions. However, like every candlestick pattern, it should not be used in isolation.
What is a Stick Sandwich Candlestick Pattern?
The stick sandwich candlestick pattern is a three-candlestick bullish reversal pattern that usually develops after a sustained downtrend.
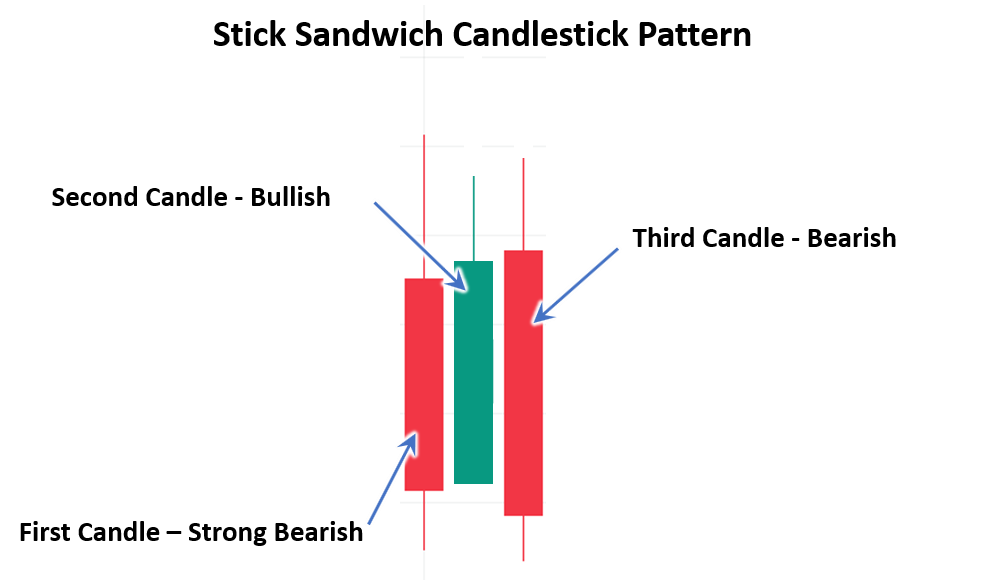
It consists of:
- A long bearish first candle
- A bullish second candle
- A bearish third candle that closes at or very close to the closing price of the first bearish candle
The matching closing prices of the first and third candles are the defining feature of this pattern. This price level acts as an area where buyers repeatedly emerge despite continued selling pressure.
Sellers seem active but struggling to push prices below a support, which is evident from the pattern. This could indicate a weakening of bearish momentum and a possible reversal to bullish forces.
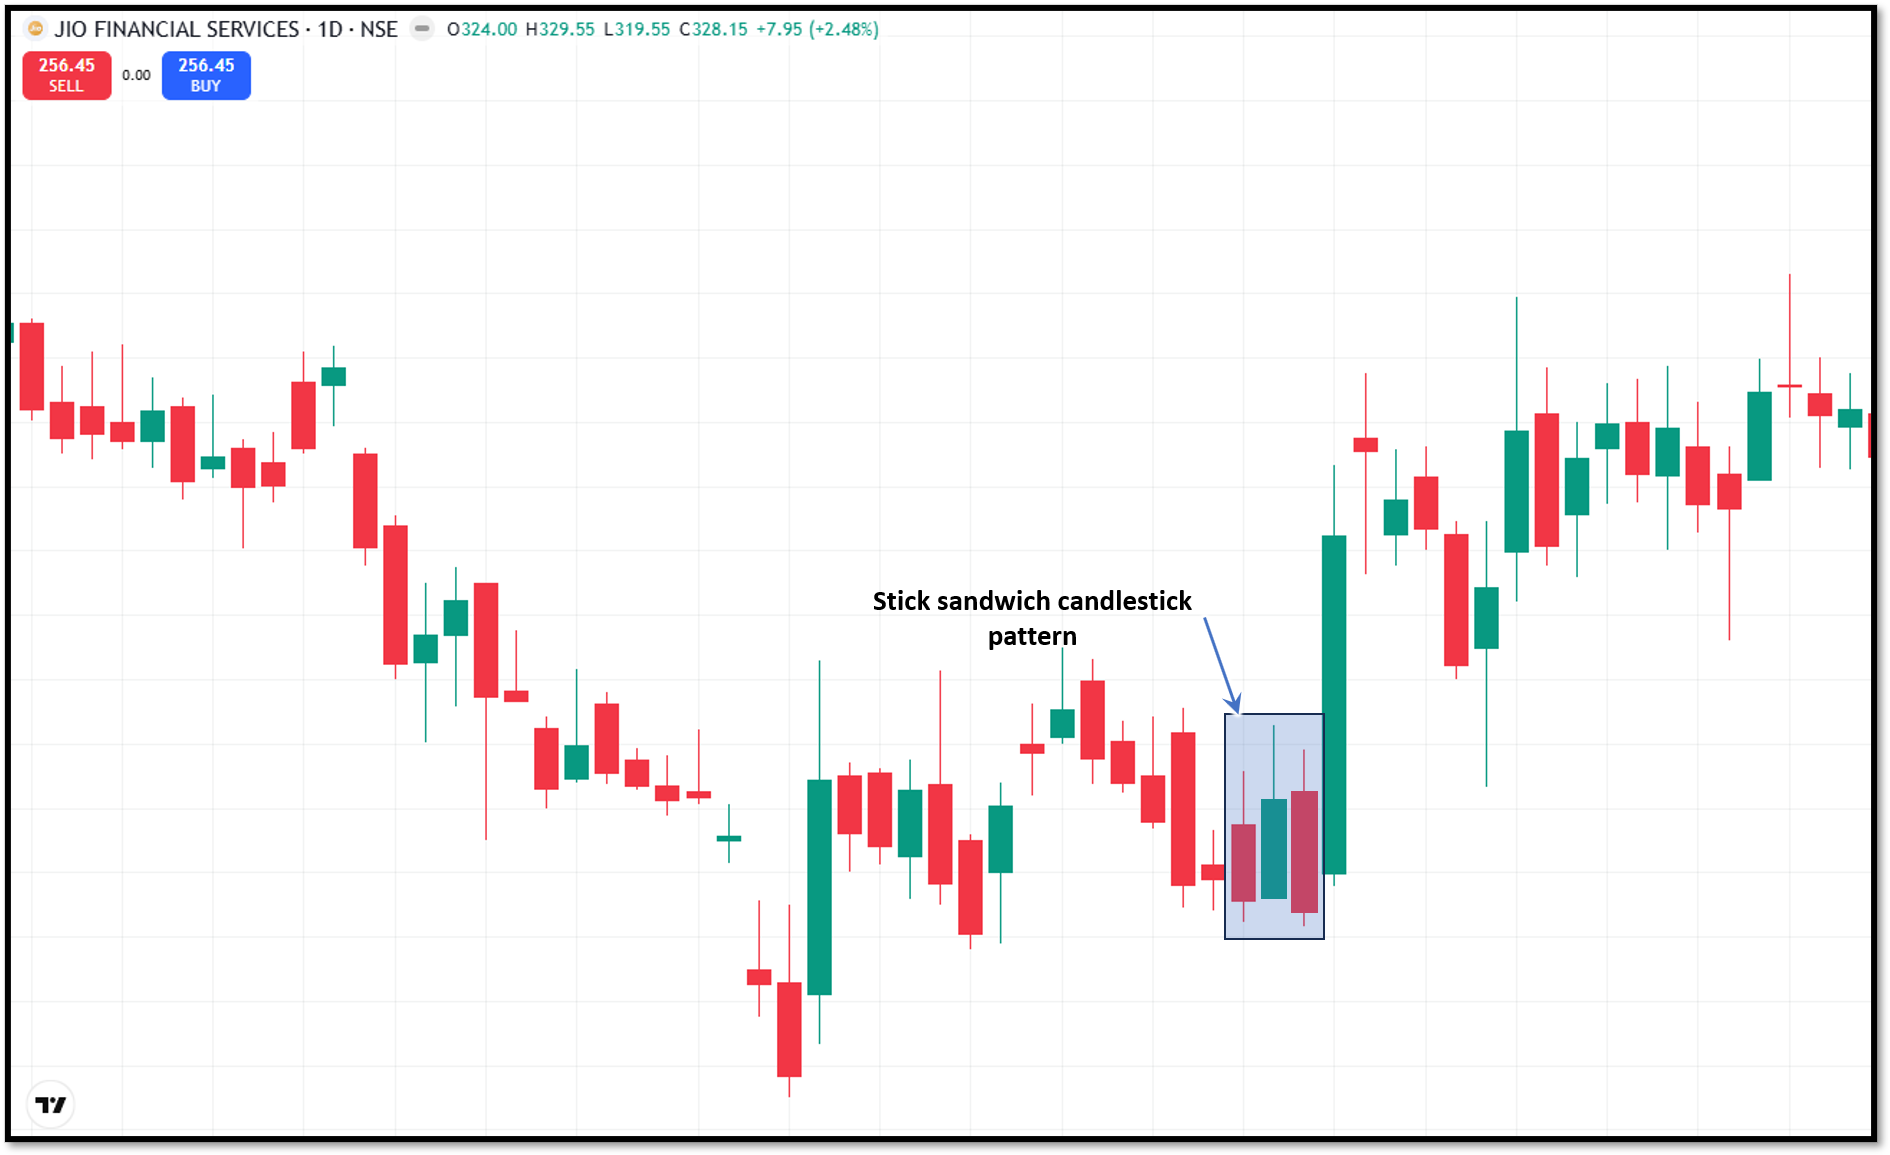
How does the Stick Sandwich Pattern form?
Understanding the sequence behind the pattern helps traders interpret its message more effectively.
First candlestick
The pattern begins with a long bearish candle that continues the existing downtrend. Sellers dominate the session and push prices significantly lower.
Second candlestick
The next session opened close to the previous close, but buyers gradually took charge. The closing price of this bullish candle stays above its opening. Purchasing interest is starting to emerge, the report notes.
Third candlestick
The third candle turns bearish again, suggesting that sellers are attempting to regain control. But despite the renewed selling pressure, the candle closes almost exactly at the same level as the first bearish candle.
What does the Stick Sandwich Pattern indicate?
The stick sandwich pattern signifies a change in market attitude rather than an immediate reversal. The sellers are in control, as confirmed by the first bearish candle.
The bullish second candle introduces uncertainty by showing that buyers are willing to step in after the decline.
Finally, although the third candle is bearish, sellers fail to close below the first candle's closing price. This repeated closing level suggests that demand exists at that price and that buyers are absorbing selling pressure.
In simple terms, the pattern indicates that sellers may be losing momentum while buyers are gradually building support.
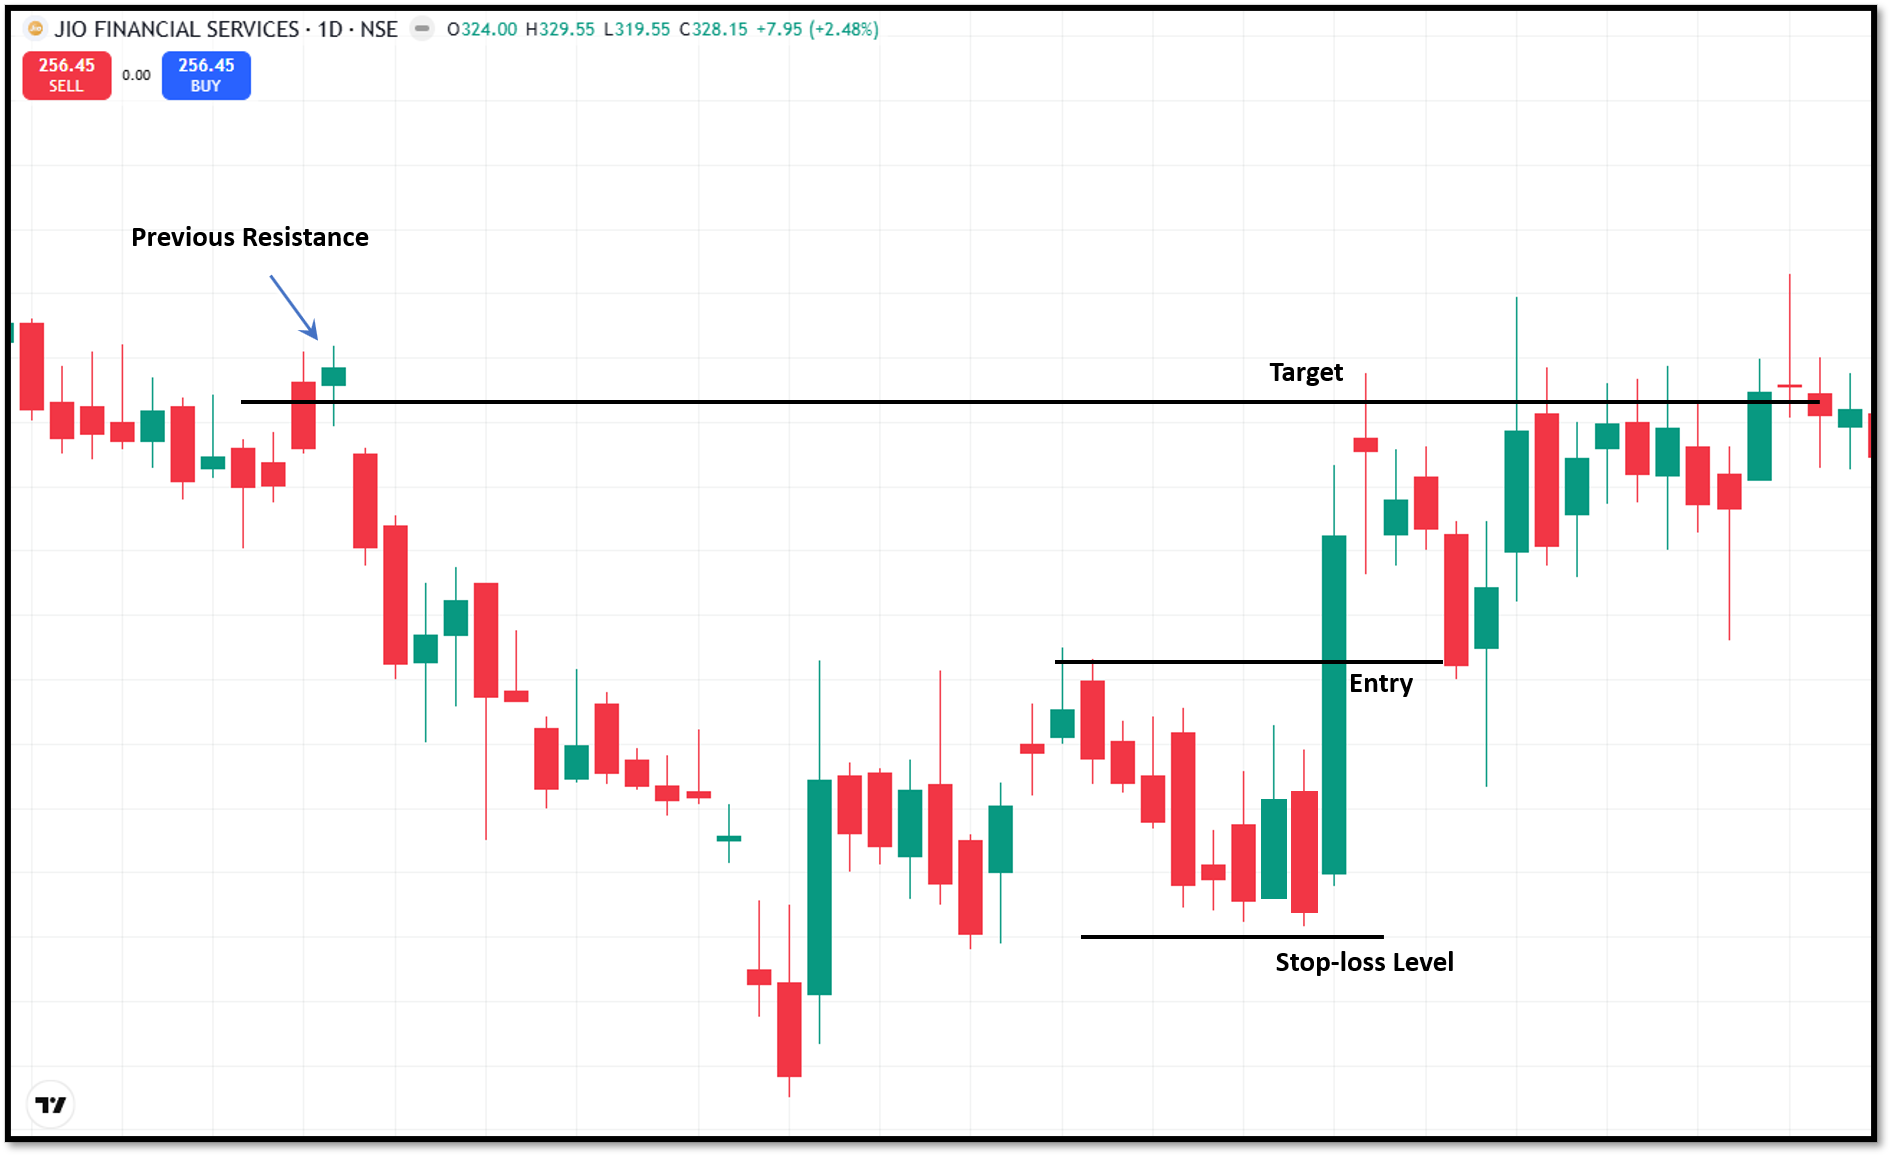
How to trade the Stick Sandwich Pattern
To trade the stick sandwich pattern, you may use the following structured process:
Confirm the existing downtrend
The stick sandwich pattern signals a possible reversal; hence, the pattern should appear after a significant fall. If it appears during sideways movement or an established uptrend, its significance decreases.
Confirm the pattern
Traders will often wait for the next candle to close above the pattern high or to break a nearby resistance level. Indeed, this shows that the buyers have taken control.
Entry
Once the confirmation candle completes, you can enter the trade immediately. Some traders also wait for a small pullback for entry if market conditions allow. This gives them a better risk-to-reward ratio.
Stop-loss
Traders usually place the stop-loss slightly below the lowest point of the three-candle pattern.
Profit target
Use one of the following methods to determine the target levels:
- Previous resistance zones
- Swing highs
- Fibonacci retracement levels
- Risk-reward ratios such as 1:2 or 1:3
Best indicators to use with the Stick Sandwich Pattern
Although the pattern can be analysed on its own, combining it with technical indicators usually improves decision-making.
Volume
The confirmation candle often has higher buying volume, so more buyers are coming in. This increases the probability of a reversal.
Moving averages
If the pattern forms near a long-term moving average where the price has seen active participation, it increases the reliability of the pattern.
Relative Strength Index (RSI)
If the stick sandwich forms while the RSI is in the oversold region, it may strengthen the possibility of a bullish reversal.
MACD
A bullish MACD crossover occurring shortly after the pattern can provide additional evidence that bearish momentum is fading.
Advantages of Stick Sandwich Candle Pattern
Advantages of the stick sandwich candlestick pattern are as follows:
- The Stick Sandwich pattern highlights a specific price level where buyers repeatedly step in. The matching closing prices of the first and third candles suggest that sellers struggle to push the market below this level, making it easier for traders to identify potential support.
- Although it consists of three candles, the pattern follows a straightforward structure that traders can identify with practice.
- The stick sandwich pattern can be observed in stocks, forex, commodities, indices, and cryptocurrencies.
- The pattern can be combined with RSI, MACD, moving averages, volume analysis, or support-resistance levels so that traders can weed out weaker setups and focus on higher-probability opportunities.
Limitations of Stick Sandwich Candle Pattern
Along with advantages, the stick sandwich pattern has the following limitations:
- The pattern requires confirmation before entering a trade: The pattern alone does not guarantee that prices will reverse higher.
- If selling pressure remains dominant across the broader market, buyers may not be able to sustain the reversal despite the appearance of the pattern.
- Compared with bullish engulfing or hammer patterns, the stick sandwich appears less often on price charts.
Conclusion
The stick sandwich candlestick pattern is a three-candlestick bullish reversal pattern that shows repeated buying interest at a specific price level. The pattern starts with a long bearish candle following a bullish candle that closes above the first candle's open. The third candle is a bearish candle which closes near the closing price of the first candle.
The pattern indicates a possible reversal, not a confirmed trend change. Hence, to increase the reliability of the pattern, you should combine the pattern with indicators such as RSI, MACD, etc.
FAQs
Is the stick sandwich pattern bullish or bearish?
The stick sandwich is generally considered a bullish reversal pattern. It usually appears after a downtrend and suggests that buyers are beginning to defend an important support level.
Why is it called the stick sandwich pattern?
The name is derived from the three-candle pattern in which the bullish candle is flanked by two bearish candles. The first and third candle should have the same or almost the same closing price for the “sandwich” look.
Which indicators work best with the stick sandwich pattern?
Common confirmation tools include RSI, MACD, moving averages, volume analysis, and support-resistance levels.
Can beginners use the stick sandwich pattern?
Yes. The pattern is relatively straightforward once traders understand its structure. However, beginners should combine it with proper risk management and additional confirmation signals.
Does the stick sandwich pattern work in intraday trading?
Yes. It can appear on intraday, daily, weekly, and monthly charts. However, lower timeframes may produce more false signals due to increased market noise.







