



Homing Pigeon Candlestick Pattern




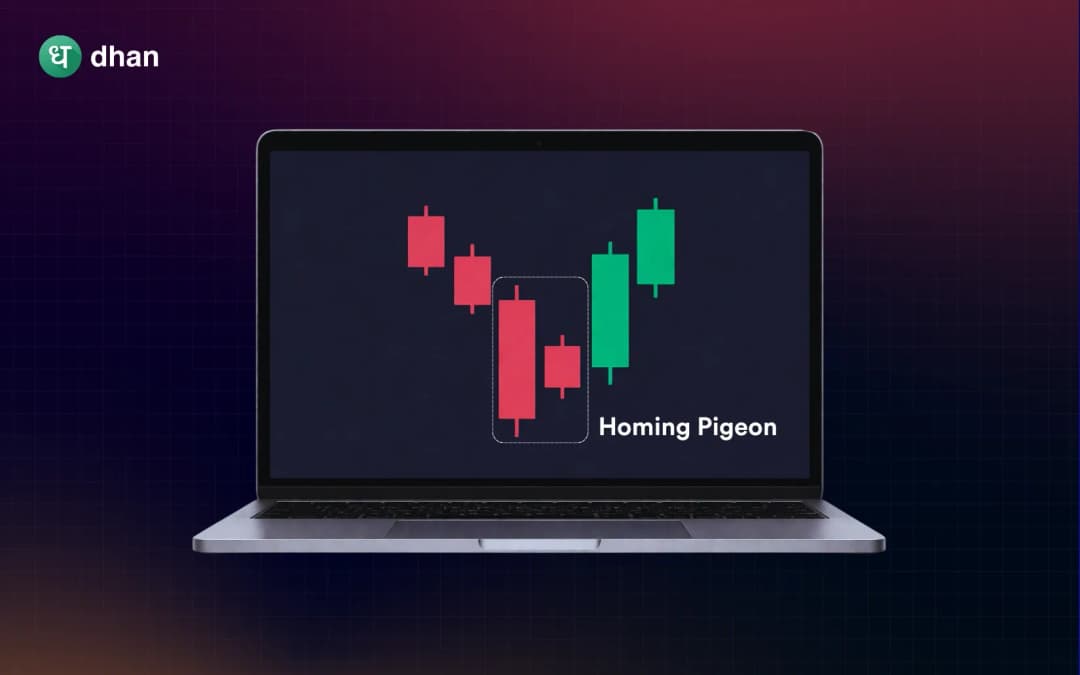




- A two-candle bullish reversal pattern, the homing pigeon usually appears after a downtrend.
- Both candles are bearish, but the real body of the second candle is within the body of the first candle.
- The pattern shows weakening selling pressure, but not necessarily a reversal.
- A bullish confirmation candle is required before entering a long trade.
- You can increase the reliability of the trade with support and resistance, volume analysis, RSI or MACD.
Markets usually give subtle signals prior to a trend change. Some reversal patterns are easy to spot while others require traders to understand the context of the price action. One of these patterns is the homing pigeon candle.
The homing pigeon is a useful bullish reversal pattern that can suggest that selling pressure has begun to decrease. But it should never be used by itself. It should be used in conjunction with support levels, volume traded, and technical indicators for stronger confirmation.
Whether you are a beginner learning candlestick patterns or an experienced trader working on your strategy, knowing the homing pigeon pattern can help you make better trading decisions.
What is Homing Pigeon Candlestick Pattern?
The homing pigeon candlestick pattern is a two-candle bullish reversal pattern that generally appears after a lengthy downtrend. It indicates the bearish momentum is slowing down and the buyers might start to dominate the market soon.
The pattern is made up of:
- Long bearish (red) candlestick
- A smaller bearish candle that is completely within the body of the first candle
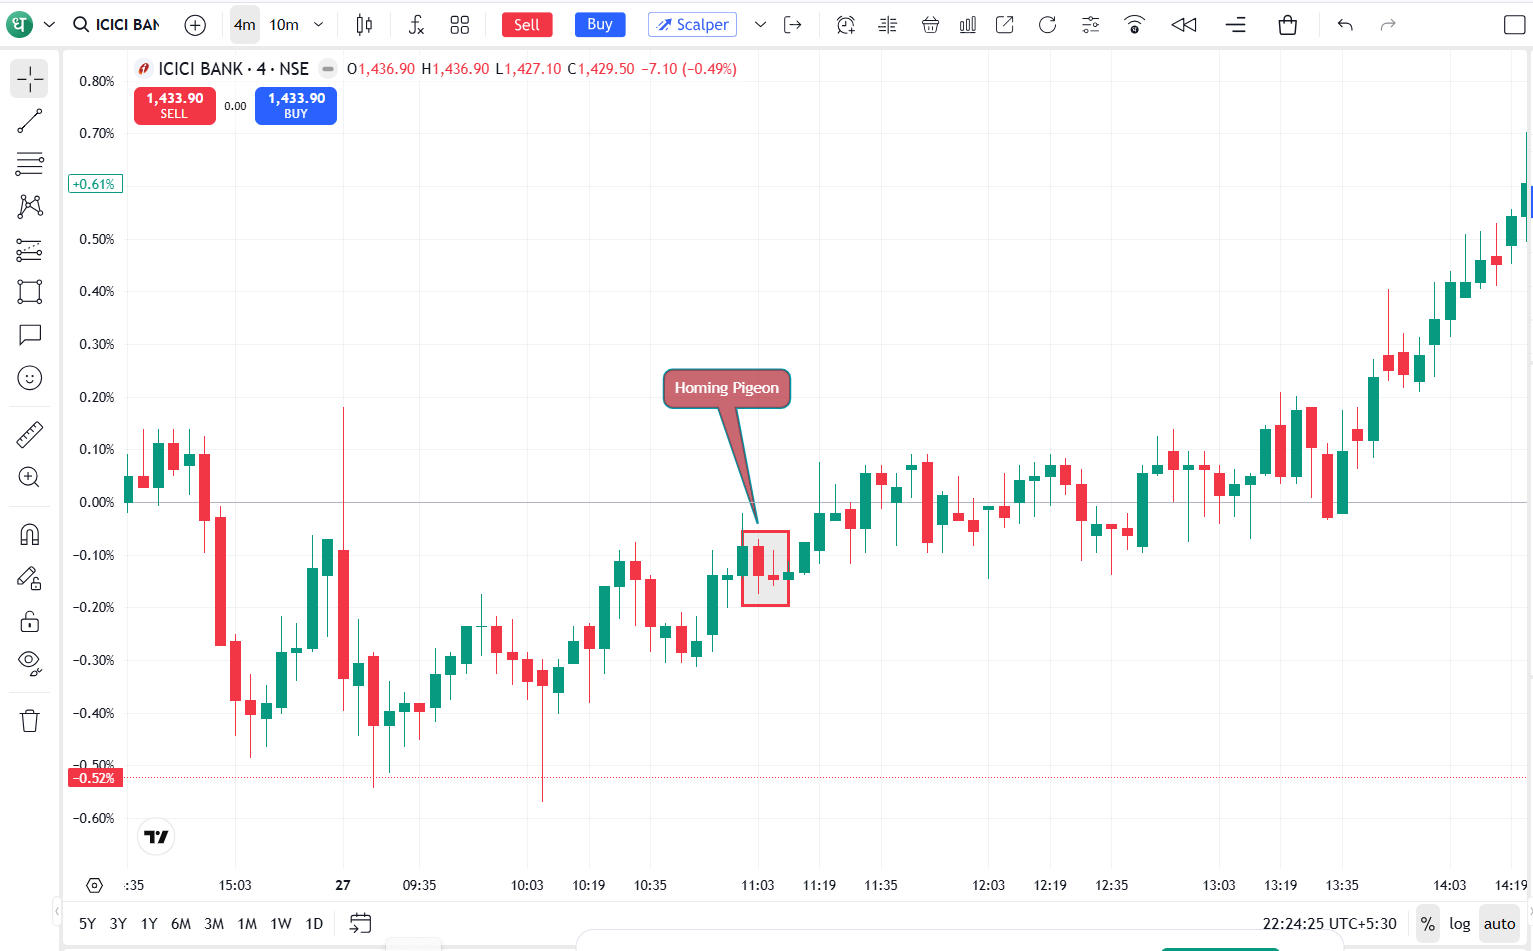
Both candles are closed lower than open, but the second candle is much smaller. This suggests sellers are not as aggressively pushing prices lower as they were.
The pattern is only more reliable if it is followed by a strong bullish confirmation candle. Without confirmation, the market may just continue to move sideways or go back to its downtrend.
How does the Homing Pigeon Pattern form?
The homing pigeon pattern forms in the later stages of a bearish trend when selling pressure begins to lose momentum.
It is typically formed in the following manner:
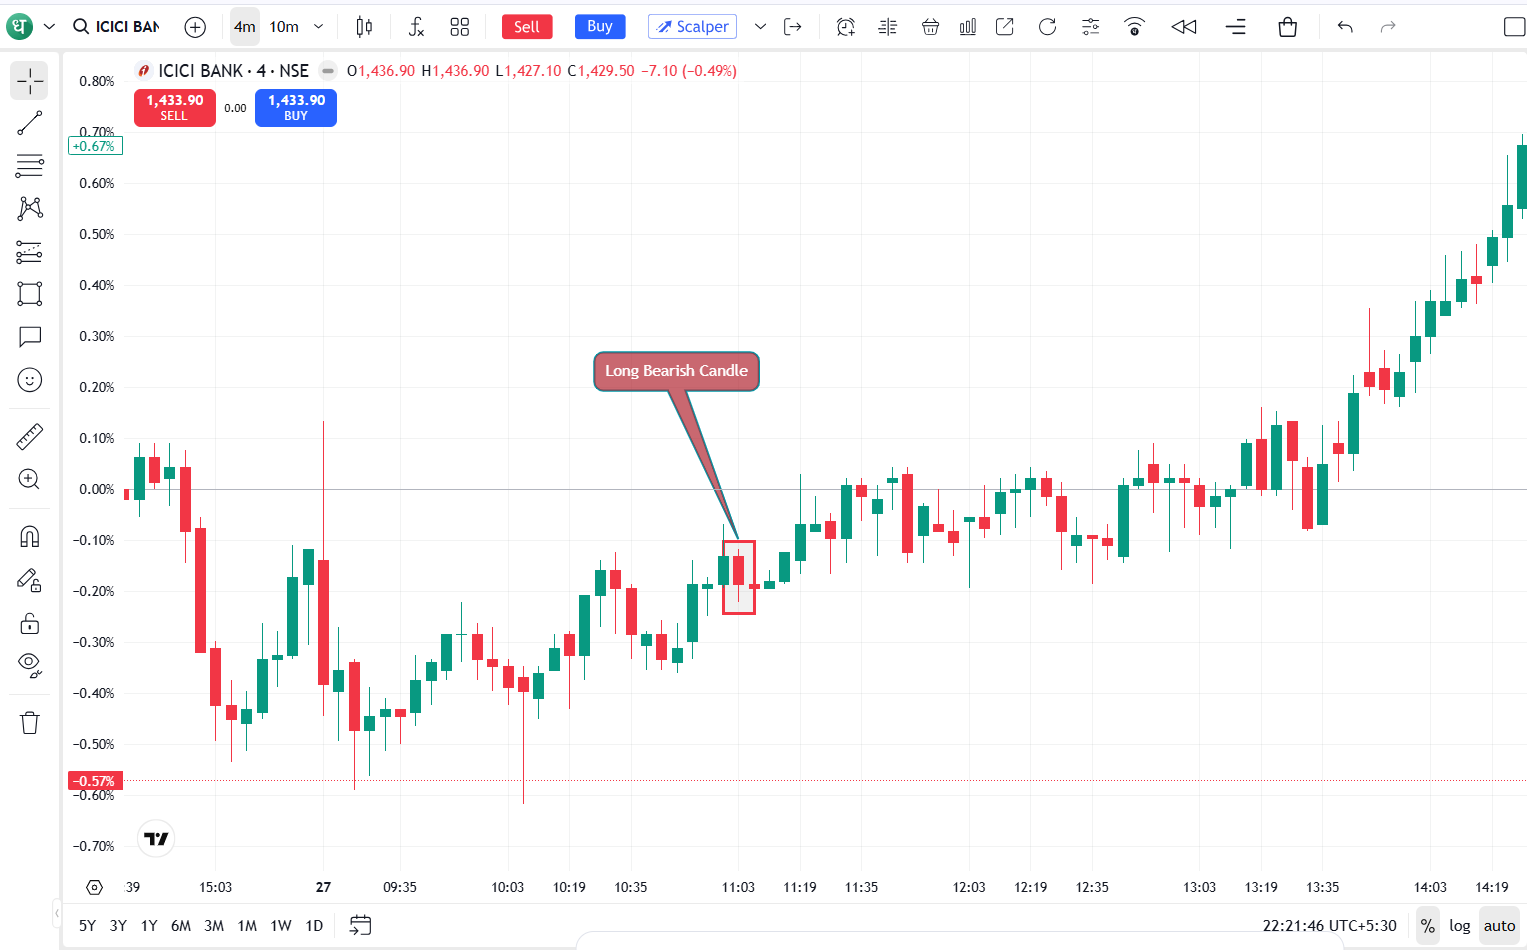
Step 1: Strong bearish candle
The first candle is a long bearish candle, indicating that there is a lot of selling activity. Sellers are still in the driver’s seat and are driving the price lower over the session.
Step 2: Smaller bearish candle
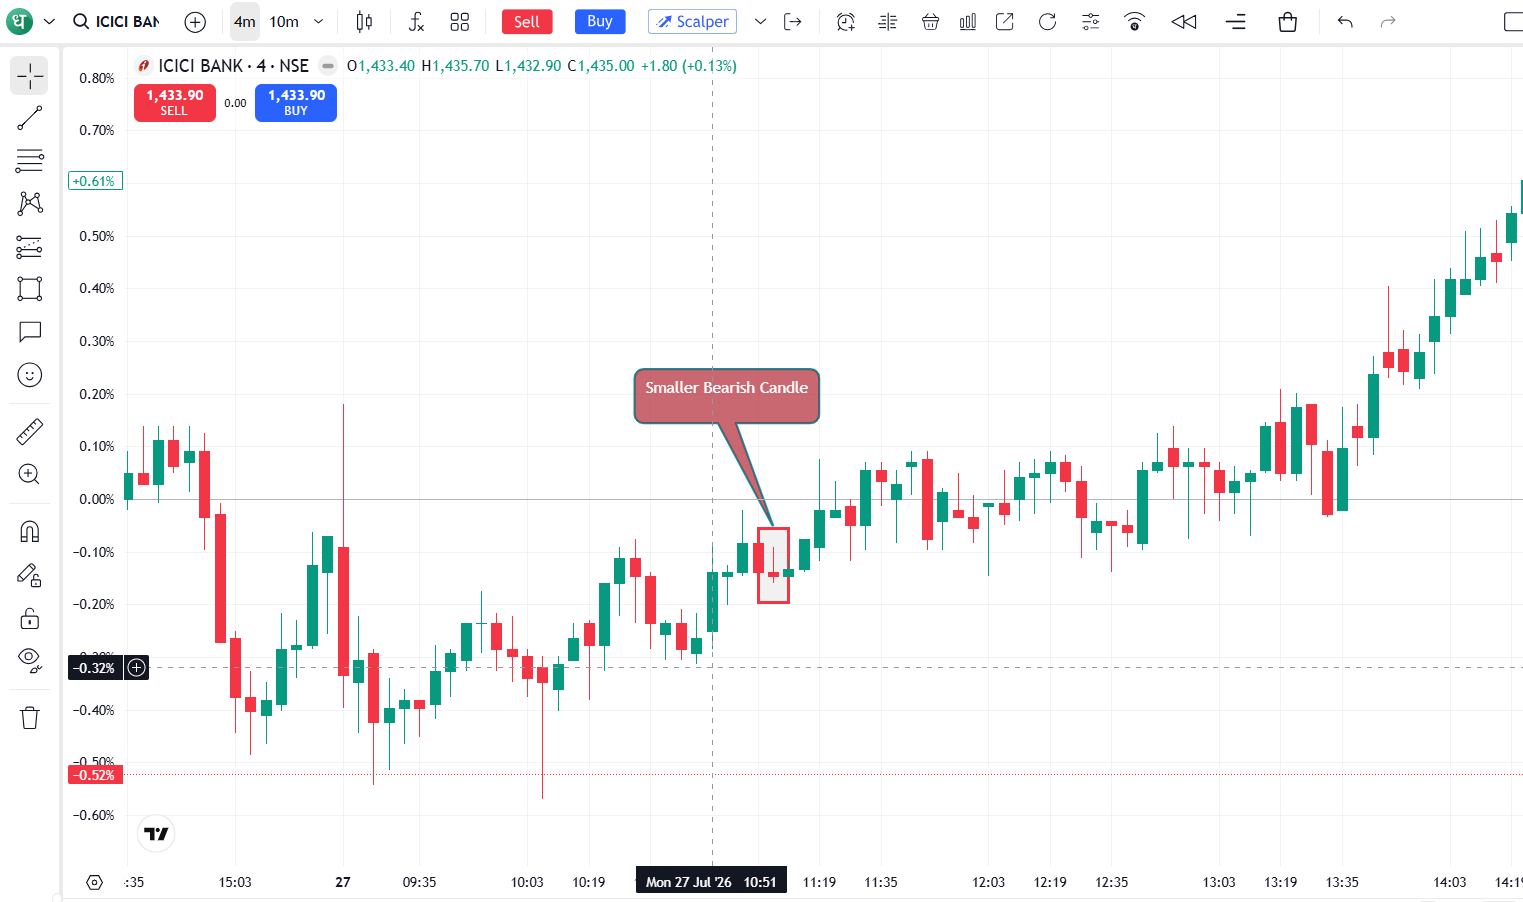
Another bearish candle appears in the next session, but its real body is completely inside the previous candle’s body.
Prices are still closing lower than they are opening, but the candle size has reduced, indicating bearish momentum is weakening.
Step 3: Bullish confirmation
The next candle should close above the high of the second candle or make a strong bullish candle This confirmation indicates that buyers have begun to take over and raises the chances of a bullish reversal.
Traders should not enter a trade based on the homing pigeon pattern alone without this third candle.
Psychology behind the Homing Pigeon Pattern
Being familiar with the look of a candlestick pattern is not as useful as knowing the psychology behind it.
Here’s what happens during the homing pigeon formation:
- The first bearish candle represents aggressive selling.
- Most traders expect the downtrend to continue.
- At the next session sellers are trying to push the fall, but can not form another big bearish candle.
- The smaller second candle indicates the selling pressure is losing steam.
- Buyers are starting to absorb selling pressure, and if they step in during the next session, a reversal is possible.
That change in momentum is why more experienced traders wait for confirmation, rather than assuming every homing pigeon pattern will result in an upward move.
How to trade the Homing Pigeon Candlestick?
The homing pigeon pattern should not be taken as a stand-alone buy signal. Instead, traders should wait for confirmation and use it in conjunction with technical analysis tools to increase the probability of success.
Discipline in trading is about knowing the trend, waiting for the confirmation and proper risk management.
Step 1: Confirm the existing downtrend
The pattern is more meaningful when seen after a prolonged price decline.
Don’t trade the pattern if it occurs at:
- Sideways markets
- Choppy price action
- Strong uptrends
A real downtrend means sellers have been in control and any loss of bearish momentum is more meaningful.
Step 2: Wait for a bullish confirmation candle
There are many traders who make the mistake of entering after the second candle has formed. Instead, wait for the next candle to confirm buyers stepping in.
A strong confirmation could be:
- A bullish candle closing above the high of the second candle
- A bullish candle with good momentum
- Breaking out above a resistance level close by
Confirmation decreases the chance of a false reversal.
Step 3: Plan your entry
Traders may consider a long position after the bullish confirmation candle closes. This helps validate that buyers are gaining control.
- Conservative entry: Trade when the confirmation candle closes above the high of the second candle. This may be a bit more expensive to enter, but it helps to mitigate the risk of false signals.
- Aggressive entry: If you see strong buying momentum, experienced traders can enter at the confirmation candle. This allows you to get in earlier but is more risky if the breakout does not work.
Step 4: Place your stop-loss
A stop-loss helps to limit potential losses if the market continues to decline.
Typical stop-loss placements are:
- Below the low of the second candle
- Below the low of the entire homing pigeon pattern
- Below the nearest support level for additional protection
Do not set the stop-loss too close to the entry because normal market fluctuations can trigger the stop-loss too early.
Step 5: Set your profit target
There are many ways to set a profit target.
Many investors opt for:
- The next resistance level
- A previous swing high
- A trailing stop-loss to capture larger trends
Having exit strategies pre-determined helps you to avoid making emotional decisions during the trade.
Best timeframes for the Homing Pigeon Pattern
The pattern is visible on various chart timeframes.
However its reliability generally increases on higher timeframes as they are less active in the market.
Regardless of the time frame, always confirm the pattern with price action and supporting indications.
Common mistakes to avoid with Homing Pigeon Pattern
Many traders struggle with candlestick patterns because they are only looking at the candle formation and not the broader market context.
Here are some common mistakes to avoid:
Entering without confirmation
When the second candle forms , it can give you false signals if you jump into a trade right away . Always wait for a bullish confirmation candle to enter a position.
Ignoring the overall trend
The homing pigeon pattern works best after a clear downtrend. It’s less reliable if it happens in an uptrend or sideways market.
Skipping risk management
Not using a stop-loss or risking too much capital in one trade can result in large losses. Always define your risk before you enter a trade.
Ignoring volume
The more volume there is on the candle that confirms the reversal, the more powerful the signal. Low volume can be a sign of weak buying interest and an increased risk of the trade failing.
Depending on one indicator
Don’t just use the homing pigeon pattern. Use it with RSI, MACD or support and resistance levels for better confirmation.
Conclusion
The homing pigeon candlestick pattern is a useful bullish reversal pattern that traders may utilise to find possible buying opportunities in markets following a long downtrend. While it does imply that the selling pressure may be decreasing, it does not necessarily mean a trading signal in itself.
The homing pigeon candlestick pattern is a useful bullish reversal that can help traders to spot buying opportunities in a long downtrend. It does signal that the selling pressure may be diminishing, but should not be taken as a trading signal in a standalone manner.
FAQs
Is the homing pigeon candlestick pattern bullish or bearish?
The homing pigeon is a bullish reversal candle pattern. It usually occurs after a downtrend and indicates that selling pressure is diminishing. But traders should always wait for a bullish confirmation candle before taking a long position.
How reliable is the homing pigeon candlestick pattern?
The pattern offers a moderate level of reliability when used alone. It becomes more effective when combined with technical indicators such as RSI, MACD, volume analysis and support and resistance levels. Waiting for confirmation may also help to avoid false signals.
What is the difference between the homing pigeon and the bullish harami pattern?
The pattern is moderately reliable as a stand-alone tool. It works better when paired with technical indicators like RSI, MACD, volume analysis and support and resistance levels. Also, waiting for confirmation cuts down on false signals.
Can beginners use the homing pigeon pattern?
Yes. The pattern is relatively easy to spot because it has only two candles. However, it is suggested that beginners not trade it alone and first learn about trend analysis, support and resistance and risk management.
Does the homing pigeon pattern guarantee a trend reversal?
No. As with all technical analysis patterns, the homing pigeon is not a guaranteed reversal. It just means the bearish momentum may be running out. Price action and other technical indicators are used to confirm a trade before taking it.







