



Bullish Rectangle Pattern








Key takeaways
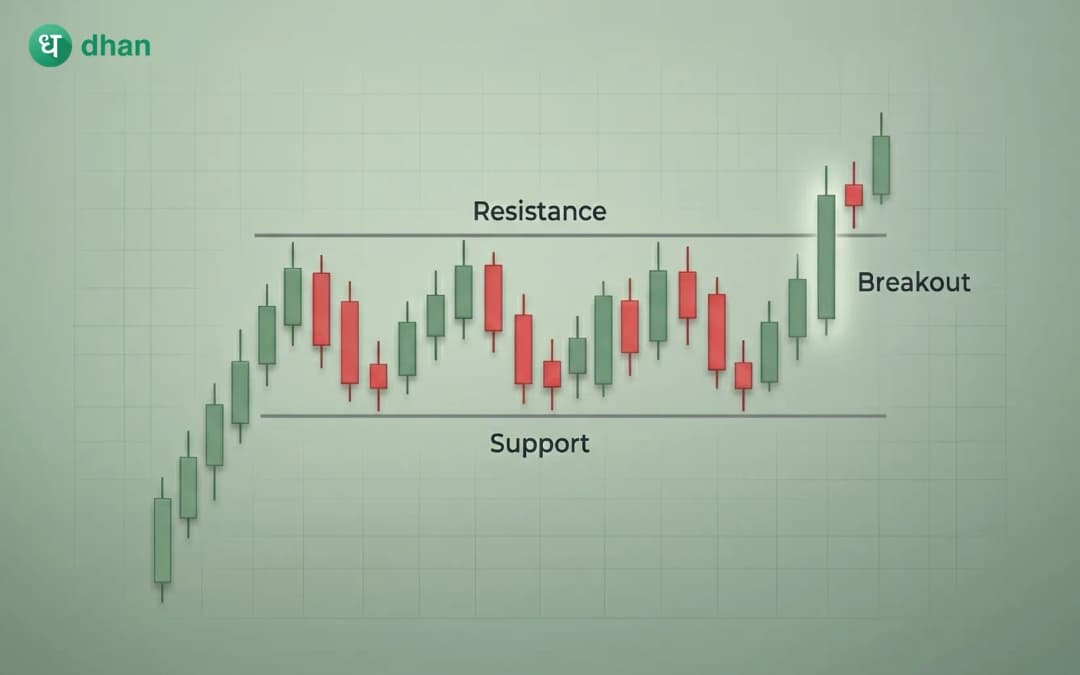
- The bullish rectangle pattern is defined by horizontal support and resistance levels with the price consolidating within a defined range.
- A breakout of the resistance level, usually with a volume increase, confirms the pattern and suggests a possible trend continuation.
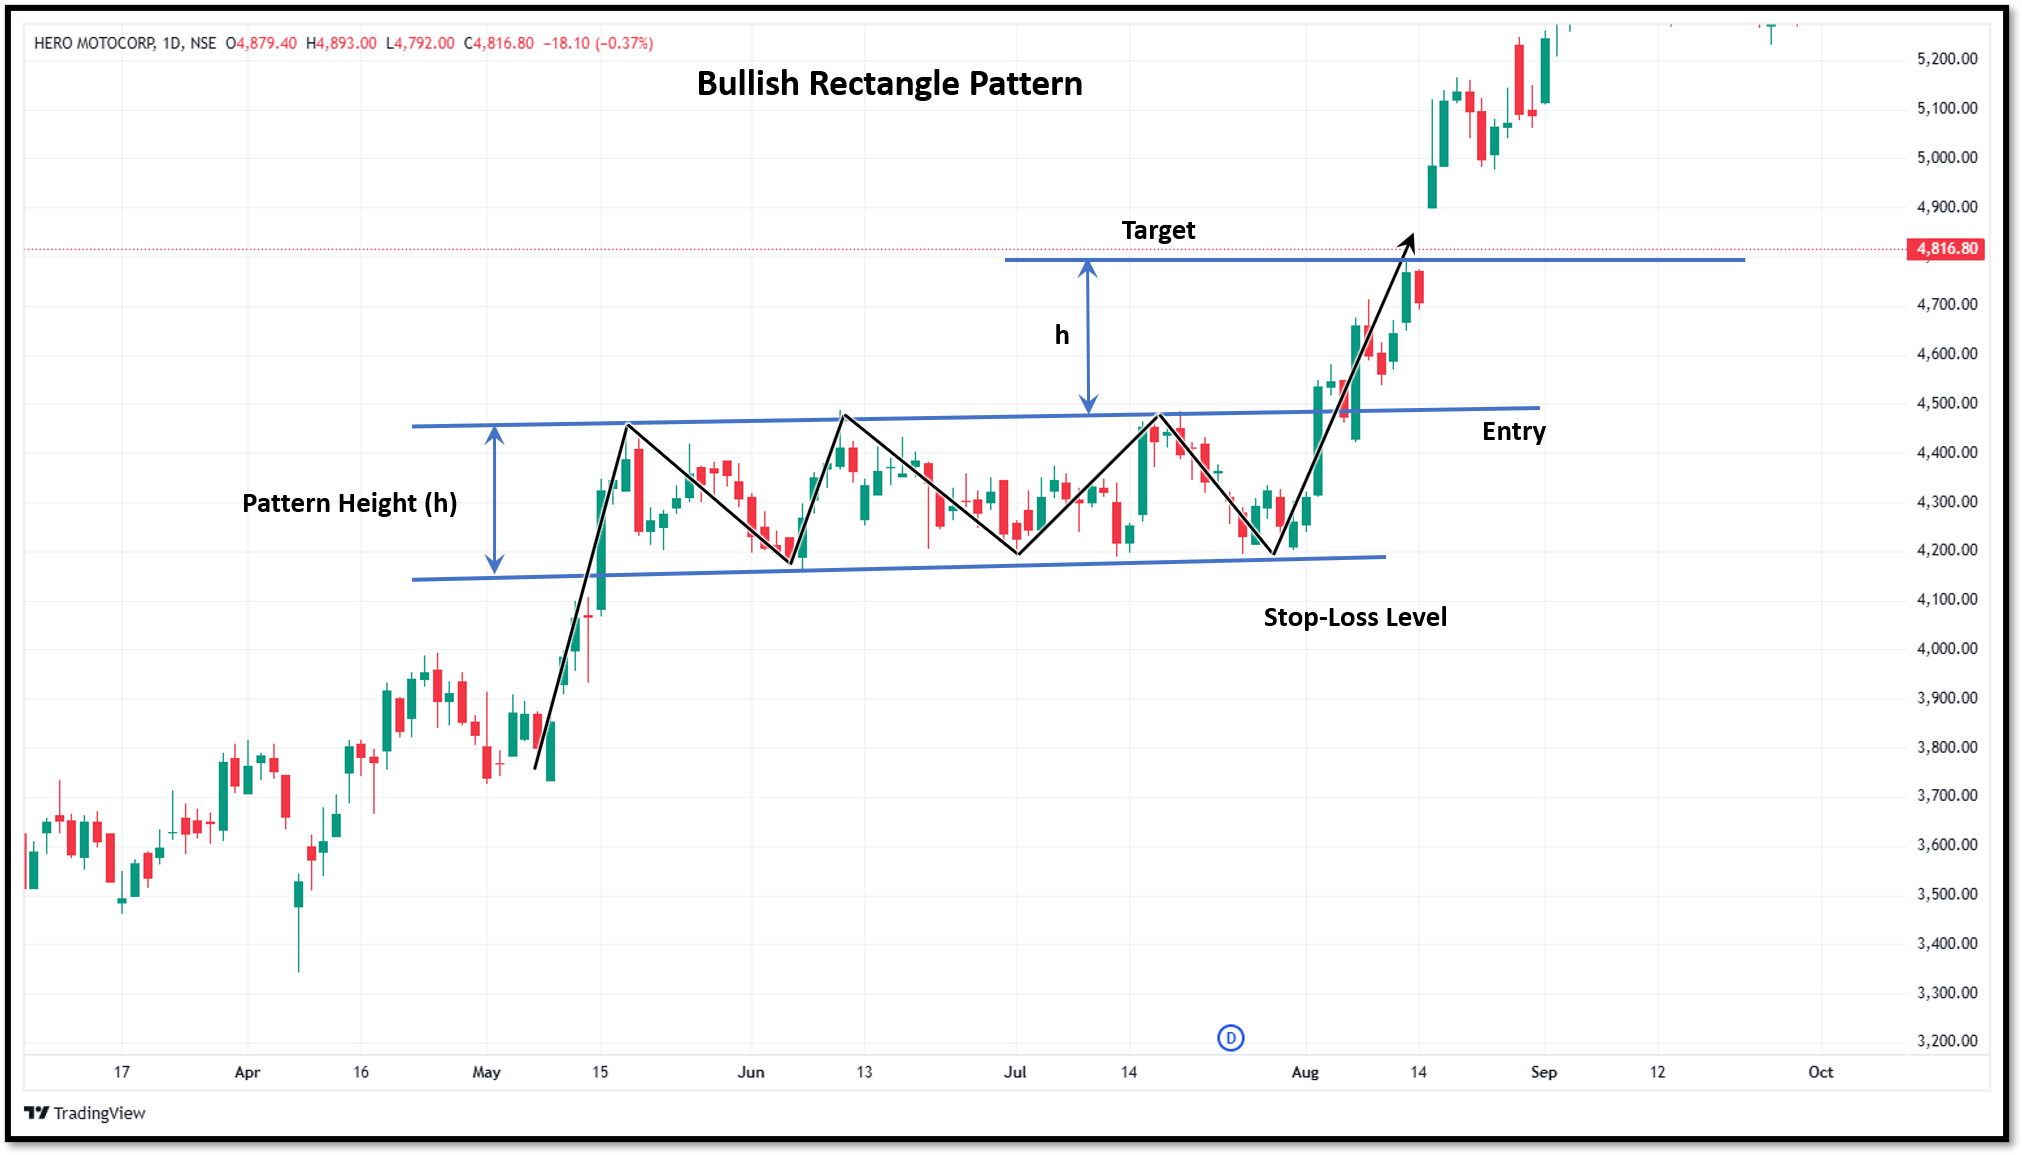
- Traders often add the height of the rectangle to the breakout level to determine the price target, using stop-losses to control risk.
In the market, strong uptrends often pause, consolidate and then push higher. During these pauses, chart patterns are formed that traders use to identify potential trade opportunities.
For traders, a bullish rectangle can help to identify potential entry points, set realistic profit targets, and manage risk more effectively. This guide will discuss what a bullish rectangle pattern is, how it forms and how to trade it.
What is a Bullish Rectangle Pattern?
A bullish rectangle pattern is a continuation chart pattern that develops during an established uptrend.
It appears when the price is moving sideways between two parallel horizontal levels after a strong upward movement. The upper line is resistance, the lower line is support.
The pattern suggests the buyers are taking a short pause before trying to push prices higher again. The pattern is validated when the price breaks through the resistance level on high volume.
How does a Bullish Rectangle Pattern form?
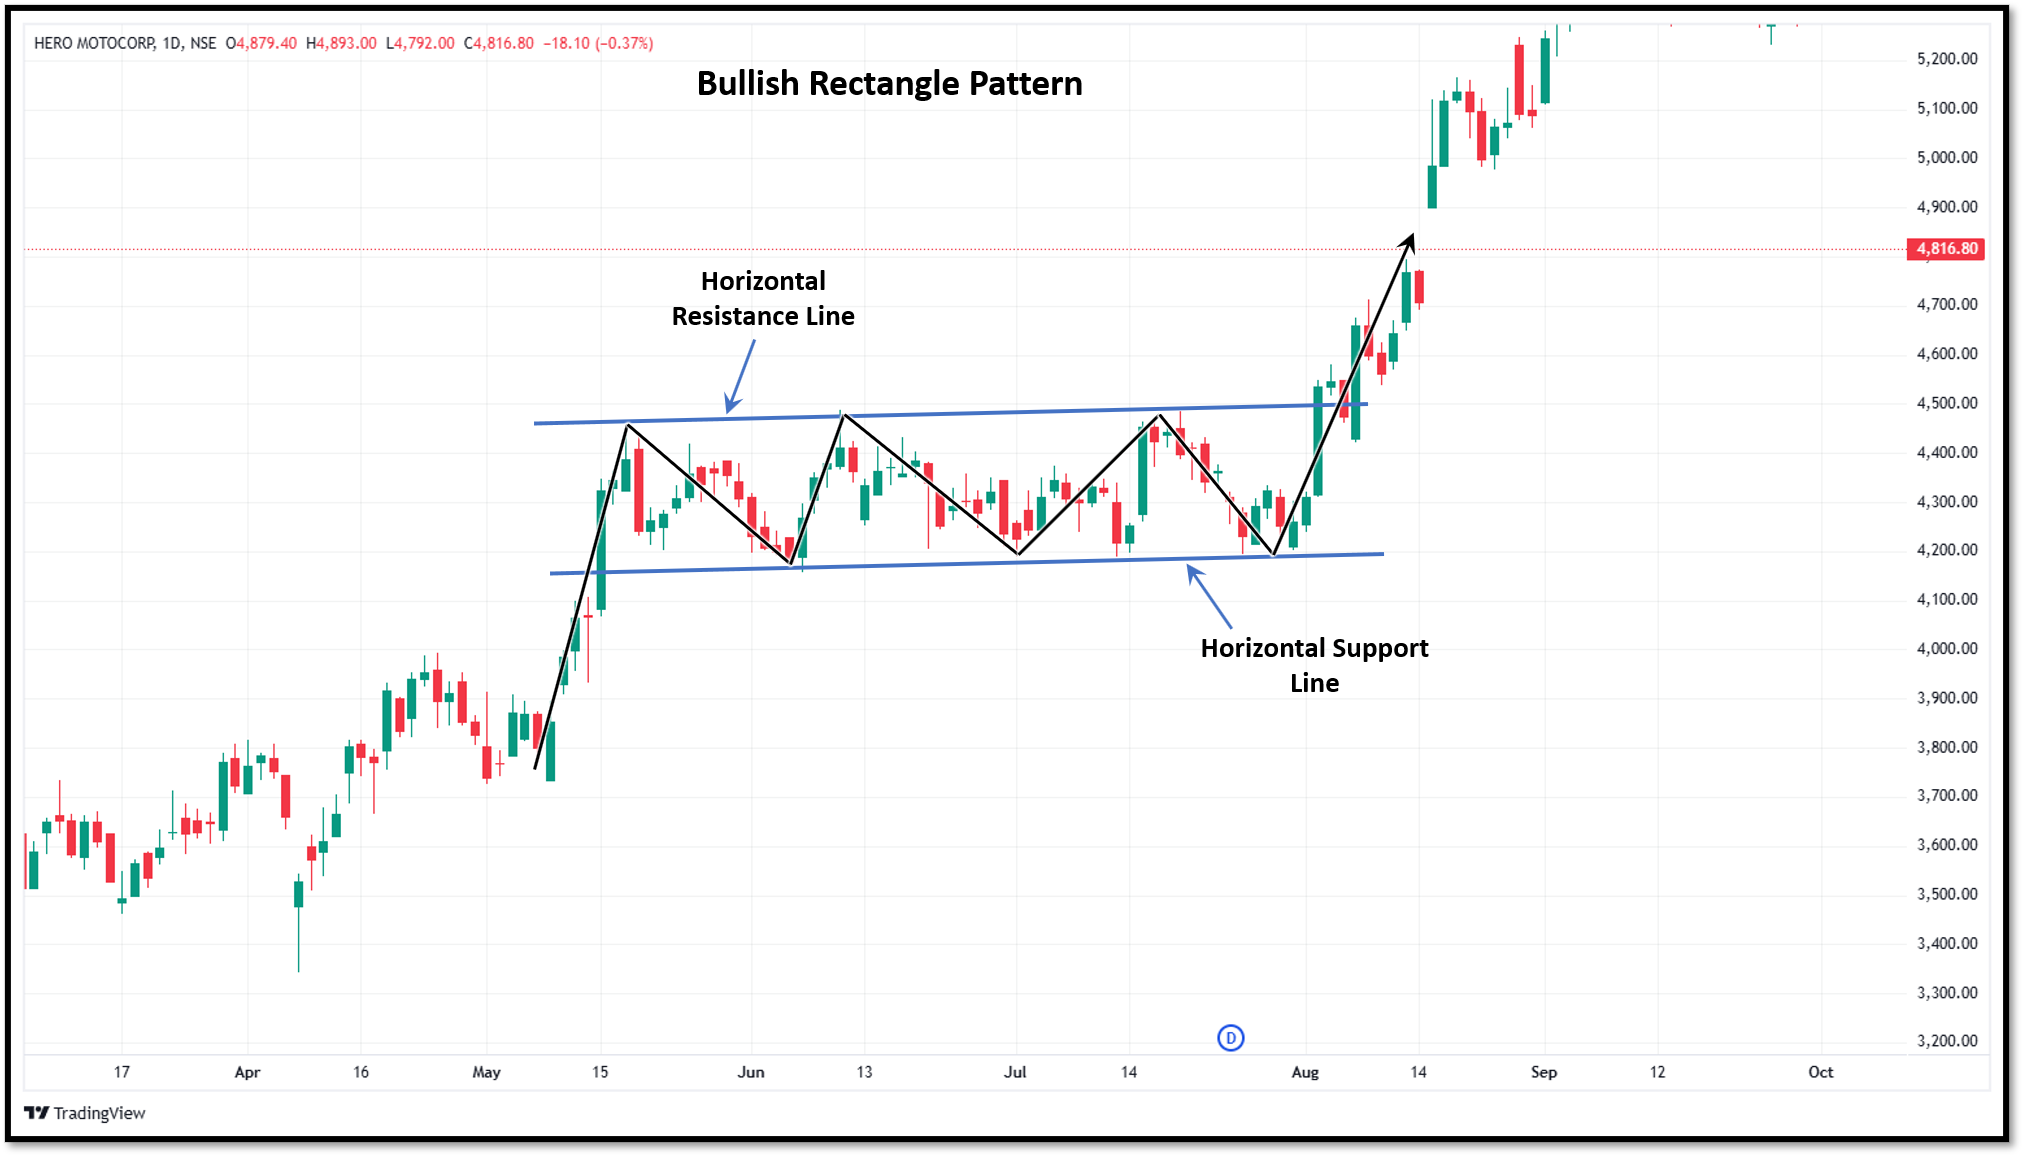
The formation of a bullish rectangle follows the sequence:
Step 1: Strong movement
Positive sentiment, high earnings, sector momentum or increased buying interest increases stock price dramatically.
Step 2: Consolidation begins
Some traders will take some profits after a rally; others will keep on adding more positions. Thus, the price of the stock is limited in the range.
Step 3: Multiple support and resistance tests
The price hits the support and resistance levels multiple times, but it does not break the levels. Repeated tests confirm the pattern.
Step 4: Breakout above resistance
Eventually, the buying pressure overcomes the selling pressure. The stock breaks above the resistance level, indicating a possible continuation of the previous uptrend.
A typical bullish rectangle contains:
How to identify a Bullish Rectangle Pattern
You have to look at both price action and market context for the pattern.
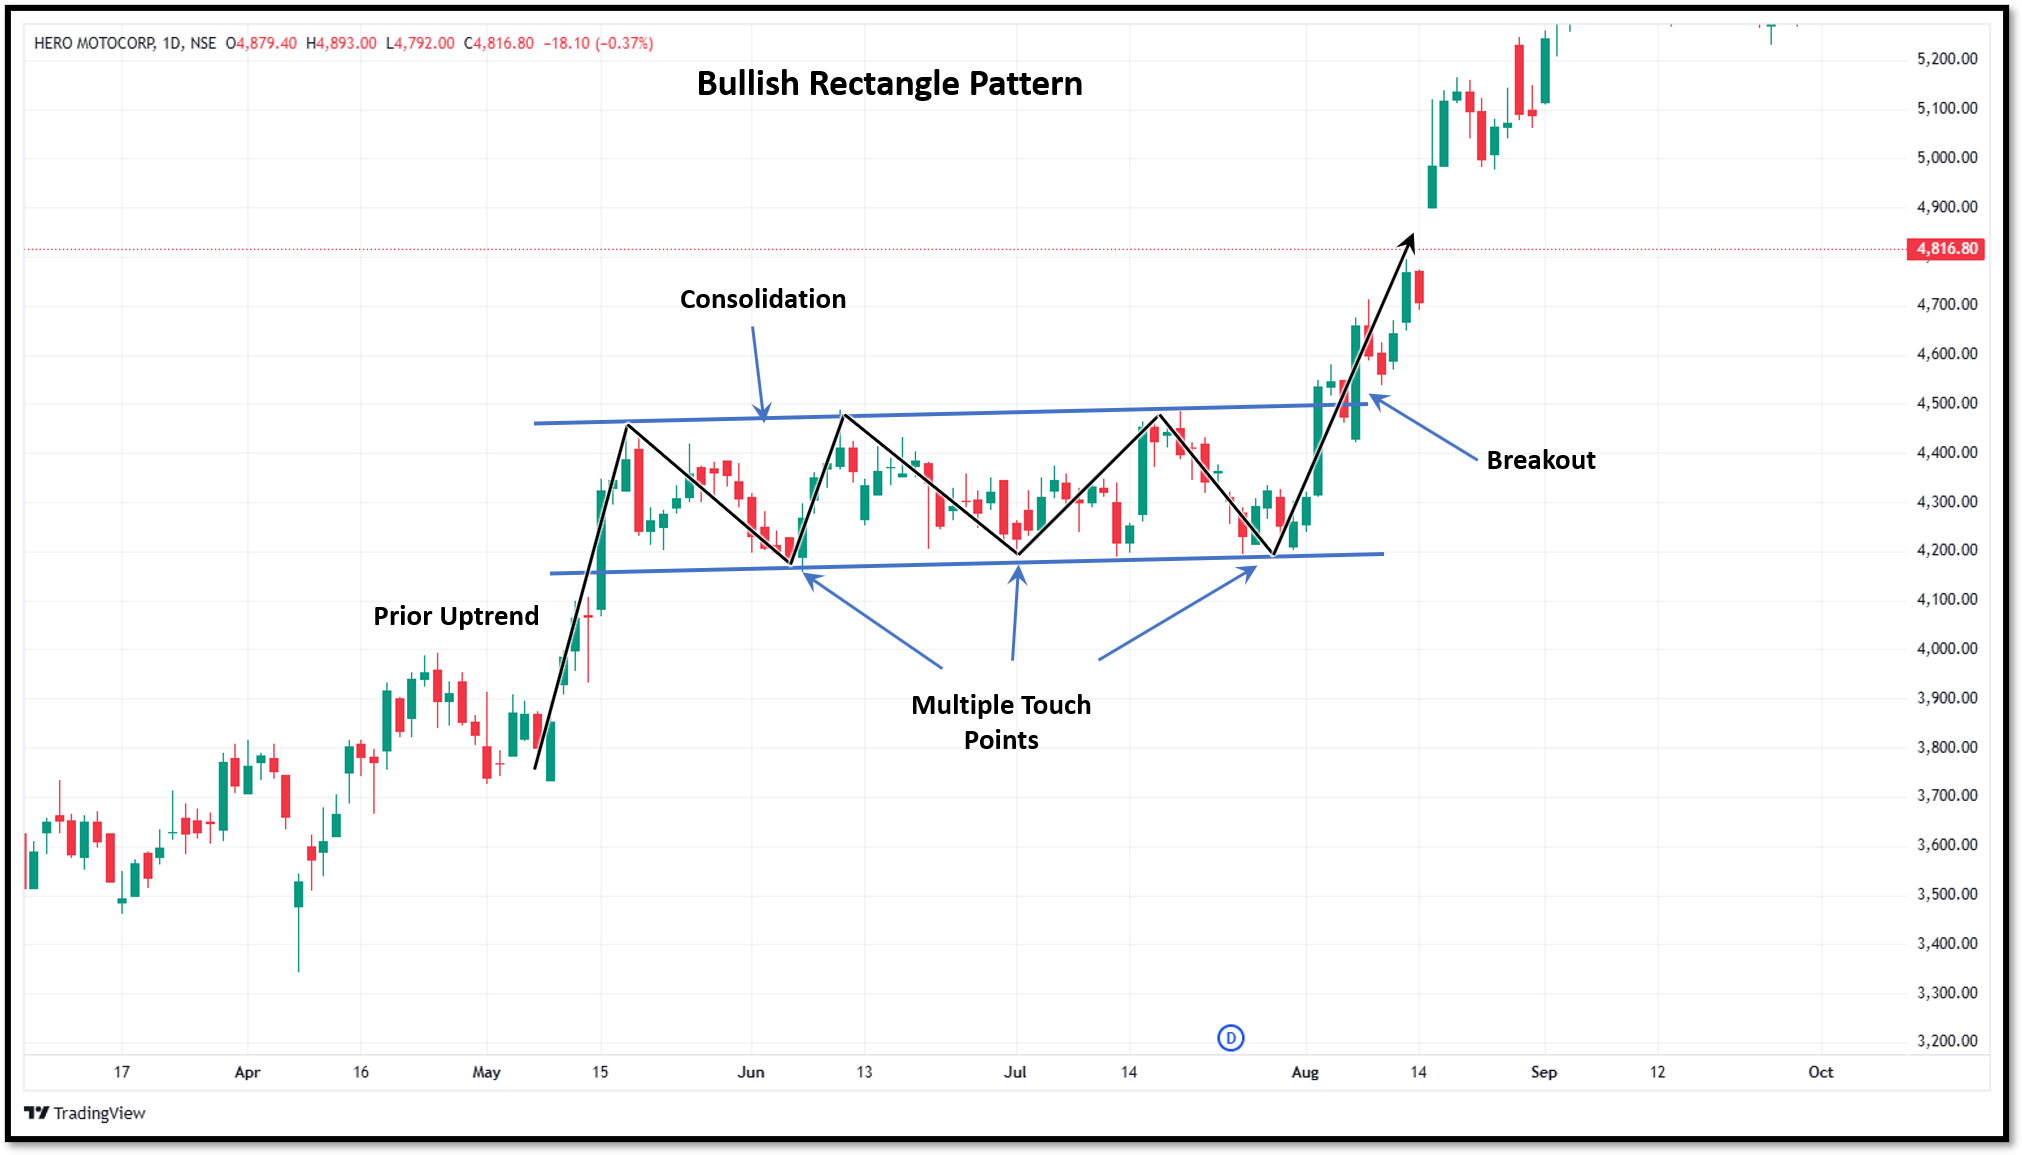
- Look for a prior uptrend: The pattern should appear after a large move up. If there was no previous uptrend, the pattern may be less reliable.
- Draw horizontal support and resistance: Connect the swing highs to form resistance and the swing lows to form support. The lines should be nearly horizontal.
- Confirm multiple price touches: Multiple price touches are better; it will be at least two or three. This indicates that there is a trading range at this level.
- Watch for declining volume: Beware of falling volume; it may well be that volume reduces during a period of consolidation when there is less market participation.
- Wait for breakout confirmation: Breakout above resistance with increased volume offers a more reliable confirmation.
How to trade a Bullish Rectangle Pattern
You can follow the approach below for trading the bullish rectangle pattern.
Identify an existing uptrend
The Bullish Rectangle is a continuation pattern, so it should form after a noticeable upward price movement. If the market has been moving sideways or declining before the rectangle develops, the pattern becomes less reliable.
Confirm the rectangle formation
Draw two horizontal trendlines connecting the recent swing highs and swing lows. The upper line acts as resistance, while the lower line acts as support. The price should bounce between these two levels multiple times.
Wait for a breakout
Avoid entering the trade while the price is still moving inside the rectangle. Instead, wait for a strong bullish candle to close above the resistance level.
Enter the trade
Once the breakout is confirmed, traders can consider entering a long position.
Conservative traders may wait for the first bullish candle after the breakout or for a successful retest of the resistance level. Aggressive traders usually enter immediately after the breakout candle closes above resistance.
Stop-loss
Many traders place the stop-loss just below the rectangle's support level or below the most recent swing low inside the pattern.
Profit target
One common method is the measured move technique. Measure the height of the rectangle by calculating the distance between the resistance and support levels. Then add that distance to the breakout point to estimate a potential price target.
Traders may also use nearby resistance levels, Fibonacci extensions, or a trailing stop-loss to manage their exits.
Advantages of the Bullish Rectangle Pattern
Traders prefer the bullish rectangle pattern because of its clear chart structures and defined trading opportunities. When correctly identified, it can help traders make more informed entry and exit decisions.
The bullish rectangle pattern has several key advantages, including:
Easy to identify
The bullish rectangle pattern is relatively easy to spot, since it has well-defined horizontal support and resistance levels. Traders can easily spot the consolidation range and watch for a potential breakout.
Clear risk management
There are obvious risk management opportunities connected with this pattern. Traders could also put stop-loss trades near the support levels or under the breakout area to limit their losses.
Objective profit targets
The bullish rectangle is a disciplined way to establish profit targets. The height of the rectangle is often used by traders to project a potential price objective after a breakout has been confirmed.
Works across timeframes
Bullish rectangle patterns can appear on charts of any time frame, be it intraday, daily or weekly. This flexibility means that this pattern can be used in analysis by both long- and short-term traders.
Limitations of the Bullish Rectangle Pattern
Although the bullish rectangle pattern can be a useful continuation signal, it is not foolproof. Traders should know its limitations and should use additional methods of confirmation before making trading decisions.
The bullish rectangle pattern has some common limitations, which include:
False breakouts
Sometimes a stock will temporarily break the resistance level, thus appearing to confirm the pattern, before reversing course soon thereafter. Such false breakouts may cause you to enter too soon and possibly lose money.
Volume confirmation is not always present
Higher volume is often used to confirm a breakout, but not all successful breakouts come with a big volume spike. In some market settings, this can make it more difficult to confirm.
Market conditions matter
The effectiveness of the pattern may be affected by the overall market trends. A technically valid bullish rectangle can still be destroyed if the overall market sentiment turns south.
Requires patience
The consolidation phase can last for a long time before the breakout occurs. Traders may need to wait days, weeks or even months for the pattern to fully develop and confirm itself.
Summing up
The bullish rectangle pattern is useful for traders in spotting moments when a strong uptrend pauses before it might continue in the same direction.
No chart pattern is a guaranteed formula for success, but the bullish rectangle can be a valuable addition to a trader’s technical analysis toolbox when combined with good risk management and a broader market analysis. Seeing the pattern develop and confirm can enable traders to make smarter and more disciplined trade decisions.
FAQ’s
1. Is the bullish rectangle pattern reliable?
The bullish rectangle is generally trustworthy when it occurs after a substantial uptrend and is confirmed by a breakout with higher volume.
2. What timeframe works best for a bullish rectangle pattern?
The pattern works on different timeframes. However, daily and weekly charts frequently provide stronger signals than very short-term charts.
3. What is the difference between a bullish rectangle and a flag pattern?
A bullish rectangle is created with horizontal support and resistance levels, and a flag pattern usually slopes against the overall trend.
4. Can beginners trade bullish rectangle patterns?
Yes. This pattern is relatively easy to recognise and has well-defined entry, stop-loss and target levels.
5. Why is volume important in a bullish rectangle breakout?
If the breakout comes with volume, it shows that more buyers are participating and can boost confidence in the sustainability of the uptrend.







