



Double Bottom Pattern




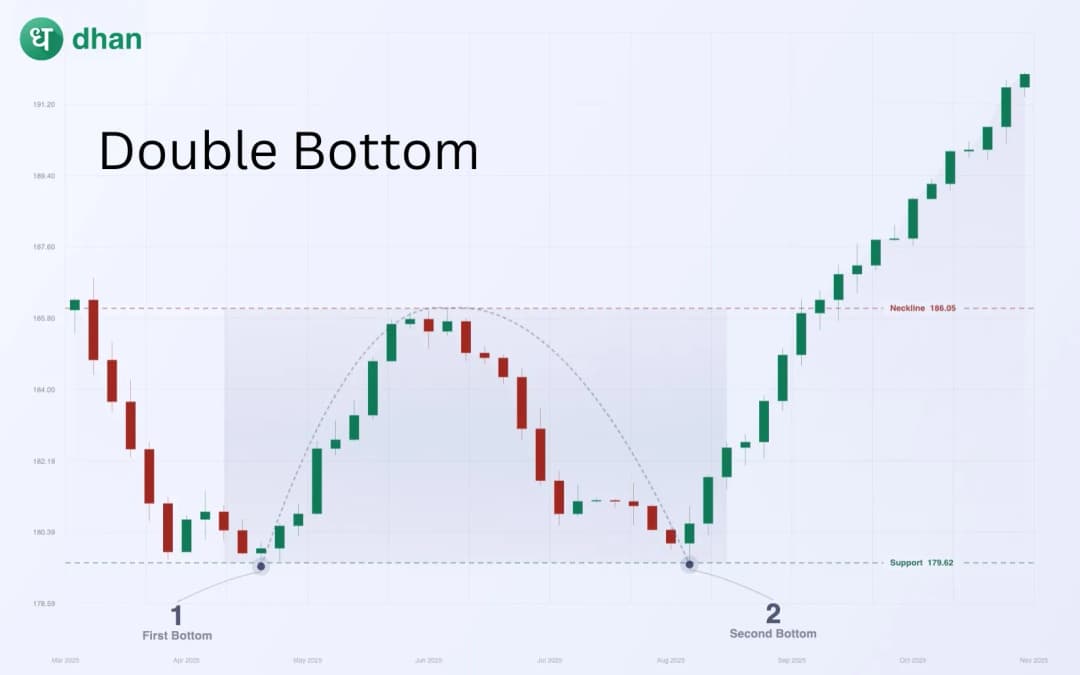




The pattern is very easy to spot and simple to understand. A double bottom pattern is a bullish reversal pattern that usually represents a strong support level. Understanding this pattern will help you gauge when it will work and when it can fail. In this article, we will understand the double bottom pattern, how it works, when to use it and how to use it.
What is a Double Bottom Pattern?
A double bottom is a bullish reversal pattern. It usually forms after a downtrend and signals that sellers are losing control while buyers are stepping in.
In simple terms, the market tries to go down twice but fails both times. That failure becomes the clue.
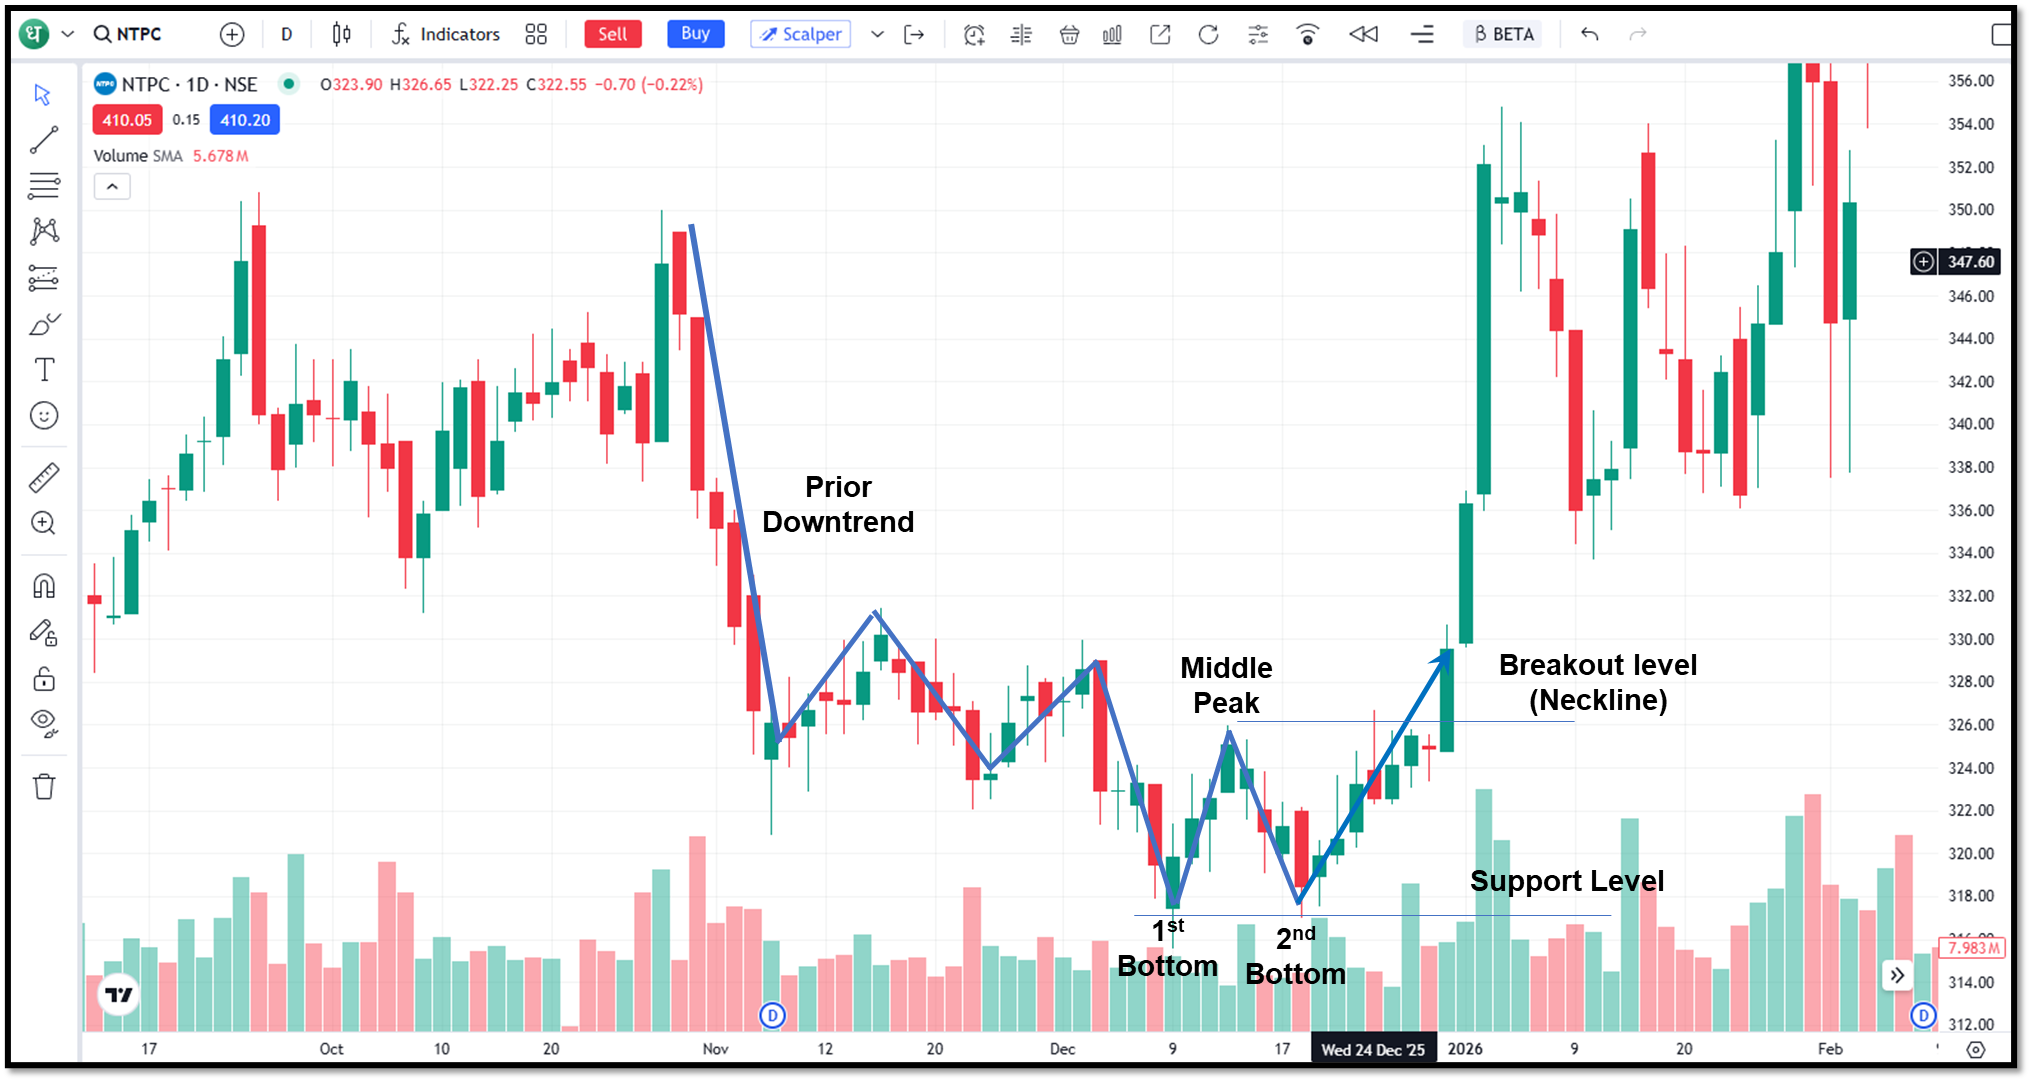
During the formation of a double bottom, it forms a ‘W’ shaped structure, as shown in the figure above. Before the first bottom, there is a prior downtrend. Then the market bounces back, but it is a temporary recovery. Sellers again came to power and pushed the price lower, and tested the same level again. Buyers reject the lower level again and push the price up. Once the price breaks out above the previous high, the double bottom pattern confirms itself.
Why does the Double Bottom Form?
To understand the pattern, you need to understand the psychology behind it.
First bottom
The market is in a downtrend. Sellers are dominant, hence price falls sharply and hits a low. Some buyers step in once the price reaches the resistance level, causing a bounce.
Pullback (the middle peak)
This bounce is not strong enough to reverse the trend. It’s more like a pause. Many traders still believe the downtrend will continue.
Second bottom
Price falls again and reaches near the same level. But this time, you can notice the following changes:
- Selling pressure is weaker.
- Buyers step in earlier.
- The market refuses to break lower, and the price reverses again.
Breakout
Once the price crosses the resistance (the neckline), it confirms that buyers have taken control.
Key Components of Double Bottom Pattern
To use the double bottom properly, you need to identify its parts clearly.
Prior downtrend
The pattern only makes sense after a clear downtrend. Without that, it’s just random price movement.
First bottom
The first low, which marks the start of the pattern.
Second bottom
This should be close to the first bottom, but not necessarily exact.
Neckline
This is the resistance level formed between the two bottoms.
Breakout
The pattern is only confirmed after the breakout above the neckline.
Identification of Double Bottom
Not every “W” shape is tradable. Here’s what makes a pattern more reliable.
Equal or near-equal lows
Both bottoms should be at the same level. A slight variation is acceptable, but a large gap weakens the pattern.
Time gap between bottoms
If the two bottoms are too quickly formed, the pattern is weak. A large gap can reinforce the pattern.
Volume
The volume tends to increase on a breakout. A lower volume on the second drop can be a sign of weaker selling.
Strong breakout candle
A decisive move above the neckline improves reliability.
How to Trade with a Double Bottom Pattern
There are two approaches which traders usually use for trading with the double bottom pattern: Breakout entry and Early entry. We will see both approaches in detail.
Breakout entry strategy
In this strategy, you wait for the pattern to confirm itself through crossing the neckline. This approach is usually safe, and there are low chances of pattern failure as you enter the trade after confirmation.
But you lose a significant rally which starts from the second bottom, giving you a poor risk-reward ratio.
Early entry strategy
This is an aggressive approach. With this strategy, traders make an entry near the second low, once it appears. Traders use it as it gives a better risk-to-reward ratio. This approach is quite risky because there is a risk of pattern failure and downtrend continuation.
Stop loss placement
Risk management is more important than pattern recognition. The common stop loss levels are described below:
- Below the second bottom (most common)
- Below the structure’s lowest point
Avoid placing stops too tightly. Markets need breathing space.
Target calculation
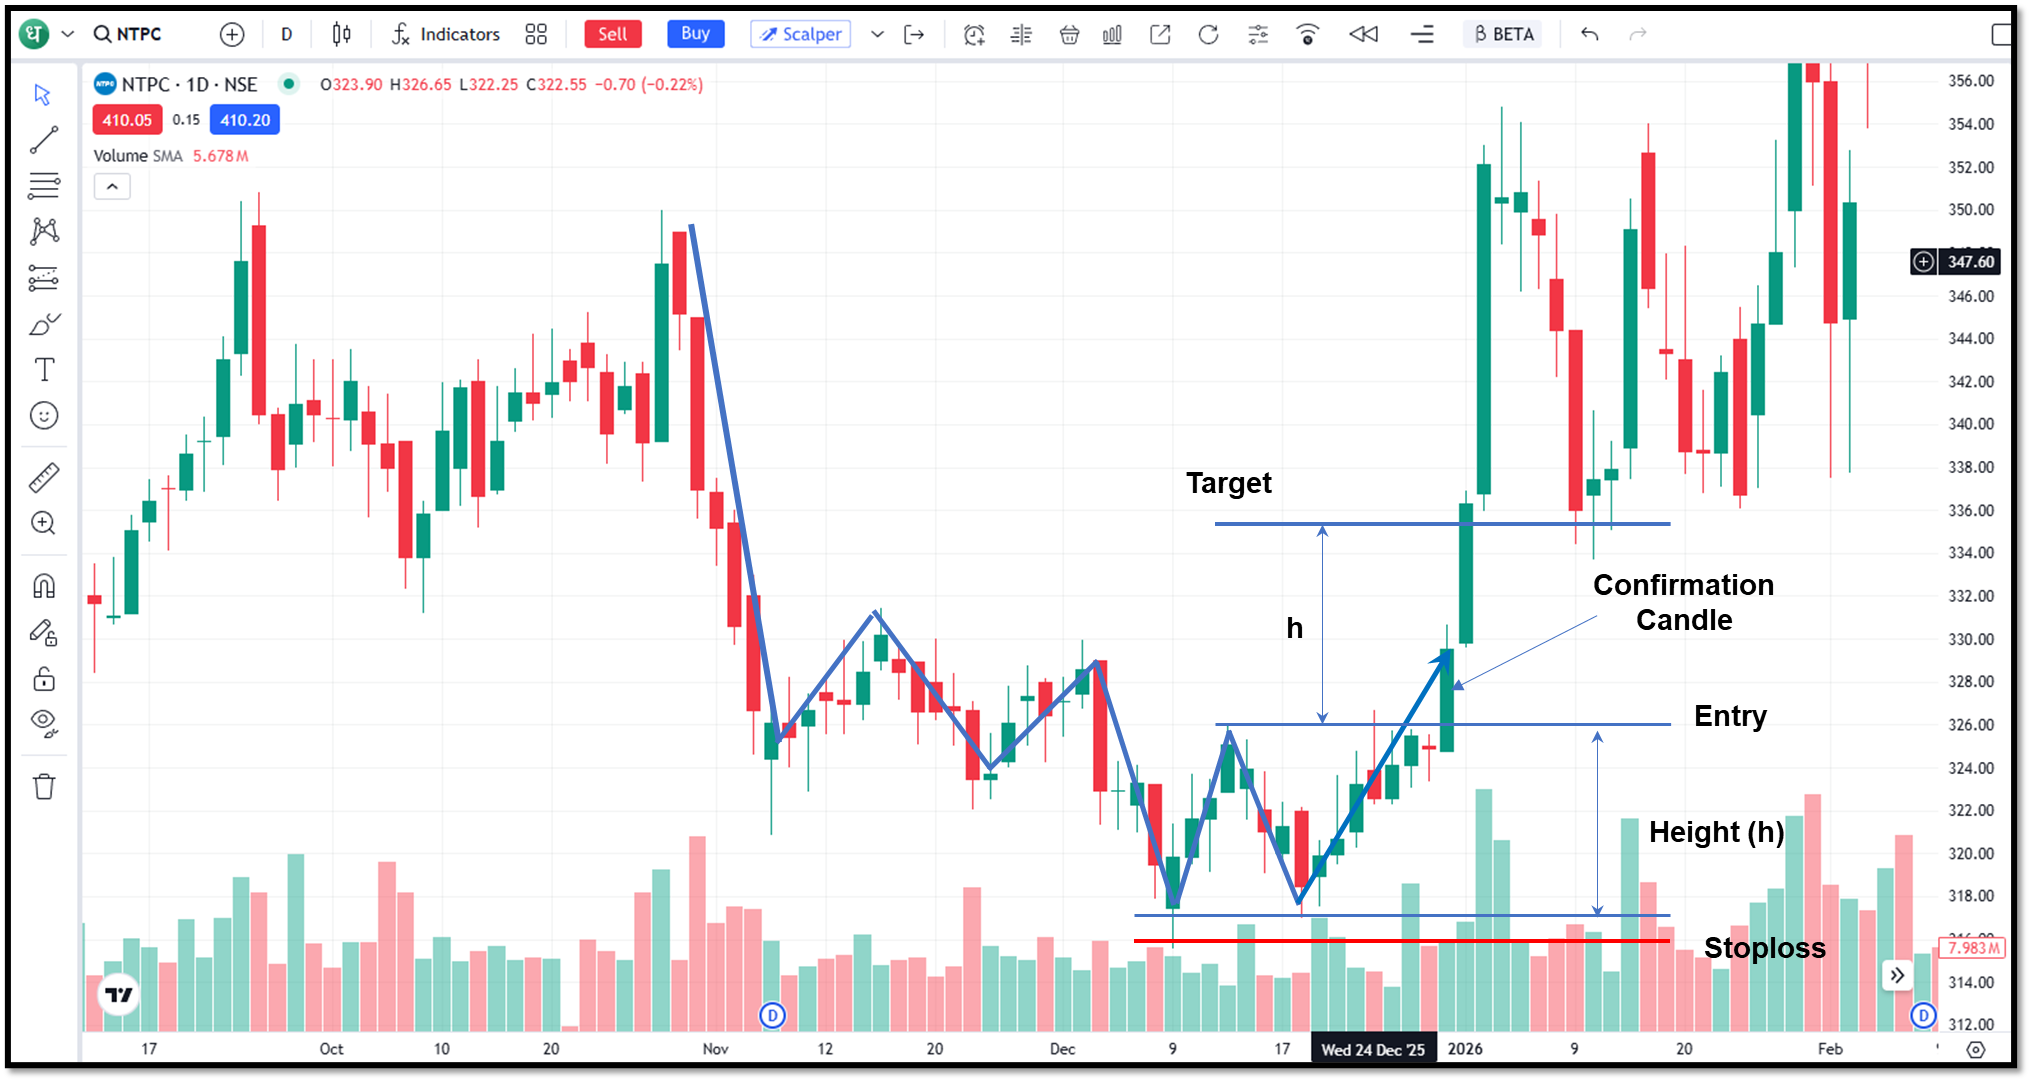
The simplest method to calculate the target is the height projection. Measure the distance from the bottom to the neckline, and add that distance above the breakout level. For example,
Bottom = 100
Neckline = 120
Height = 20 then,
Target = 140
Although this is not guaranteed, you can use it as a reference. Refer to the figure below:
Common Mistakes Traders Make
Traders and beginners should avoid the following mistakes:
- Many traders enter the trade before the pattern confirms itself. It can lead to losses as the price can go against your trade.
- The pattern should be used in a trending market. Using the pattern in sideways markets reduces accuracy.
- Trading for every dip is another common mistake that beginners usually make. The pattern must be recognised with its characteristics before entering.
- Volume confirmation during the breakout is most important. Ignoring volume can lead to weak trades.
- Not using the stop loss is another common mistake. Sometimes, the best setups can fail. You should always use the stop loss.
Failed Double Bottom Pattern
A failed double bottom can lead to sharp moves in the opposite direction. Signs of failure are as follows:
- Weak breakout
- Immediate rejection after breakout
- Breakdown below the second bottom
When it fails, the market usually turns bearish quickly.
Combining with Indicators
The double bottom becomes stronger when combined with indicators. Use the RSI indicator; if it shows bullish divergence during the second bottom, it improves reliability. If the price breaks out above the moving average, it adds confirmation. Also, use a volume indicator for breakout signals.
When to Avoid a Double Bottom Pattern?
Avoid trading double bottoms when:
- The market is highly volatile
- News events are near
- Pattern is unclear
- Volume is weak
- No clear downtrend exists
Sometimes, the best trade is no trade.
Final Thoughts
The double bottom pattern is simple and easy to understand. You can easily spot the ‘W’ formation on charts. The double bottom pattern should not be used alone; use other indicators and confirmation before entering the trade.
Focus on the clean structure, breakout confirmation and proper risk management for effective trading.
FAQs
What exactly confirms a double bottom pattern?
A double bottom is confirmed only when the price breaks above the neckline with strength. The pattern should not be trusted before the breakout.
Is it necessary for both bottoms to be exactly equal?
No, they don’t have to be perfectly equal. A small difference is normal. What matters is that both lows are close enough to show strong support in that area.
Can I trade the pattern before the breakout?
You can trade the pattern before the breakout, but it increases unnecessary risk. Entering before the breakout is an aggressive approach and increases the chances of failure. Most traders prefer to wait for confirmation.
What is the ideal timeframe to trade this pattern?
Higher timeframes, like daily and weekly charts, are more reliable. Lower timeframes tend to produce more false signals due to market noise.
How do I set a target in a double bottom trade?
The common method is to measure the distance from the bottom to the neckline and add that distance above the breakout level. This gives a rough target, not a guaranteed outcome.
Can a double bottom form in a sideways market?
It can appear, but it’s less reliable. The pattern works best when it forms after a clear downtrend.







