



What is a Moving Average?








Technical analysis helps traders understand market trends and make informed trading decisions. But the markets usually move, creating short-term fluctuations. These fluctuations make it difficult to identify the actual trend of a stock or index. As prices rise and fall frequently, this creates unnecessary noise, which confuses the traders.
To simplify the price data points, traders use technical indicators, which also makes it easier to identify trends. One of the most widely used indicators in technical analysis is the moving average.
Because of its simplicity and effectiveness, moving averages are used by both beginner traders and experienced professionals. In this article, we will understand what a moving average is, how it works, the different types of moving averages, and how traders use them to analyse market trends.
What is a Moving Average?
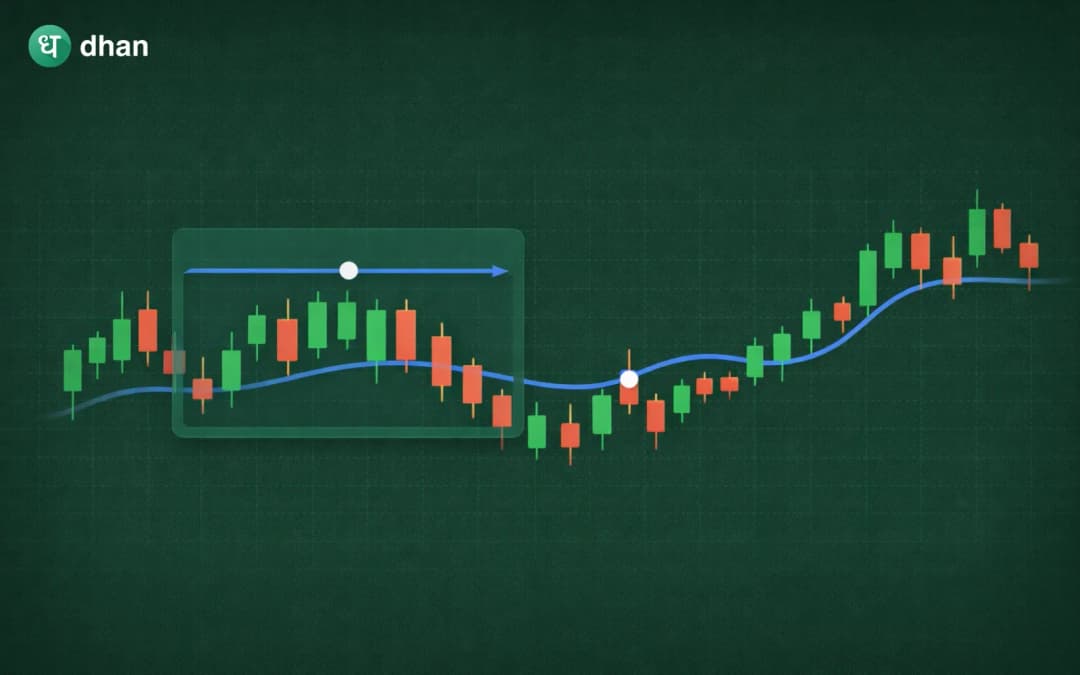
A moving average (MA) is a technical indicator that calculates the average price of a security over a given period of time. The ‘moving’ word represents the calculation that continuously updates as new price data becomes available.
A moving average indicator creates a smooth line on the price chart that represents the average price over a chosen timeframe. This helps traders understand the market trend.
For example, a 10-day moving average calculates the average closing price of the last ten trading days. When the new price is updated on the chart, it removes the oldest price in the calculator and adds the new price to calculate the updated average.
Traders use moving averages to filter out short-term noise and focus on the broader trend. If the price continuously stays above the moving average line, it usually indicates a bullish trend. On the other hand, if prices remain below the moving average, it may signal a bearish trend.
How Moving Averages work?
Moving averages are calculated using historical price data, usually closing prices for a certain period of time. Each time a new price is added, the oldest price in the calculation is removed. This constant updating process causes the average to move along with the price, which is why it is called a moving average.
Traders identify trends more clearly due to the reduced effect of random price fluctuations. It can be confusing to determine the trend from the raw price data if a stock shows frequent ups and downs within a narrow range. Moving average, which makes it easier to see whether the market is moving sideways, upward, or downward.
Types of Moving Averages
The moving averages are calculated with different formulas. Depending on the formula used, moving averages are classified into several types. Some of the key types are given below:
Simple Moving Average (SMA)
The Simple Moving Average (SMA) is calculated by adding the closing prices of a certain period, divided by the number of periods used for calculation. This is the most basic and commonly used moving average.
Formula for calculating SMA
SMA = Sum of closing prices of a certain period/Number of periods
For example, a 20-day SMA calculates the average closing price of the last twenty trading days.
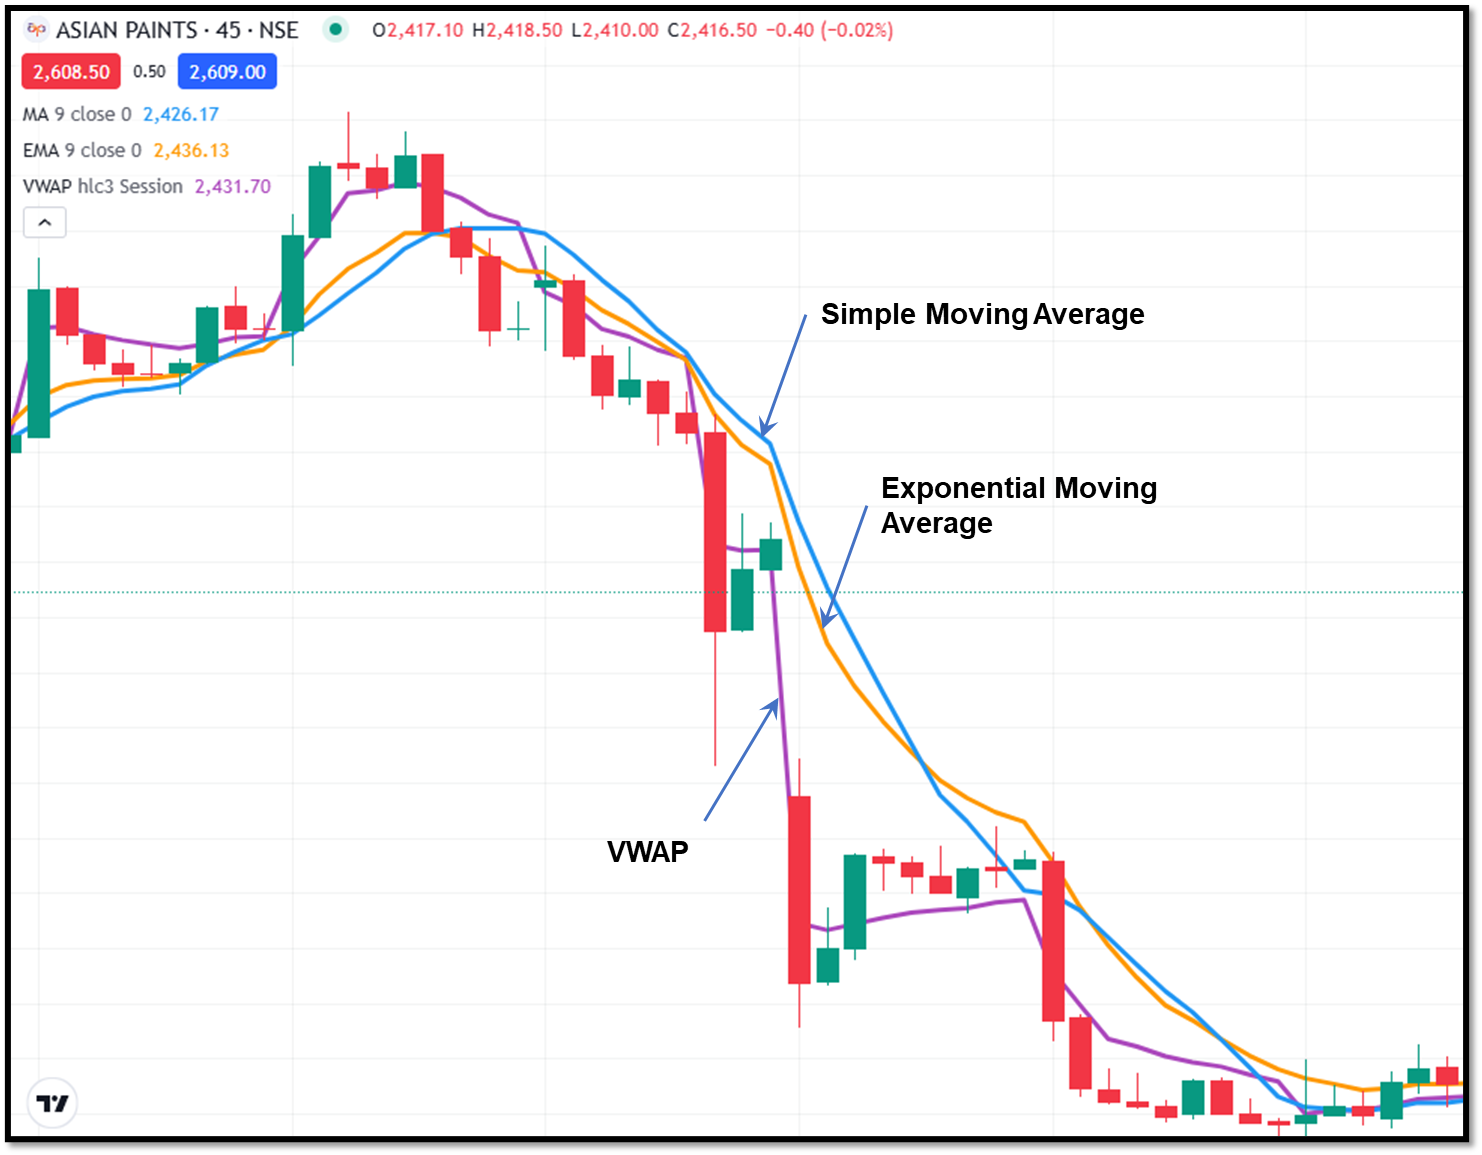
As you can see, SMA does not differentiate between the recent data and the past data. It treats all points equally. This makes the price points smoother, but it reacts slowly to the sudden price change.
Traders and investors use SMA’s like 50-day or 200-day moving averages to identify the overall trend. These levels are also closely watched by institutional investors and can sometimes act as important support or resistance levels.
Exponential Moving Average (EMA)
The Exponential Moving Average (EMA) is designed to respond more quickly to recent price changes. EMA differentiate between the recent data and the past data. It gives more weight to recent prices. Hence, it quickly adjusts itself to the ongoing trend. Due to its reaction time being much quicker than SMA, it identifies the trend earlier than SMA.
This makes it particularly popular among short-term traders and intraday traders who need quicker signals, like day traders and swing traders.
Many traders use 9-period EMA, 12-period EMA, and 21-period EMA while analysing the short-term price movements. Although EMAs provide faster signals, they may also generate more false signals in highly volatile markets.
Weighted Moving Average (WMA)
The Weighted Moving Average (WMA) is another variation where different weights are assigned to price data. In this method, recent prices receive a higher weight, while older prices receive a lower weight.
Compared to the simple moving average, this method makes the WMA more sensitive to the state of the market. On the majority of trading platforms, the SMA or EMA are more frequently utilized than the WMA. Because it strikes a balance between responsiveness and seamless price tracking, many traders favour the EMA.
How traders use Moving Averages in trading
Traders use moving averages in several ways to gauge the market. The following are some of the common interpretations they get from moving averages.
Trend identification
This is the most common use of a moving average. Traders use different moving averages at different periods to identify short-term and long-term trends. It has a simple logic: if the price is trading above the moving average, it is considered an uptrend. If the price is trading below the moving average, it signals a down trend.
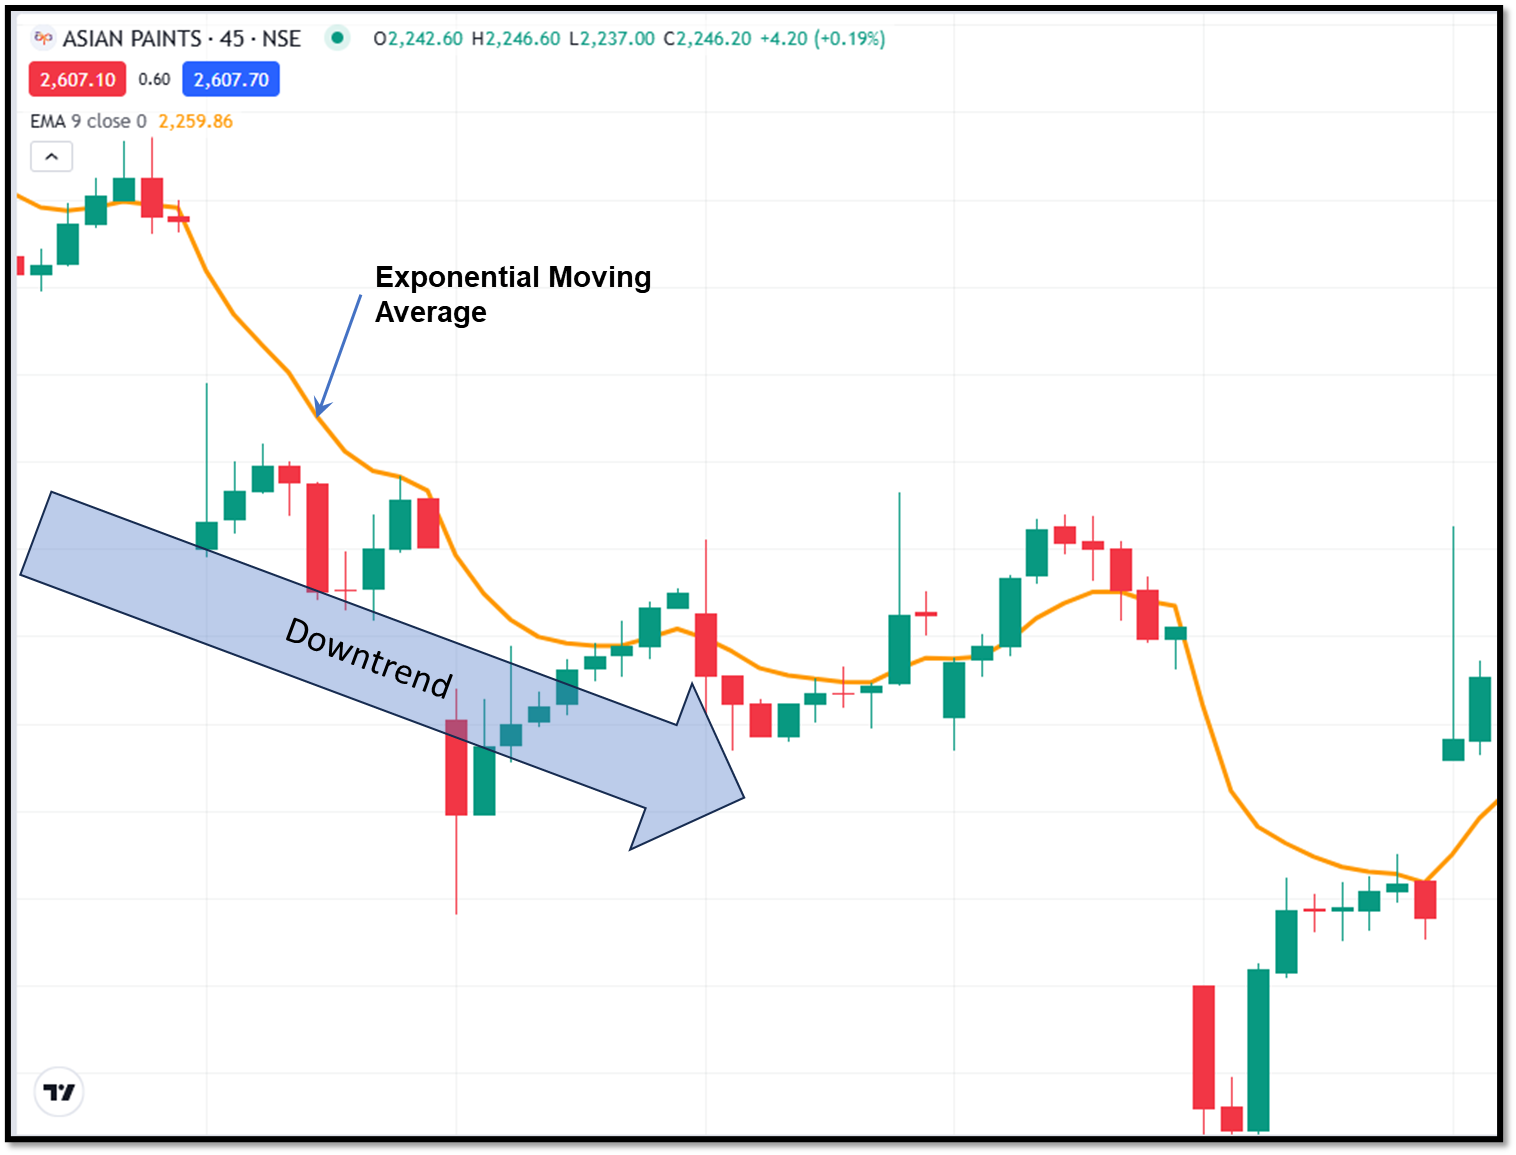
Traders usually use moving averages just to determine whether they should focus on buying opportunities or selling opportunities.
Dynamic support and resistance
Moving averages can also act as dynamic support and resistance levels. During an uptrend, it acts as a support level. If the price pulls back towards the moving average, it may bounce upward from it.
Similarly, in a downtrend, the price may move toward the moving average and then reverse downward. In this case, the moving average behaves like resistance.
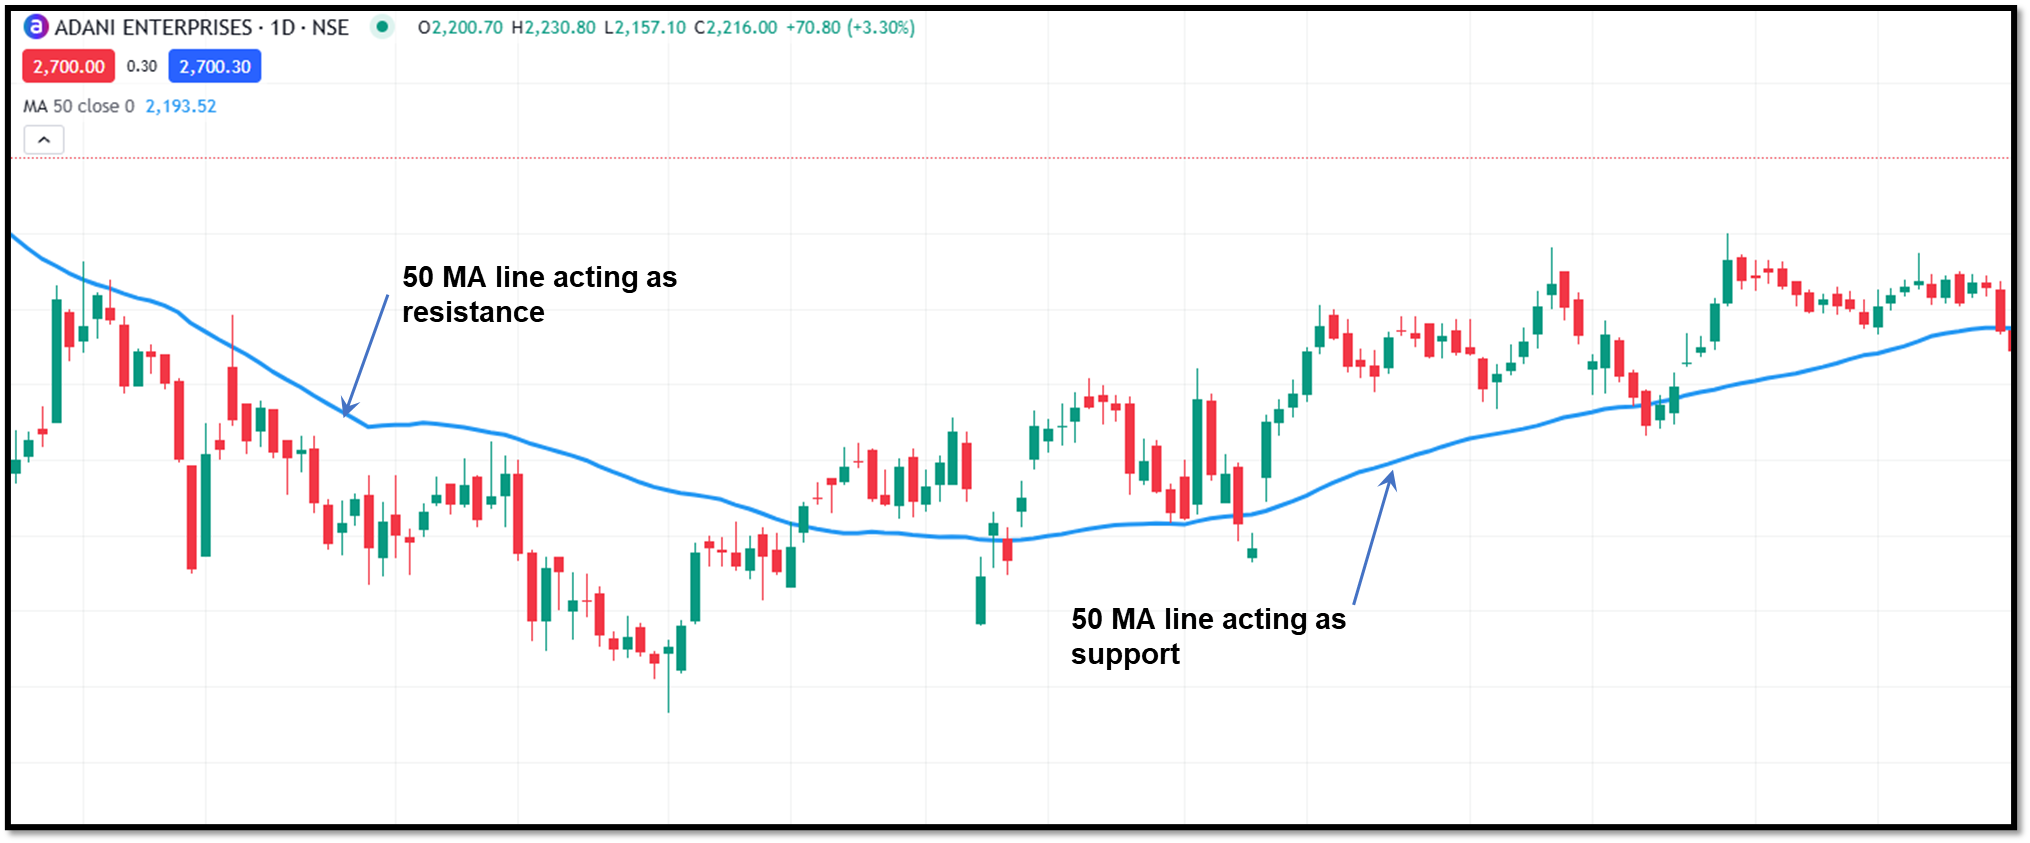
Traders usually watch 50-day and 200-day moving averages, as these levels are more significant.
Moving Average Crossovers
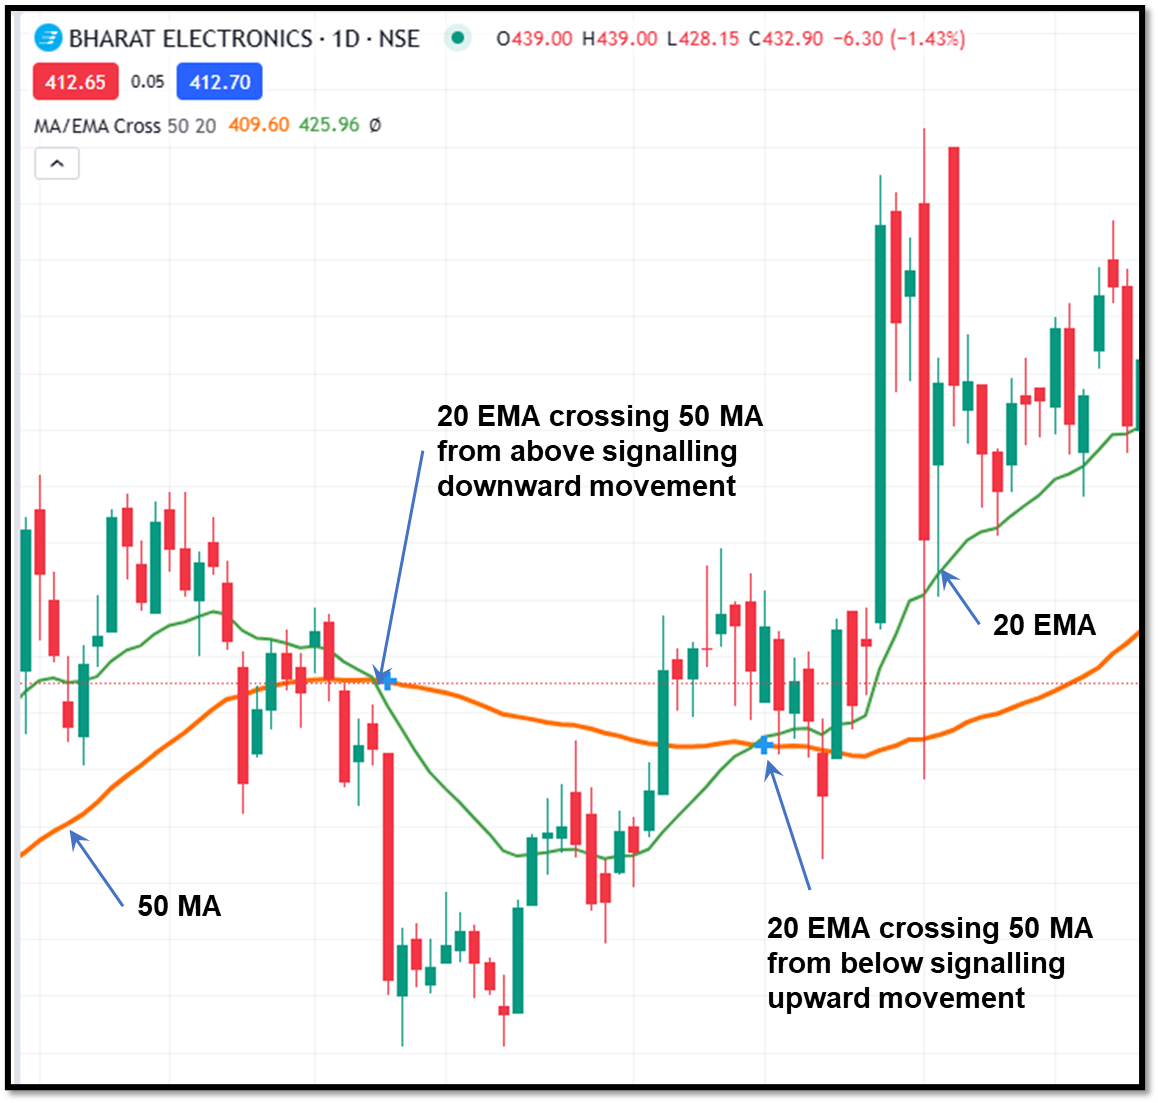
Traders usually use two moving averages together. When a shorter-term moving average crosses above a longer-term moving average, it may signal a potential bullish trend. When a short-term moving average crosses below a longer-term moving average, it may indicate a potential bearish trend.
These crossover signals are widely used by traders to identify possible trend reversals.
Advantages and limitations of Moving Averages
Moving averages have their own advantages and limitations. The following are the advantages of moving averages:
- Moving averages are beginner-friendly and easy to understand.
- They help filter out short-term price noise and provide a clearer view of the market trend.
- Moving averages are widely used during almost every trading style, like intraday trading, swing trading and for long-term investment.
Despite their usefulness, moving averages also have the following limitations:
- Moving averages are considered lagging indicators. They are based on past price data, which means they react after the price has already moved.
- Traders may sometimes receive signals after a significant portion of the price movement has already occurred.
- Moving averages do not perform well in a range-bound market. They tend to generate false signals.
Tips for using Moving Averages effectively
Use the tips below to utilise moving averages effectively.
- Combining multiple moving averages can help to identify stronger trends. For example, traders use a combination of short-term and long-term averages to observe crossover patterns.
- Choose the moving average period as per your trading style. While long-term investors depend on the 200-day moving average, short-term traders might favour quicker averages like the 9 or 20 EMA.
- Many traders used moving averages with momentum indicators, support and resistance levels, or price action analysis to validate the signal.
Conclusion
Moving averages are among the most widely used technical analysis tools. They are very useful in almost all types of trading styles. Traders use them to identify ongoing trend direction and possible support and resistance levels.
There are several types of moving averages, like Simple Moving Average (SMA), Exponential Moving Average (EMA), Weighted Moving Average (WMA), etc., which can be used for different trading styles.
Moving averages should not be used in isolation. Combining them with other technical indicators and price analysis techniques can provide a more reliable trading strategy.
FAQs
What does a moving average show in trading?
A moving average represents the average price of the security over a certain period of time.
Which moving average is best for trading?
There is no single best moving average. Short-term traders use EMA, while long-term investors frequently monitor the 50-day and 200-day moving averages.
Why is the 200-day moving average important?
The 200-day moving average is widely used to identify long-term market trends and is closely watched by institutional investors.
What is the difference between SMA and EMA?
The simple moving average gives equal weight to all prices, while the exponential moving average gives more importance to recent prices.
Can moving averages predict stock prices?
Moving averages do not predict prices. They help traders analyze past price data and identify trends that may influence future market behaviour.







