



Expanding Triangle Pattern








Key takeaways
- The expanding triangle pattern is a chart formation characterised by diverging trendlines and increasing price swings.
- The pattern reflects growing disagreement between buyers and sellers, leading to higher volatility.
- It can act as either a continuation or reversal pattern depending on the prevailing trend and breakout direction.
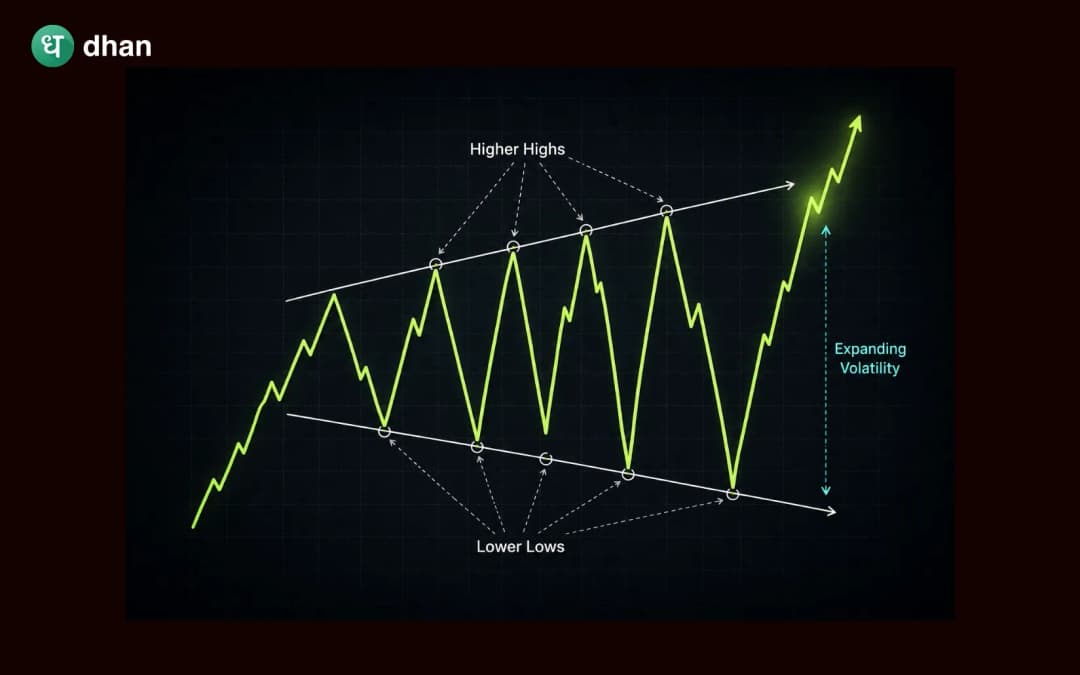
- The pattern consists of higher highs and lower lows, creating a broadening structure.
Financial markets are not always calm and orderly. There are periods when price movements become increasingly erratic, volatility rises, and market participants struggle to agree on value. During these phases, charts usually display formations that reflect uncertainty and emotional decision-making.
The expanding triangle pattern is one of those patterns that represents increased uncertainty in the market. Unlike the classic triangle pattern that tightens over time, an expanding triangle moves in the opposite direction. The swings in price get larger, highs higher, lows lower, and the pattern widens as it develops.
This unique structure makes the expanding triangle one of the most interesting chart patterns in technical analysis. The pattern signals that both buyers and sellers are becoming increasingly aggressive, which causes sharp swings in both directions.
This provides valuable information about volatility, market psychology, and potential breakout opportunities. But the pattern is unpredictable. You cannot gauge the breakout direction; hence, it requires patience and confirmation before you enter the trade.
What is an expanding triangle pattern?
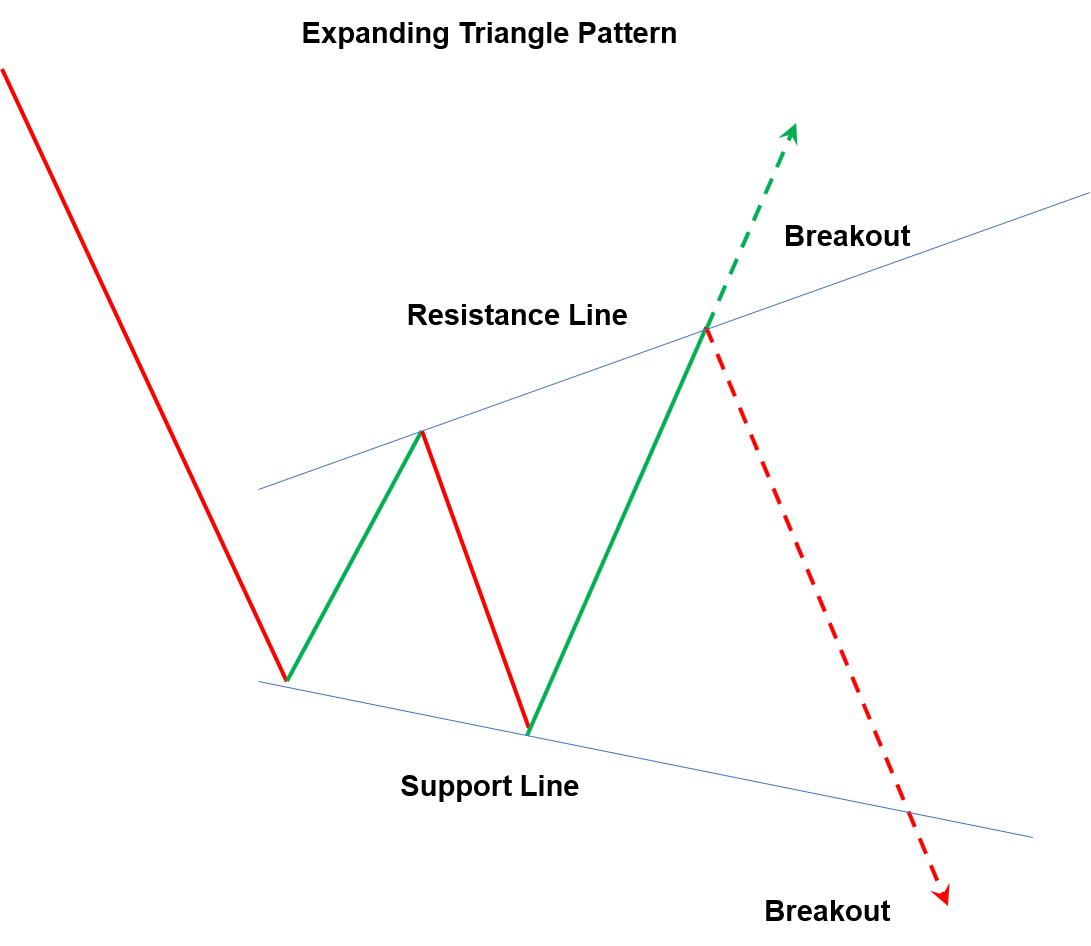
An expanding triangle pattern, also known as a broadening formation, is a chart pattern created by two diverging trendlines. The upper trendline slopes upward because the price continues making higher highs. The lower trendline slopes downward because price simultaneously creates lower lows.
As the pattern develops, the distance between the trendlines increases, giving the formation its characteristic broadening appearance. The expanding triangle represents increasing volatility.
The pattern can appear in both bullish and bearish market environments and may function as either a continuation or reversal pattern depending on the breakout direction.
Why the pattern forms
The expanding triangle reflects growing uncertainty in the market. During normal market conditions, buyers and sellers gradually move toward agreement regarding value.
In an expanding triangle, the opposite occurs. Buyers repeatedly push prices to new highs, while sellers respond aggressively and force prices to new lows. This ongoing struggle creates increasingly larger price swings.
The pattern appears during periods of heightened emotion, speculative activity, major news developments, or changing market expectations.
Because neither side maintains consistent control, volatility continues expanding until a decisive breakout eventually occurs.
Psychology behind the pattern
The psychology of the expanding triangle differs from many other chart formations. In consolidation patterns such as symmetrical triangles, volatility gradually decreases as traders wait for new information.
The widening of the triangle means increasing emotional investment. Buyers get more aggressive with each rally, and sellers are equally aggressive on declines. This causes prices to make higher highs and lower lows, thus creating the expanding triangle pattern.
The resulting higher highs and lower lows reveal growing disagreement about future market direction. Eventually, one side gains enough conviction to break the cycle and establish a new trend.
Key characteristics of an expanding triangle pattern
Several features help traders identify the pattern correctly.
Diverging trendlines
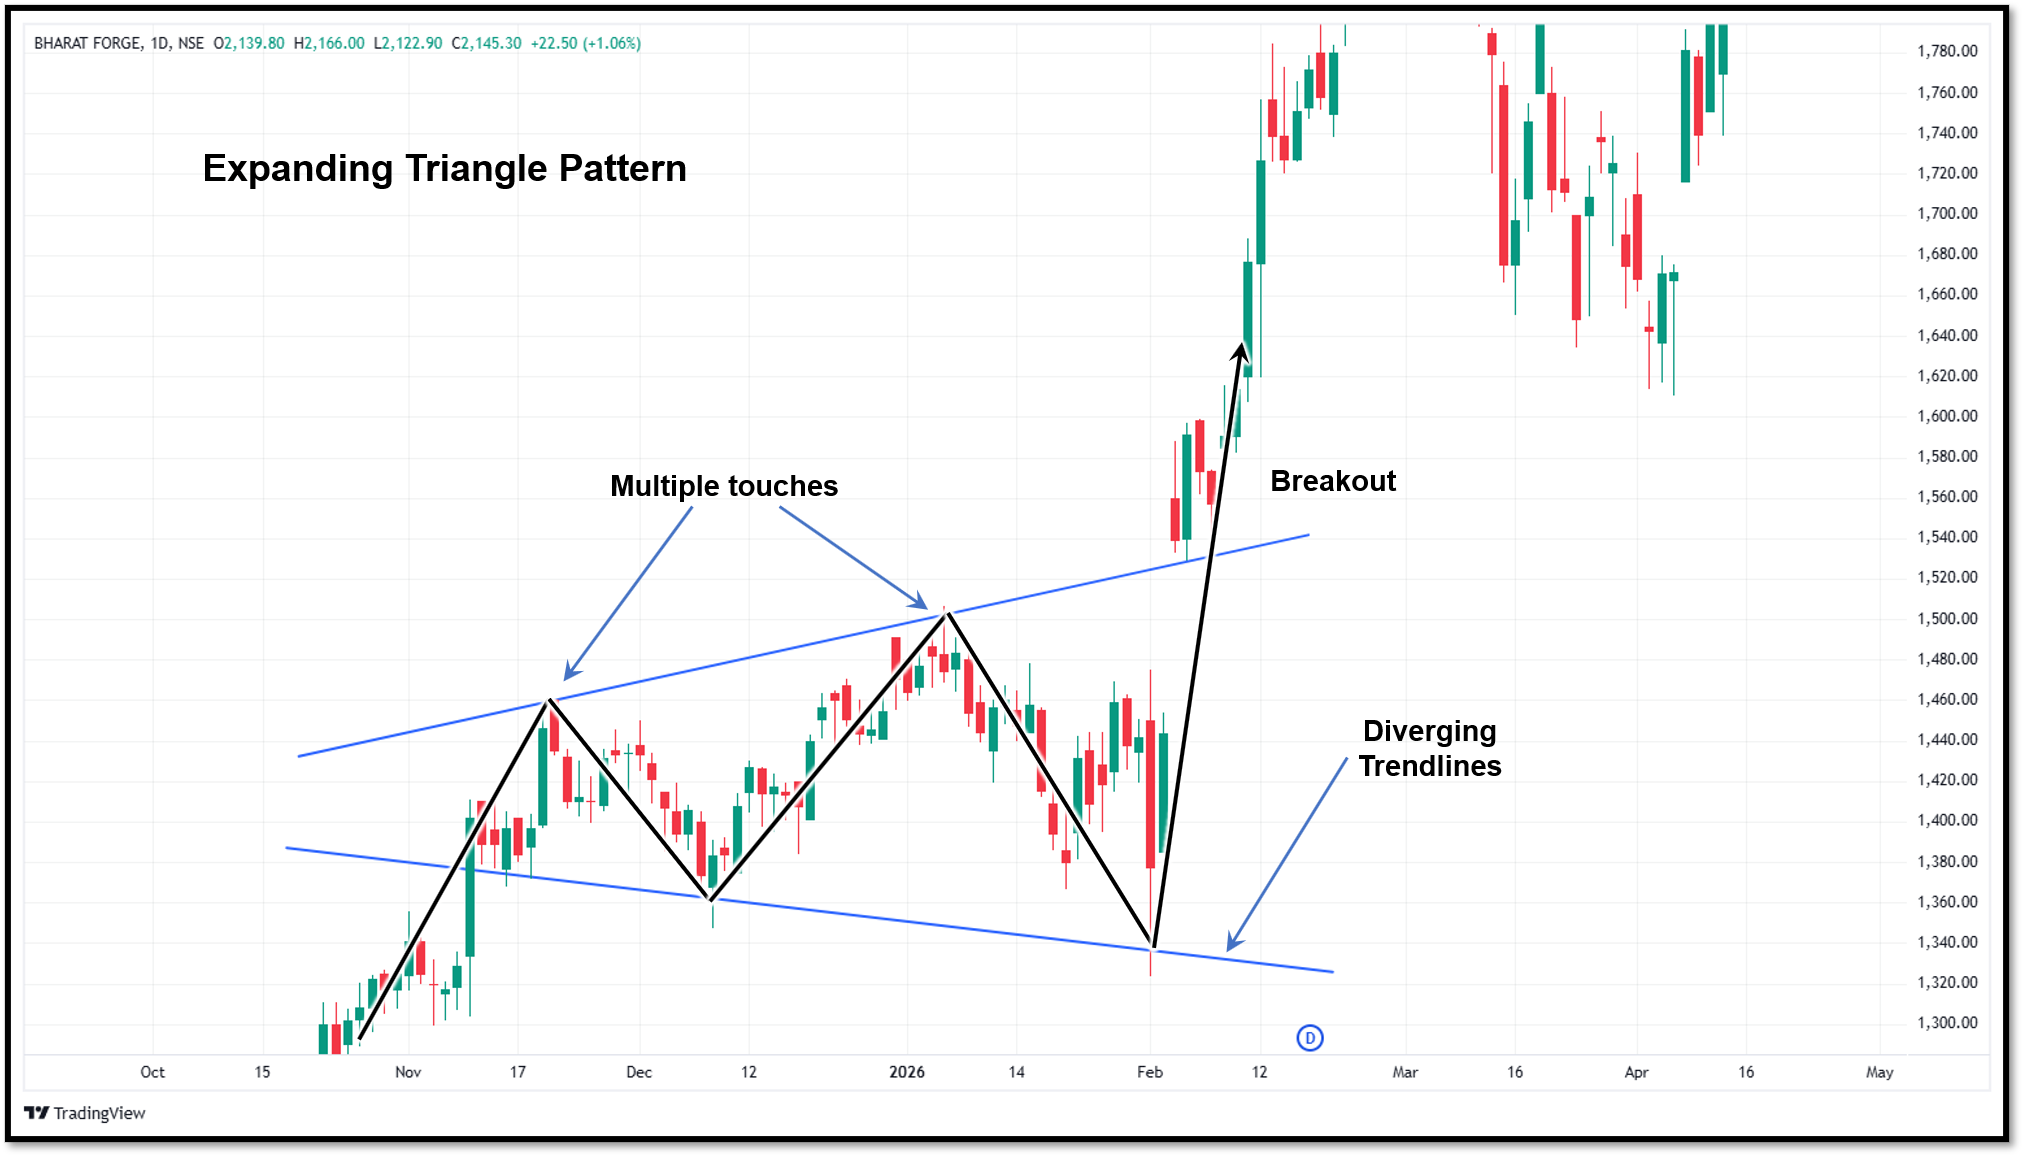
The defining characteristic is the widening distance between the upper and lower trendlines. The pattern expands rather than contracts.
Higher highs
Each rally is above the last high. This indicates continued buying aggression with increased volatility.
Lower lows
Each rally is above the last high. This indicates continued buying aggression with increased volatility.
Increasing volatility
Price swings become progressively larger as the pattern develops. This separates the expanding triangle from most other triangle formations.
Multiple touchpoints
A valid pattern generally requires multiple touches on both trendlines. These touchpoints help establish the boundaries of the formation.
Types of expanding triangle patterns
The expanding triangle can appear in different forms.
Expanding triangle as a continuation pattern
In some cases, the pattern develops during an existing trend. After a period of increasing volatility, the price eventually breaks in the direction of the prevailing trend. This outcome suggests that the dominant trend has resumed.
Expanding triangle as a reversal pattern
The pattern can also appear near major turning points. If the breakout occurs opposite to the previous trend, it signals a trend reversal. The context surrounding the formation usually determines which interpretation is more appropriate.
Trading the expanding triangle pattern
The expanding triangle pattern is a volatile pattern; you should be more careful while trading this pattern.
Waiting for confirmation
Traders usually avoid entering positions while the pattern is still forming. Price swings inside the structure can be unpredictable and may trigger premature entries. Waiting for a confirmed breakout can help reduce uncertainty.
Breakout entries
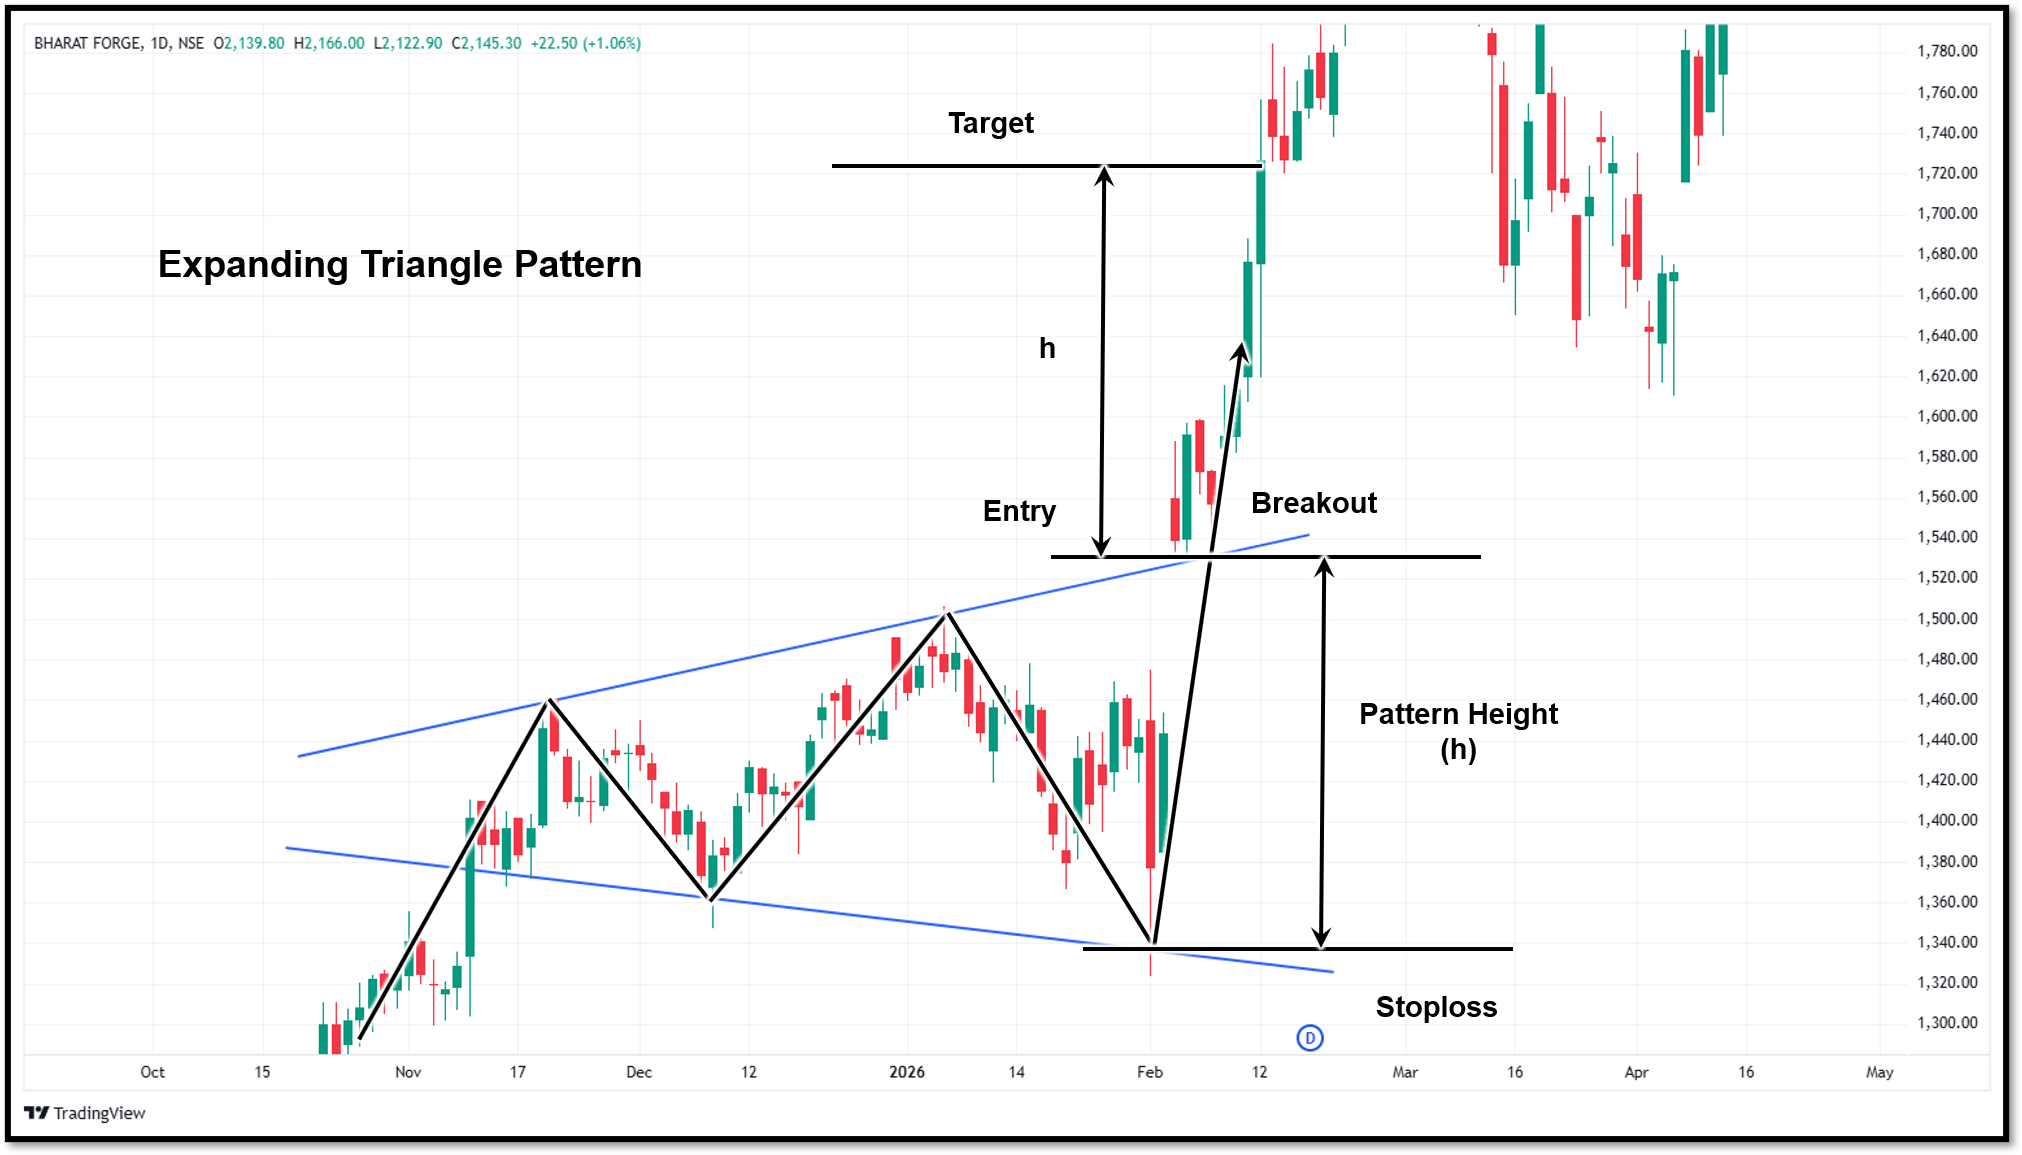
Many traders enter after the price closes beyond the upper or lower trendline. The breakout direction usually determines the trade bias.
Stop-loss placement
Stop-loss orders are commonly placed beyond the opposite side of the breakout area or near recent swing points.
Profit targets
Traders usually use the following methods for setting realistic profit targets.
- The height of the pattern
- Support and resistance zones
- Trend projections
- Risk-reward ratios
Volume behaviour in the expanding triangle
Volume can provide additional insight into the pattern's validity. During the formation of an expanding triangle pattern, volume may fluctuate significantly as buyers and sellers struggle for getting the control over the market. Many traders pay close attention to volume during the breakout phase.
An increase in volume during a breakout indicates stronger participation and greater conviction behind the move. Conversely, breakouts occurring on weak volume may be more vulnerable to failure.
Volume should not be viewed as a standalone signal, but it can provide useful confirmation when combined with price action.
Advantages of the expanding triangle pattern
The expanding triangle pattern offers various advantages as follows:
- The pattern signals increasing volatility in the market. This highlights the uncertainty and emotional participation.
- It generates many trading opportunities before the breakout, especially if the pattern forms during an intraday session.
- The pattern is flexible as it can function as either a continuation or reversal formation. This allows traders to apply it across different market environments and trend conditions.
- By analysing the structure of the expanding triangle, Traders can use this information to adjust position sizing, stop-loss placement, and risk management strategies.
Disadvantages of the expanding triangle pattern
The expanding triangle pattern has the following limitations:
- The pattern can be difficult to identify correctly, especially during its early stages.
- High volatility increases the likelihood of false breakouts. Price may temporarily move beyond a trendline before reversing sharply back into the pattern.
- Risk management can become challenging because the widening structure creates larger price swings.
- The pattern does not provide a directional bias until a breakout occurs.
Conclusion
The expanding triangle pattern is a unique chart formation that reflects growing volatility, increasing disagreement between buyers and sellers, and heightened market uncertainty. Its widening structure distinguishes it from traditional triangle patterns and provides valuable insight into evolving market conditions.
When the pattern is combined with volume analysis, trend evaluation, and sound risk management, it can help traders better understand market behaviour and identify potential trading opportunities during periods of elevated volatility.
FAQs
Is the expanding triangle pattern bullish or bearish?
The expanding triangle pattern is usually considered a neutral pattern. It can break out in either direction. The direction of the breakout determines the outcome of the pattern.
How many touchpoints are required for a valid expanding triangle?
A minimum of two touchpoints on both sides are considered a validation factor for an expanding triangle.
Does the pattern work on intraday charts?
Yes. Expanding triangles can appear on intraday, daily, weekly, and monthly timeframes, although higher timeframes are often considered more reliable.
How is an expanding triangle different from a symmetrical triangle?
A symmetrical triangle contracts over time as volatility decreases, while an expanding triangle widens as volatility increases.
What indicators work well with an expanding triangle pattern?
Technical indicators such as RSI, MACD, volume indicators, and moving averages are commonly used alongside the pattern.







