



How to spot Bearish Candle Patterns?








In technical analysis, candlestick patterns are considered one of the most important tools that provide early signals. There are various types of candlestick patterns, but bearish candle patterns are particularly important because they indicate potential weakness in price and the possibility of a downward move.
Early bearish candle patterns can help traders protect profits, avoid entering long positions at the wrong time, or even identify opportunities to take short positions. However, simply memorising a list of patterns is not enough. Successful traders focus on how to spot these patterns within the correct market context.
When a bearish candlestick appears at the right place at the right time, only then does it become meaningful. When traders learn how to identify these patterns correctly and combine them with other technical signals, they can gain valuable insight into potential market reversals.
Understanding what makes a candlestick bearish
It is important to understand what makes a candlestick bearish before we start identifying specific patterns. A bearish candle represents the seller’s domination during the trading session and pushes the price lower by the close. Some key characteristics of bearish candlestick patterns are outlined below.
Large red body
A long red candle body shows strong selling pressure. It means that the price opened higher and sellers pushed it significantly lower before the session ended.
Long upper shadow
A long upper wick indicates that buyers initially pushed the price higher but were eventually overpowered by sellers.
Closing near the low
If the candle closes near its low, then it indicates that selling pressure exists.
Gap down openings
In some cases, the market may open lower than the previous close, suggesting immediate bearish sentiment.
Step-by-step process to spot bearish candle patterns
Follow the structured process to spot bearish candle patterns given below:
Identify the existing trend
Bearish reversal patterns are most effective when they appear after a strong uptrend. When a bearish pattern appears during such a trend, it may signal that buying momentum is weakening. Traders can identify trends using several tools such as trendlines, moving averages, and price structure (higher highs and higher lows).
If a bearish candle appears during a downtrend, it is usually less significant because the market is already moving lower.
Look for resistance zones
Bearish candlestick patterns are more reliable when they appear near resistance levels. Resistance areas, like previous swing highs, supply zones where sellers previously entered, psychological levels (such as round numbers), and Fibonacci retracement levels.
When the price reaches resistance, many traders book profits or open short positions. If a bearish candlestick pattern forms at these levels, it increases the likelihood of a reversal.
Observe candle structure
As the price approaches a key level, it forms price structures suggesting sellers are gaining control.
- Long Upper Wicks - A long upper shadow indicates price rejection. Buyers tried to push the price higher, but sellers quickly forced it back down.
- Large Bearish Bodies - A strong bearish candle with a large body indicates aggressive selling activity.
- Engulfing Structures - Sometimes a large bearish candle completely engulfs the previous bullish candle. This indicates a sudden shift from buying pressure to selling pressure.
- Multi-Candle Formations - Some bearish patterns consist of multiple candles that together signal weakening bullish momentum.
Most common bearish candle patterns
Several bearish candlestick patterns frequently appear in the market. Recognising them quickly can help traders anticipate possible price declines.
Bearish Engulfing Pattern
The bearish engulfing pattern consists of two candles.
- The first candle is bullish.
- The second candle is a large bearish candle that completely engulfs the previous candle's body.
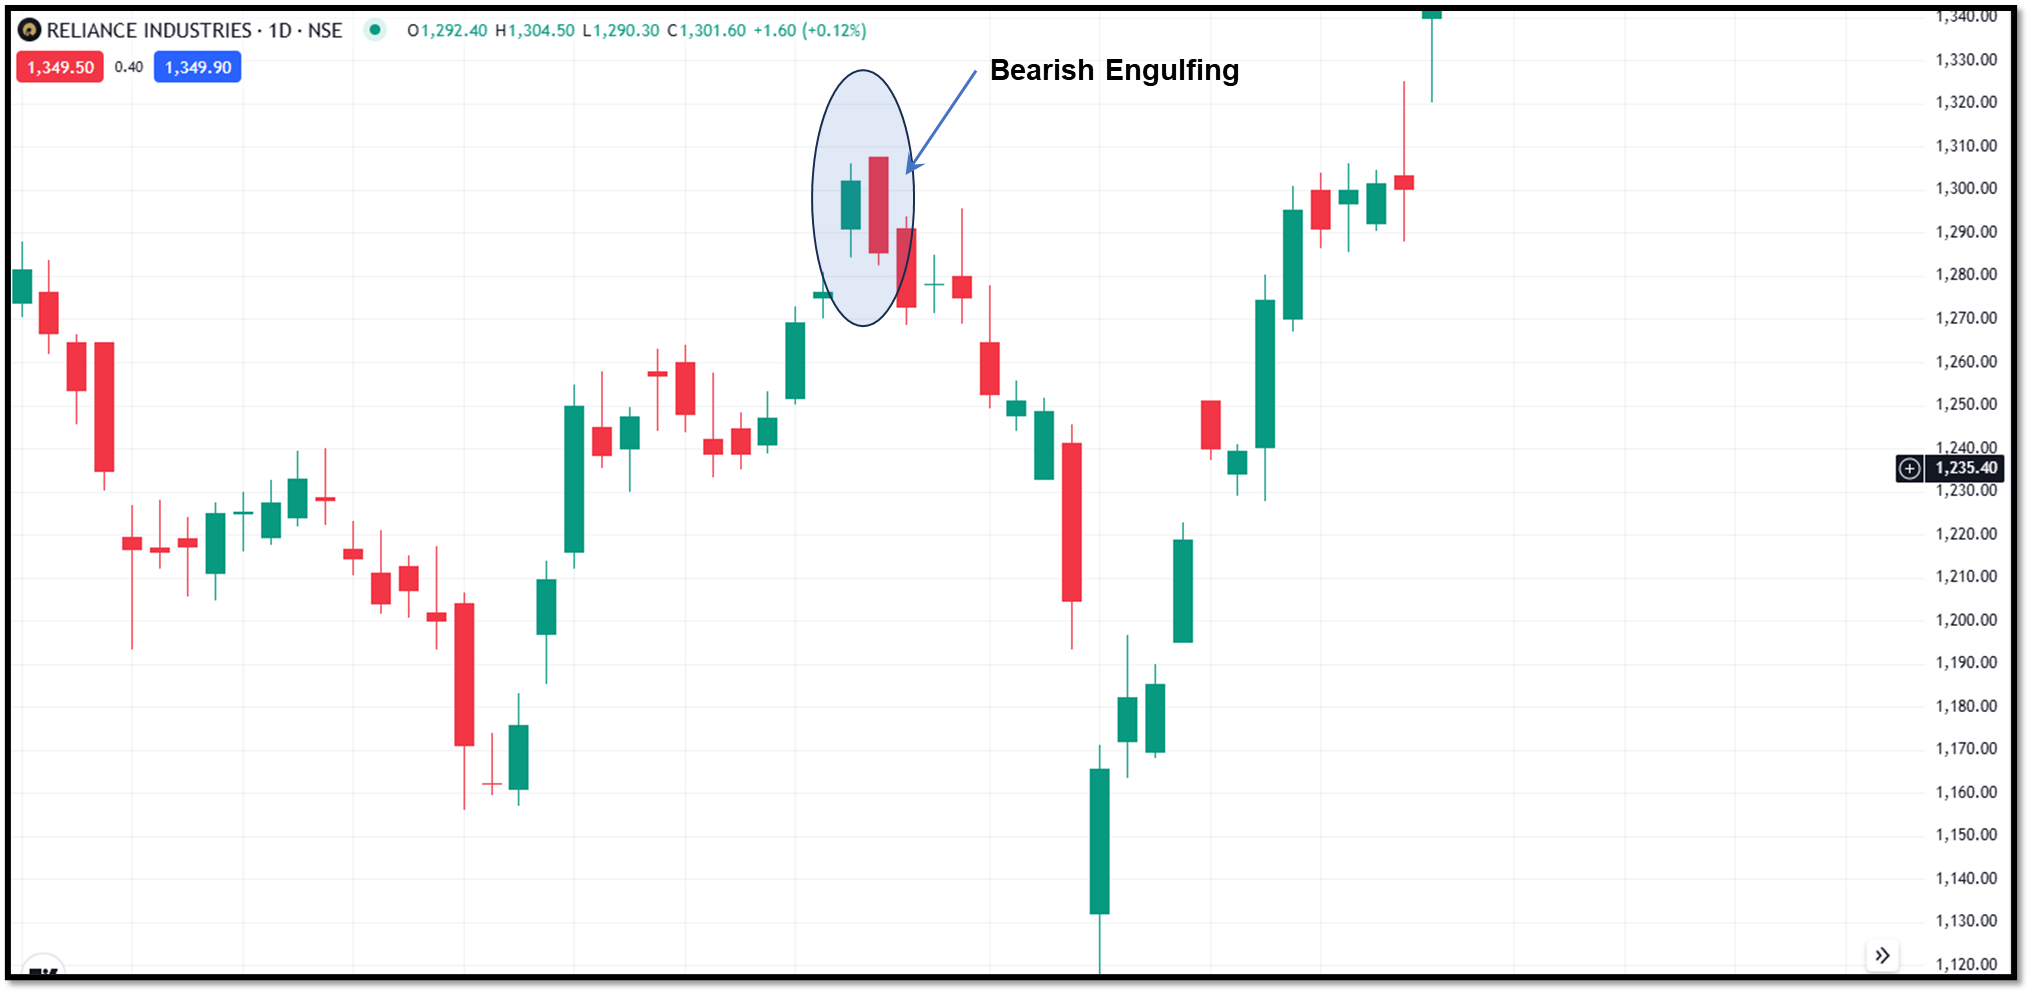
This pattern indicates that sellers have suddenly overwhelmed buyers and taken control of the market.
Shooting Star
The shooting star is a single-candle pattern that appears after an uptrend.
Characteristics include:
- A long upper shadow
- A small body near the bottom of the candle
- Little or no lower shadow
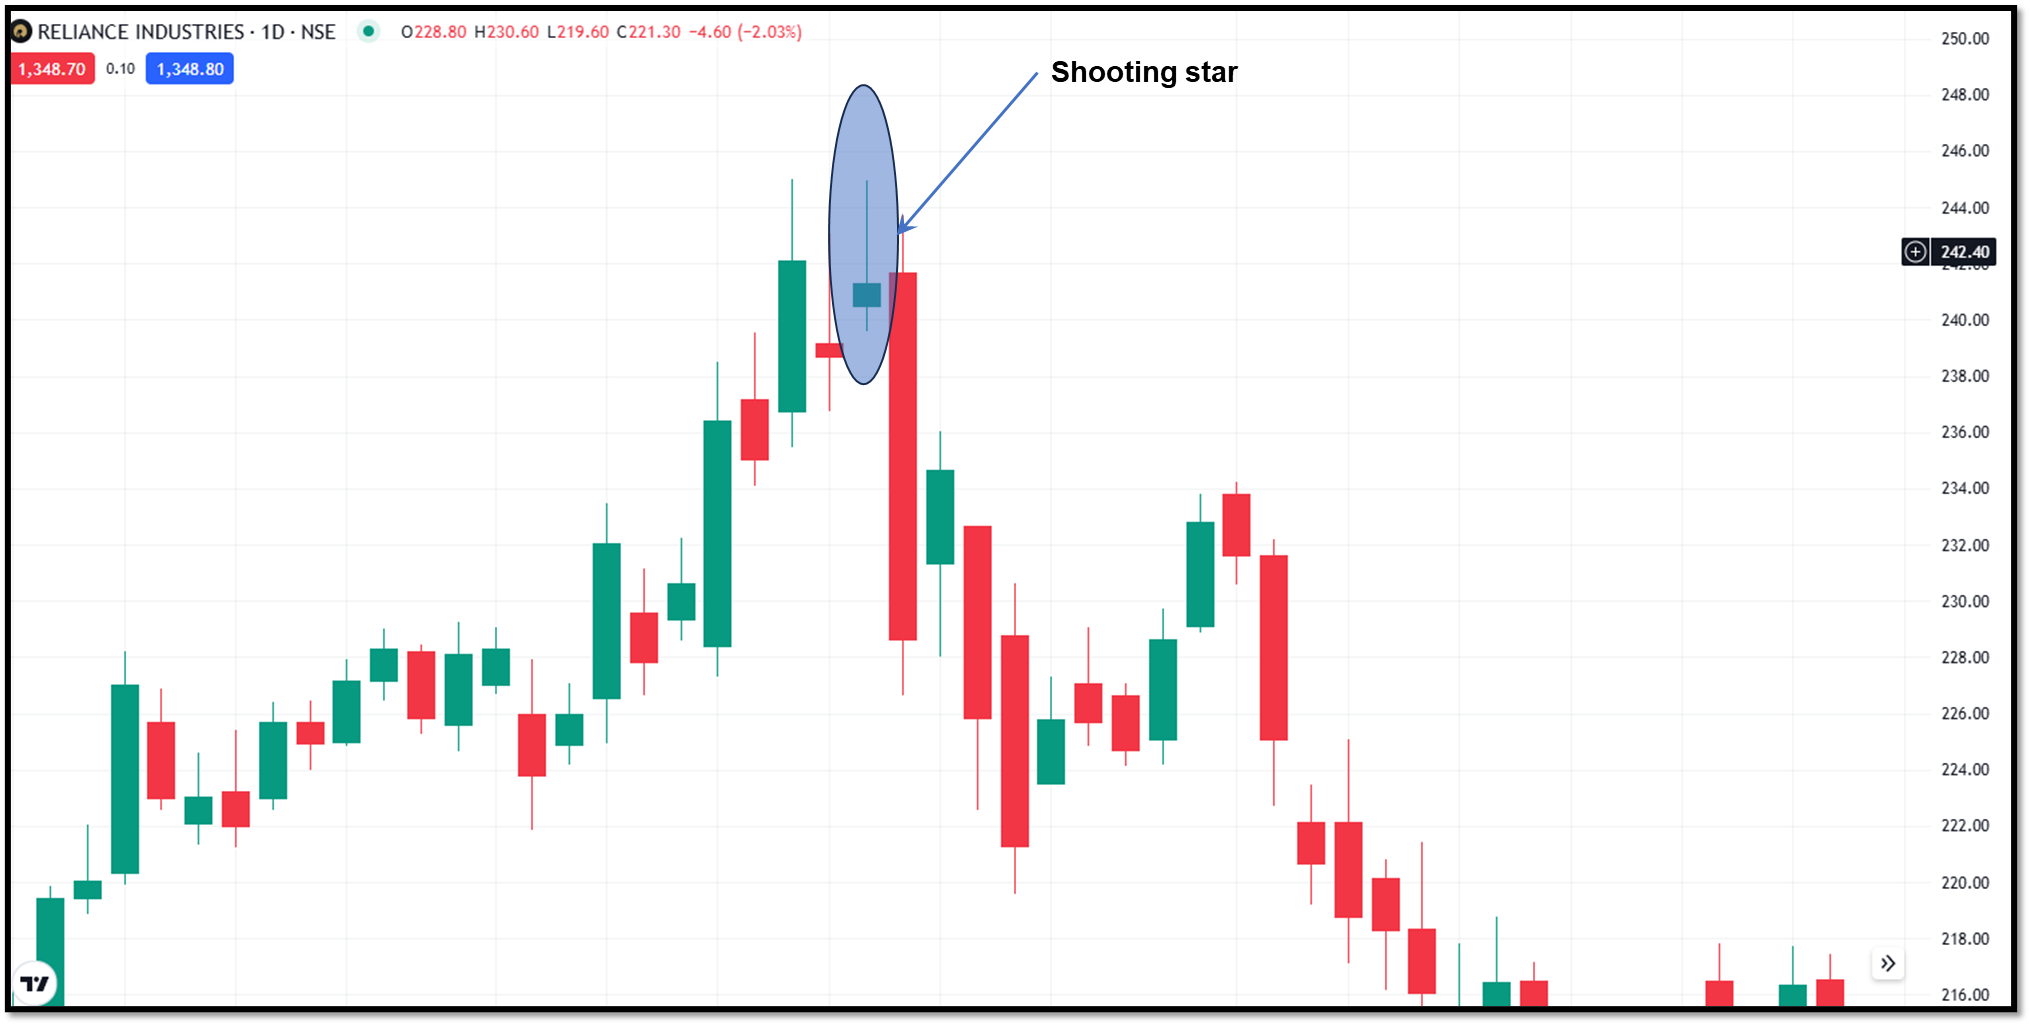
This formation shows that buyers pushed prices higher during the session, but sellers rejected them and drove the market back down.
Evening Star
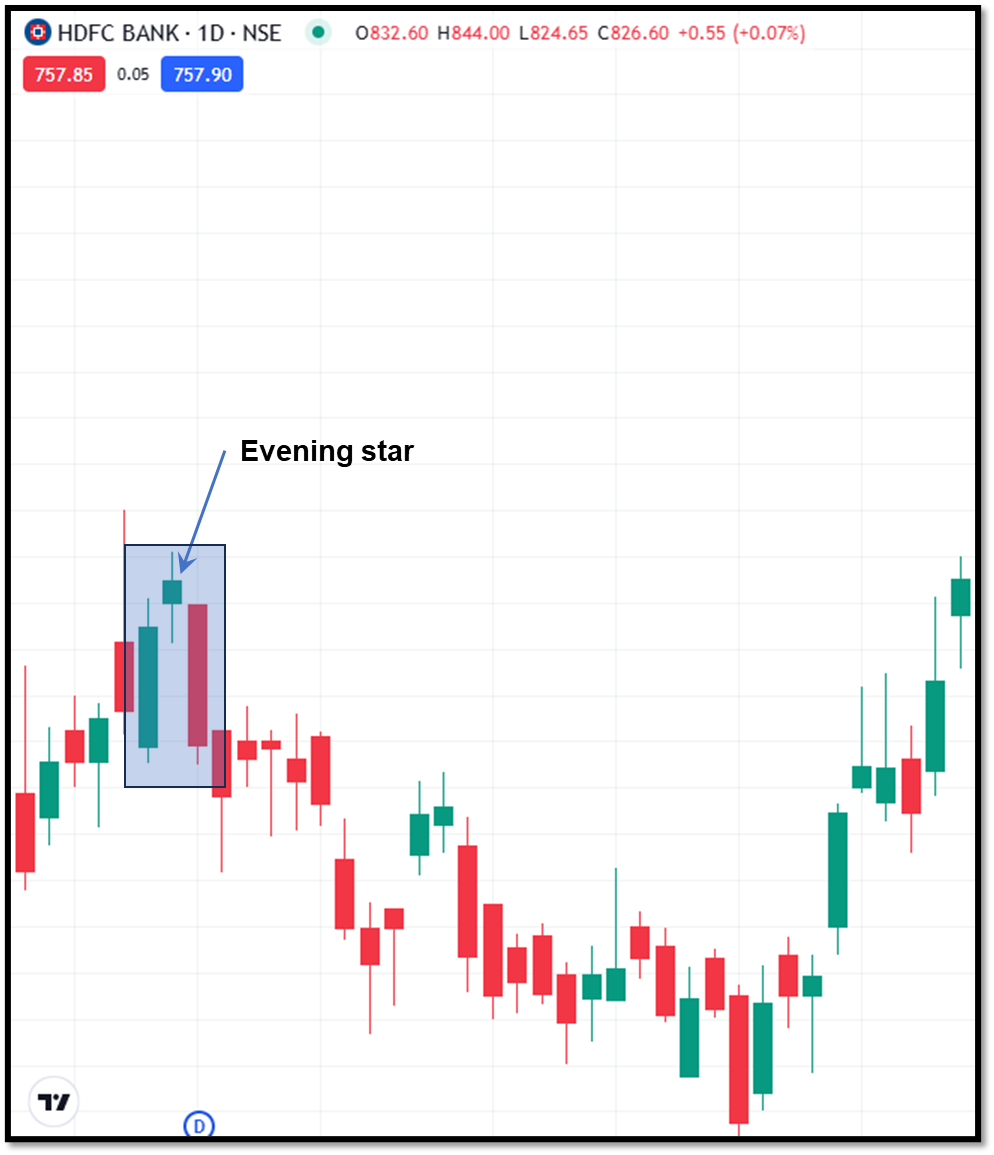
The evening star is a three-candle reversal pattern. This pattern reflects a gradual loss of bullish momentum followed by the emergence of bearish control.
The structure includes:
- A strong bullish candle
- A small, indecisive candle
- A large bearish candle
How to quickly scan charts for bearish patterns
As a trader, you must identify bearish patterns early and quickly. A slight delay can cause a loss, or you may miss a potential opportunity. Professional traders use the following methods to quickly identify and confirm bearish patterns.
Multi-timeframe analysis
A common technique is to analyse multiple timeframes.
For instance, you can see patterns on the daily chart and signal confirmation on hourly charts or even shorter. Longer timeframes are usually more trustworthy.
Use technical scanners
Technical scanners that can automatically identify candlestick patterns are available on many trading platforms.
Without having to manually go over each chart, these scanners assist traders in finding possible setups across several stocks.
Monitor momentum indicators
Momentum indicators can help confirm bearish signals. Common indicators like the Relative Strength Index (RSI), Moving Average Convergence Divergence (MACD), and Stochastic oscillator can be used to confirm bearish signals.
For example, if a bearish candlestick pattern appears when the RSI is in overbought territory, the probability of a downward move may increase.
Common mistakes traders make while spotting bearish patterns
Here are some common mistakes.
- Many traders ignore the overall trend. Patterns that appear during strong uptrends may fail if broader momentum remains strong.
- Not every red candle signals a reversal. Markets usually experience temporary pullbacks during uptrends. Traders should focus on strong patterns appearing at key levels.
- Entering trades immediately after spotting a pattern can be risky.
- Traders usually don’t consider the volume. Bearish patterns with rising volume tend to be more reliable.
Risk management when trading bearish signals
Even the strongest candlestick patterns can fail. Proper risk management is essential. Below are some of the key risk management practices that you can follow:
- Placing stop-loss orders above the candle high
- Avoiding excessive leverage
- Maintaining a favourable risk-reward ratio
- Waiting for confirmation before entering trades
To wrap up
Learning how to spot bearish candle patterns is an essential skill for traders who rely on technical analysis. These patterns reveal shifts in market sentiment and can provide early warning signals of potential trend reversals.
Although candlestick patterns should not be used in isolation. Their reliability increases when combined with trend analysis, resistance levels, volume confirmation, and momentum indicators.
FAQs
What is the most reliable bearish candlestick pattern?
Patterns such as bearish engulfing and evening star are often considered strong reversal signals when they appear after an uptrend.
Can bearish candle patterns appear in any timeframe?
Yes, these patterns can appear on all timeframes, but signals on higher timeframes, like daily or weekly charts, are generally more reliable.
Does a price decline always follow a bearish candlestick pattern?
No, bearish candlestick patterns signal potential weakness. It requires confirmation from other indicators before traders act on them.
To create bearish patterns, how many candles are needed?
Some patterns consist of a single candle, while others require two or three candles.
Should beginners trade by using only candlestick patterns?
No. Beginners should combine candlestick analysis with trend analysis, support and resistance levels, and volume indicators for better accuracy.







