



What is MACD?








MACD is one of the most popular indicators used for momentum analysis. MACD stands for Moving Average Convergence Divergence. It was introduced by Gerald Appel in the late 1970s. MACD is used as a technical analysis tool to identify the trend direction and strength. MACD gives clear indications in different market conditions. Traders use the MACD almost everywhere, like stocks, indices, forex, and crypto. In this blog, we will cover the MACD indicator in detail.
Concept of the MACD indicator
MACD looks at the relationship between two moving averages of price and uses that relationship to gauge momentum. MACD uses one fast-moving EMA and one slow-moving EMA, usually 12 EMA and 26 EMA, and by deducting two moving averages, the oscillator line (MACD line) is calculated. A 9 EMA line is plotted for comparison, referred to as the signal line.
When two moving averages move close to each other, they are said to be converging. Similarly, when two moving averages move away from each other, they are said to be diverging. A histogram is plotted, which represents the distance between the signal line and the MACD line.
Components of the MACD Indicator
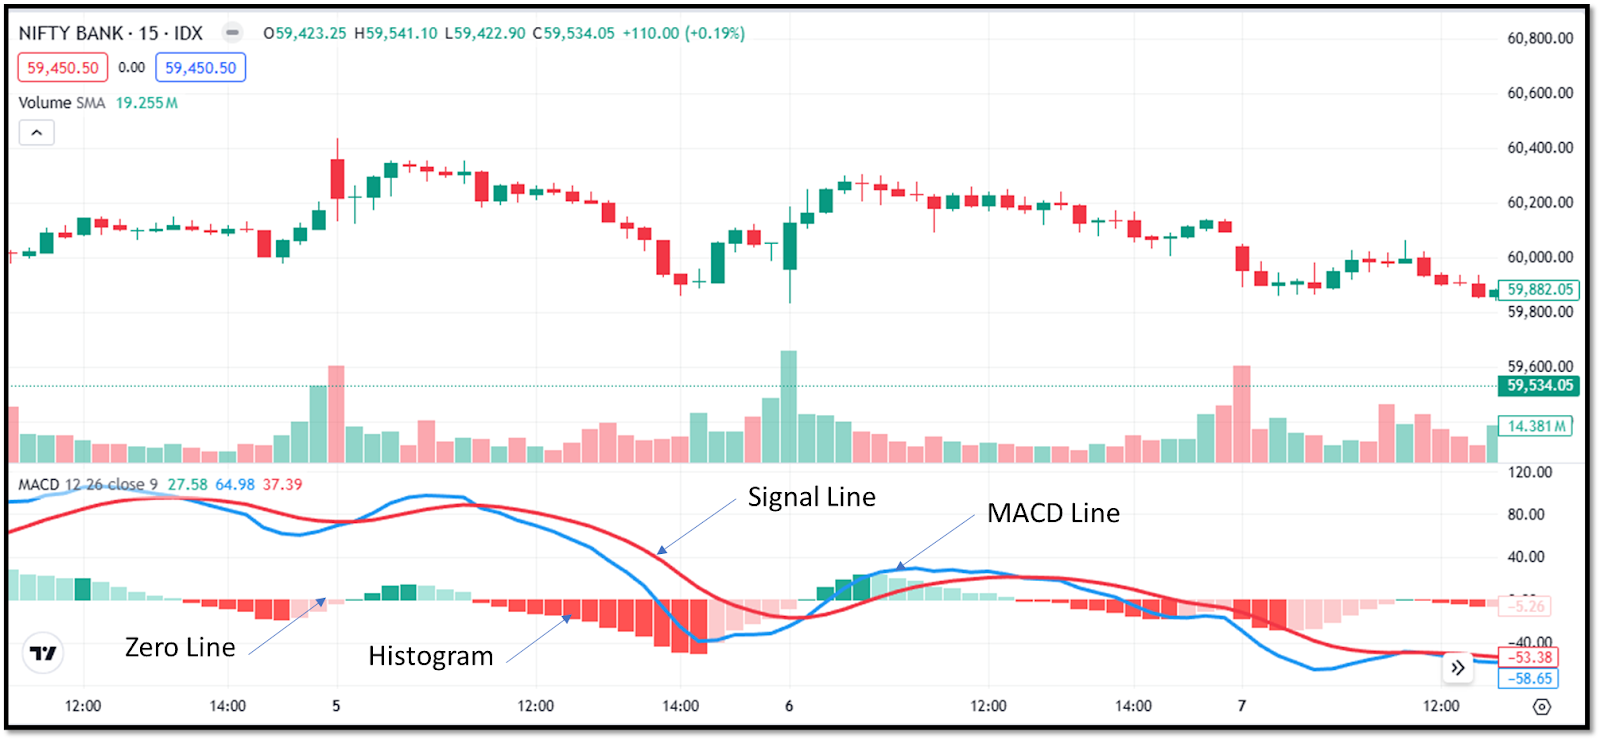
The MACD indicator has four primary components: the MACD line, signal line, zero line, and a histogram. We will discuss these components in detail. The figure below gives the graphical representation of lines.
MACD Line
The MACD line is plotted by calculating the difference between a fast-moving EMA and a slow-moving EMA. The 12 EMA and 26 EMA lines are usually used, but the user can change them as per their requirement. When this line moves upward, momentum is building upward. When it is falling, downward momentum is increasing.
Signal Line
The signal line is usually a 9-period EMA line. Its purpose is to smooth out short-term fluctuations and make momentum shifts easier to spot. Crossovers between the MACD line and the signal line form some of the most commonly traded MACD signals.
Zero line
As shown in the figure, a baseline that separates green and red histogram bars is called as zero line. The 12-period EMA and 26-period EMA are equal on the zero line. That means the MACD line value, i.e. difference between the 12-period EMA and the 26-period EMA, becomes zero. From this line, momentum changes from bearish to bullish (or vice versa).
Histogram
The distance between the signal line and the MACD line is plotted on the histogram. Increasing length of bars represents that momentum is building. While shrinking the length represents that the momentum is fading. Bars in green are for upward momentum, and bars in red are for downward momentum.
How does MACD Work in Practice?
MACD reacts to a change in price momentum. As the moving averages are involved, it lags in reacting to price changes. This helps in filtering out the noise. A strong trading line tends to stay on one side of the zero line and produces fewer but clearer signals.
On the other hand, in a sideways market, MACD flips multiple times, generating false signals. This is why market context should be counted for MACD.
MACD trading signals
There are three primary types of signals traders watch when using MACD.
MACD and Signal Line Crossovers
When the MACD line crosses above the signal line, a bullish momentum starts to build. When the MACD line crosses below the signal line, a bearish momentum starts to build. These two points are considered as entry and exit points. But taking every crossover blindly will lead to frustration. Combining these signals with broader trends will give better results.
Zero Line Crossover
When the MACD line crosses the zero line from below and goes into positive territory, a bullish trend starts to build. If the MACD line crosses the zero line from above, a bearish trend starts to build. When the MACD line moves farther away from the zero line, it usually signals stronger momentum in that direction.
MACD Histogram Signals
As stated above, a histogram represents the distance between the signal line and the MACD line. The expanding bars are a signal of momentum building in that trend direction. Shrinking bars may represent that the trend is losing strength, even though the price is increasing.
Advantages and Limitations of MACD
The advantages of the MACD indicator are listed below:
- MACD combines trend direction and momentum into a single indicator, which keeps charts cleaner.
- The MACD indicator is widely followed, due to which MACD signals often become self-reinforcing during strong trends.
- The MACD signals are very easy to read and can be applied across different markets and timeframes.
Even though the MACD indicator is popular, it has some limitations of its own. Some of the key limitations are given below:
- The MACD generates false signals during a sideways market.
- The MACD lags in price action, as it is based on the moving averages; a sharp move may not be captured early. Also, it will never catch exact tops or bottoms.
- Relying on MACD alone without considering price structure, support and resistance, or volume leads to poor results.
Wrapping up
The MACD is a very powerful tool and widely used across different markets. It captures the price behaviour and momentum build, fades, and shifts over time. If traders use it wisely and with other confirmation tools, it will give clarity in trading decisions.
MACD must be used by understanding the broader market context. Using it alone may lead to losses. Traders have to be cautious of the market while using the MACD indicator.
FAQs on MACD
What is the MACD indicator used for?
MACD is mainly used to analyse momentum and trend direction. It helps traders to understand changes in buying or selling pressure. Also, it gives signals of possible entry and exit points.
What does the zero line mean in the MACD indicator?
The zero line represents the point where the short-term exponential moving average and the long-term exponential moving average are equal.
Which markets can the MACD be used in?
MACD can be used across most liquid markets like stocks, indices, forex, commodities, and cryptocurrencies. It behaves almost similarly in every market.
Are MACD crossovers reliable trading signals?
MACD crossovers can be useful, but a confirmation from other indicators will improve their effectiveness. Additionally, MACD performs better when it is supported by the price structure and in line with the overall trend.
Can MACD be used alone for trading?
It can be dangerous to use MACD alone. It functions best when paired with other tools like volume, trendlines, support and resistance, or higher-timeframe analysis.







