Leading, Lagging, and Coincident Indicators




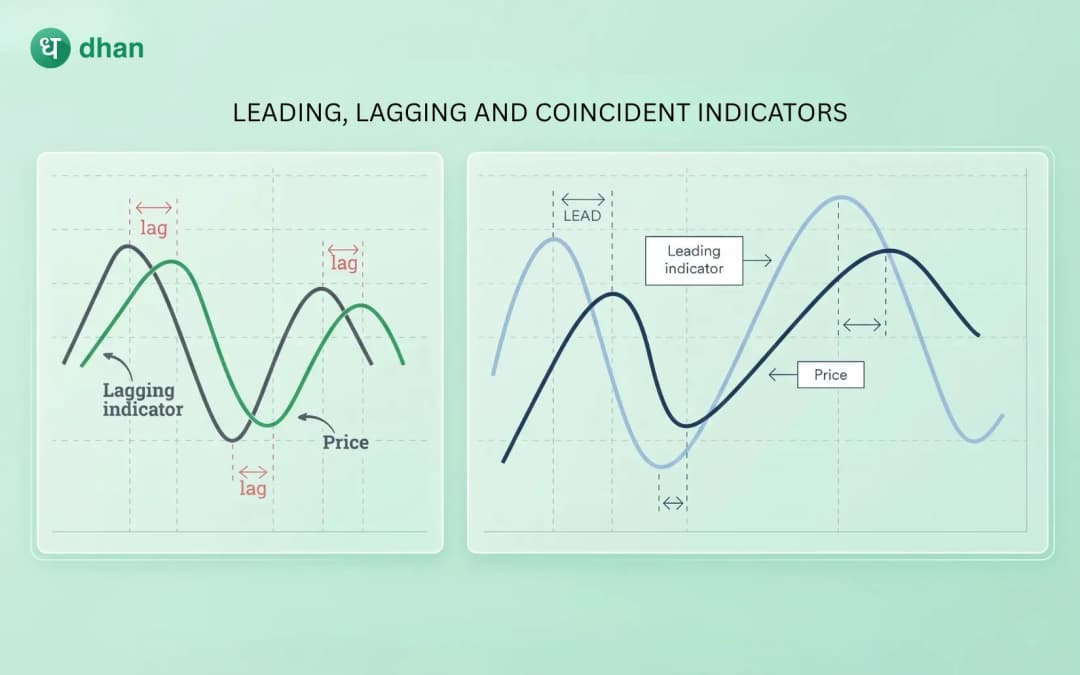




Every trader tries to predict the market. They want clarity about the current market status and what it might do in the near future. For that reason, traders rely on indicators and patterns. Patterns form as the price moves up and down. But the indicators behave differently depending on their type.
Depending upon their nature, indicators are classified into three categories: leading, lagging, and coincident indicators. If you misunderstood these categories, then there is a possibility of:
- Enter too early and get trapped
- Enter too late and miss the move
- or misread the market completely
In this article, we will break down these categories in a simple and practical way so you can actually use them instead of just memorising definitions.
What are indicators?
Indicators are tools that help you understand market behaviour. They are based on data like price, volume, time, and economic activity.
Some indicators are used in technical analysis (like RSI or moving averages), while others are used in economic analysis (like GDP or unemployment).
But regardless of the type, all indicators fall into three broad categories:
- Leading
- Lagging
- Coincident
We will understand these categories in detail in the upcoming sessions.
Leading indicators
Leading indicators try to predict future prices or economic movements. They give signals before the actual trend or event happens.
In trading, these are used to identify:
- Potential reversals
- Early trend entries
Leading indicators move ahead of price, and show overbought conditions, oversold conditions, and divergence.
For example, if the price is falling but momentum indicators start rising, it may hint that the fall is losing strength.
Examples of leading indicators
Some common leading indicators in trading include:
- Relative Strength Index (RSI)
- Stochastic Oscillator
- Williams %R
- Momentum indicators
In economics, leading indicators include things like stock market performance, new business orders, and consumer sentiment.
Advantages of leading indicators
The biggest advantage of a leading indicator is that it gives early signals. This allows traders to enter the trade before big moves begin or in their early stages. You can identify the reversals early and capture better risk-reward.
Limitations of leading indicators
While the leading indicators provide early signals, they are not always accurate. Because they predict future movement, they usually give false signals, trigger too early, and mislead in strong trends. For example, a market can stay overbought for a long time during a strong uptrend.
Lagging indicators
Lagging indicators follow price action. They confirm trends after they have already started. They don’t try to predict they validate.
Lagging indicators react slowly because they are based on past data. They help answer questions like, " Is the trend real? " and “Should I stay in the trade?”
Examples of lagging indicators
Some common lagging indicators in trading are as follows:
- Moving Averages
- MACD (Moving Average Convergence Divergence)
- Bollinger Bands (in trend context)
In economics:
- Unemployment rate
- Corporate profits
Advantages of lagging indicators
The lagging indicators are useful because they reduce false signals, confirm trends, and help traders stay in profitable trades. They are more reliable than leading indicators in strong trending markets.
Limitations of lagging indicators
The lagging indicators are late. They show past data. Due to which entries happen after the move starts, and part of the profit is already gone.
Coincident indicators
Coincident indicators move along with the market. They reflect what is happening in real time. They do not try to predict or confirm. Instead, they provide a clear picture of the current situation.
Coincident indicators act as a reality check. While leading indicators may suggest something and lagging indicators confirm later, coincident indicators help you see the current ongoing situation.
For example, a rising price with strong volume is more reliable than a rising price with weak volume.
Examples of coincident indicators
In trading, the examples of coincident indicators are as follows:
- Price
- Volume
- Intraday market breadth
In economics,
- GDP
- Industrial Production
- Employment level
Advantages of coincident indicators
The biggest strength of coincident indicators is clarity. They don’t speculate or delay. They simply reflect current conditions. This makes them highly useful when you want to confirm whether a move is real or weak. Also, they reduce overthinking and prediction bias. You can use coincident indicators for validating leading and lagging indicators.
Disadvantages of coincident indicators
Coincident indicators tell you what is happening, but they don’t tell you what will happen next. If you rely only on them, you may struggle with timing entries. On their own, coincident indicators are incomplete. They tell you the present but not the direction or sustainability of a move.
Understanding the relationship between all three
Look at them as parts of a sequence and not totally different concepts.
- Leading indicators highlight potential change
- Coincident indicators show current strength
- Lagging indicators confirm sustained movement
So they represent the future, present and past of the market.
How to use them together in a practical way
Relying on just one type of indicator creates an imbalance. Instead, you can combine them in a way that improves both timing and accuracy. A simple approach for using all three is:
- Start by identifying a potential opportunity using a leading indicator. This gives you a direction to watch.
- Observe coincident indicators like price behaviour and volume. This tells you whether the market is supporting that idea.
- Use a lagging indicator to confirm the trend before committing fully.
You can better understand the use of these by looking at a real-world example.
Imagine this,
The market has been falling for a while. Suddenly, RSI starts showing divergence. This suggests that selling pressure is weakening. At the same time, volume begins to increase as price stabilises. This indicates that buyers are becoming active.
Finally, price moves above a key moving average. This confirms that a potential trend reversal is underway.
Here, each indicator plays a role, but none of them works effectively on its own.
Common mistakes traders make
The following are the common mistakes that traders and beginners usually make:
- The most common mistake is over-reliance on leading indicators. Traders get excited by early signals and enter too soon, only to see the market continue in the same direction.
- Some traders depend entirely on lagging indicators. They wait for perfect confirmation but end up entering when most of the move is already done.
- Traders usually ignore the current market conditions. Without paying attention to coincident indicators like volume, traders can misinterpret weak moves as strong trends.
- Adding too many indicators creates confusion rather than clarity. Use the indicators as per the market conditions and data required.
When to use which type of indicator
There is no fixed rule, but the following general idea can help you decide:
- Use leading indicators in ranging markets
- Use lagging indicators in trending markets
- Use coincident indicators always as confirmation
The market environment should guide your choice.
Final thoughts
Understanding the leading, lagging and coincident indicators can help you decide when to use which type of indicator. It can guide you to make the right decisions at the right time. Leading indicators give you speed, but less accuracy; lagging indicators give you accuracy but less speed; coincident indicators give you clarity about the present. But relying on any single type of indicator can lead to missed entries or wrong interpretation.
Combining three of them can be key to effective trading. Use the combination of indicators as per the market conditions.
FAQs
What is the main difference between leading, lagging and coincident indicators?
Leading indicators try to signal what might happen next, coincident indicators show what is happening right now, and lagging indicators confirm what has already happened. Understanding this timing difference is more important than memorising definitions.
Which type of indicator is the most reliable?
No single type is the most reliable on its own. You should combine the indicators to increase their reliability.
Do professional traders rely on indicators?
Yes, but not blindly. Experienced traders use indicators as supporting tools, along with price action, market structure, and risk management.
Why do leading indicators give false signals?
Leading indicators are based on expectations, not confirmation. They try to predict the changes in momentum, but markets can continue in the same direction longer than expected. That’s why early signals usually fail without confirmation.
Can I trade using only one type of indicator?
You can, but it’s not advisable. Using only one type creates an imbalance in white trading. Using only the leading indicator can make your entries too early. Using only lagging can cause your entries to be too late. And you cannot decide with coincident indicators. Using a combination gives better results.