



Money Flow Index (MFI)








In today's dynamic markets, staying in sync with investor sentiment is essential for success in both trading and investing. While price movements on the chart immediately catch market participants' eyes, the conviction behind them can be confirmed by trading volume, which reflects broader market sentiment. This is where the Money Flow Index, a popular technical indicator, comes into play.
The Money Flow Index provides insight into the actual money flow in and out of a particular asset and is a powerful tool for market participants in the Indian stock market, as both individual and institutional participation significantly affects stock price movements. Here, we will take a detailed look at the money flow index.
What is the Money Flow Index (MFI)?
The Money Flow Index is a volume-weighted momentum oscillator and determines the strength of money flowing in and out of a security. While the Traditional indicators measure the price movement of an asset, the Money Flow Index calculates both the price and volume movement, thus offering a comprehensive view of market sentiment. As it also tracks volume along with prices, it can also be considered a volume-weighted Relative Strength Index (RSI).
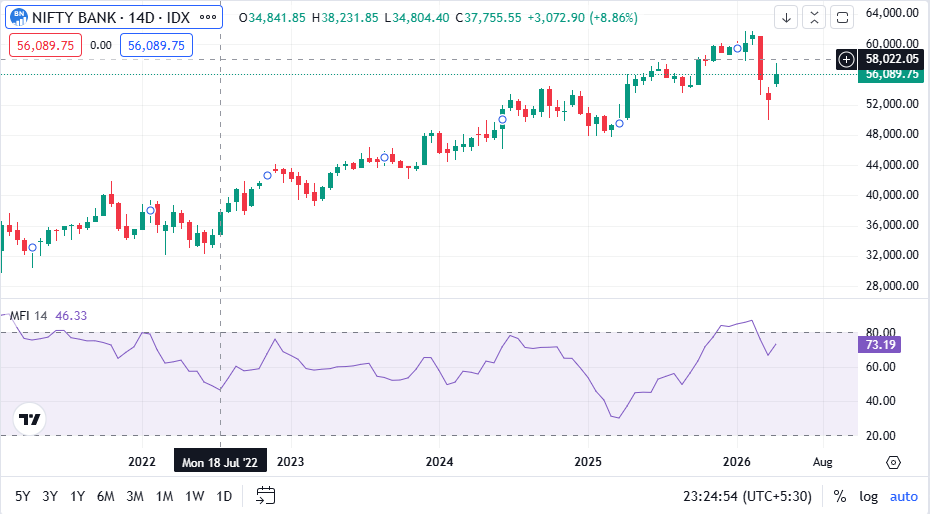
The Money Flow Index is usually calculated over a 14-day period and oscillates between 0 and 100, therefore helping the market participants gauge potential price reversals and extremes.
How is the MFI calculated?
The MFI uses price and volume over a period of time (typically 14 days) to measure buying or selling pressure in the market and gauge a comprehensive picture of market sentiment. The steps of the calculation of MFI are as follows:
1. Find the Typical Price: The typical price of a given period is calculated by taking the sum of the high, low, and close prices of an asset for that particular period and dividing it by 3.
Typical Price = (High + Low + Close)/3
2. Calculate the raw money flow: This calculation involves multiplying the typical price of the asset by the trading volume in that given period.
Raw Money Flow = Typical Price x Volume
3. Determine the direction of the money flow: The direction of the money flow is positive if the current day's typical price is higher than the previous day's typical price, whereas if the current day's typical price is lower than the previous day's typical price, then the direction of the money flow is negative. The time periods with the same typical prices are excluded from this calculation.
4. Summation of positive and negative Money Flows: Calculate the sum of positive and negative money flows in the given look-back period (e.g., 14 periods).
5. Calculate the Money Flow Ratio: The Money Flow Ratio is calculated by dividing the sum of the positive money flows by the sum of negative money flows in the given look-back period.
Money Flow Ratio = 14-Period Positive Money Flow/ 14-Period Negative Money Flow.
6. Compute the MFI: The Money Flow Index is finally computed by using a formula given below:
Money Flow Index = 100 - (100/(1+ Money Flow Ratio))
It gives values that range from 0 to 100. This analysis helps to acquire a clear picture of market dynamics and the correlation between price movements and volume. Though the standard period for MFI calculation is 14 days, market participants can adjust the indicator's sensitivity by using a shorter or longer period.
Interpreting MFI signals
Traders can interpret MFI signals to gauge market sentiment and trading opportunities. These signals can be decoded as:
Overbought and oversold levels
- Above 80: An MFI reading over 80 suggests that an asset is overbought, which means it has had a significant buying pressure and is likely to experience a price reversal. However, if there is a strong upward trend, the price can continue going up, regardless of MFI being above 80. An MFI reading over 90 indicates a truly overbought asset.
- Below 20: An MFI reading under 20 shows that the asset is oversold, implying high selling pressure and a potential price increase. As with overbought conditions, if there is a strong downward trend, the prices may continue to fall, even with an MFI reading below 20. Reading below 10 is regarded as truly oversold and may indicate panic selling.
Divergences
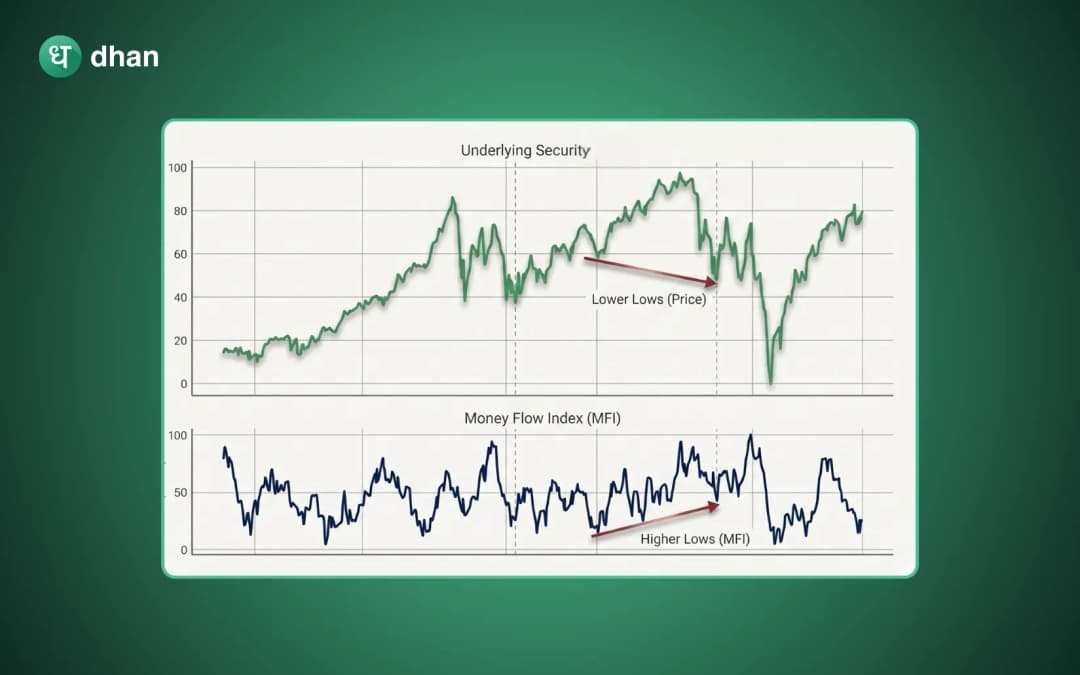
Divergence of MFI and price is viewed as a strong signal for potential price reversal, before it is visible on the price chart itself.
- Bearish Divergence: Occurs when the price reaches a new high, while the MFI reaches a lower high. It is an indication that the money inflow into the asset is weakening despite rising prices. The likelihood of a price reversal to the downside increases significantly in such situations.
- Bullish Divergence: Appears when the price reaches a new low, but MFI marks a higher low. It is an indication that sell-off pressure is fading out and money inflow is growing. Thus, there is a high probability of a bullish reversal.
Failure swings
The use of failure swings together with overbought and oversold conditions can enhance the MFI indicator's reliability even further.
- A bullish failure swing takes place when MFI falls below 20 (oversold), rebounds but stays above 20(a higher low), and then surpasses its recent high. This signals buy momentum.
- A bearish failure swing takes place when MFI moves above 80 (overbought), retreats but not below 80(a lower high), and then falls below its recent low. It signals sell momentum.
Confirming trend strength
Another practical application of MFI is to confirm the strength of an existing trend. If the MFI is moving in the same direction as the price, it signifies a strong trend confirmation.
For example, if the price is rising and MFI is also rising, it demonstrates strong, genuine buying momentum, hence a strong uptrend. In contrast, if the price is falling and MFI is also falling, it confirms strong selling pressure in a downtrend.
Advantages and limitations of MFI
Every technical indicator has its advantages and limitations; MFI is no exception. The advantages are as follows:
Advantages:
- Price-volume integration: The ability of MFI to incorporate both price and volume into calculations allows market players to have a better understanding of market dynamics and differentiate between the genuine market movements and the temporary ones. It is especially useful in the markets where volume is a major price determinant.
- Early reversal prediction: Being based on volume, MFI can anticipate potential asset price reversals earlier than only price-based indicators.
- Flexible: The MFI is a versatile indicator and can be used across different timeframes; hence, it can be used in day-trading, swing trading, and positional trading.
- Verifies price momentum: The MFI verifies the strength of a trend by evaluating the volume and direction of cash flow into or out of an asset and assigns greater significance to price changes that occur with large volumes.
Limitations:
- False signals: The MFI indicator may give a false signal during periods of a strong trend when overbought/oversold conditions may persist longer than anticipated. This could result in premature closing of trades with the potential to deliver higher returns.
- Volume dependence: Unusually high volume due to special events like block deals or corporate announcements might distort MFI signal values, leading to false signals.
- Sideways market issues: In sideways markets, MFI can produce whipsaws or conflicting signals, leading to unclear signals and less reliability in the sideways market.
- Limitations of Low Volume: For stocks that trade infrequently and are not included in important indices such as Nifty or Sensex, there can be problems with the accuracy of MFI because the volume data is limited.
- MFI requires confirmation: The MFI signals should be used in conjunction with other indicators to confirm MFI signals, as it can often give false signals in a sideways market.
Conclusion
Money Flow Index is a powerful indicator for analysing market momentum with the help of integrating the two most important components: price movement and trading volume. With the help of MFI, market participants can identify overbought/oversold conditions, divergence between price and volume, and strength of price movements, helping them make more informed decisions.
However, it is important to understand the MFI complexities and use it in combination with other indicators to significantly improve the reliability of the signals.
FAQs
1. What is Money Flow Index (MFI), and how does it differ from RSI?
The Money Flow Index (MFI) is a momentum oscillator that seeks to gauge the flow of money in or out of an asset by monitoring the price movements and trading volumes. The indicator differs from the relative strength index as RSI tracks only the price momentum. As the Money Flow Index takes volume into account as well, it is often called volume-weighted RSI.
2. What do MFI readings of 80 and 20 signify?
An MFI reading above 80 indicates that a security is overbought. This implies that the asset's buying momentum has been strong, and there might be a potential price correction downwards. Conversely, an MFI reading below 20 suggests that a security is oversold. This implies strong selling momentum, and a price rally is likely on the way. However, in strong trends, prices can continue in their direction even with MFI in these extreme zones.
3. Can MFI be used as a stand-alone technical indicator?
Money Flow Index cannot and should not be used as a stand-alone technical indicator. It often gives false signals during extremely strong trending periods or during sideways markets. To achieve increased accuracy and reliability, market participants should use the Money Flow Index in conjunction with other indicators, which can be chart patterns, trendlines, moving averages, and other oscillators, such as RSI or MACD.
4. Is the Money Flow Index a leading or a lagging indicator?
MFI is regarded as a leading indicator that indicates future price movements, enabling market participants to enter positions ahead of time and thus capitalising on price swings. However, like all other leading indicators, MFI cannot give 100% accurate signals; it must be used in combination with other indicators and robust risk management strategies.
5. What is the ideal setting for the Money Flow Index?
The most commonly accepted period for the Money Flow Index is a 14-day period, as this allows a balanced view, smoothing out daily fluctuations without ignoring shorter-term market shifts, making it suitable for Indian stock trading.







