Rounding Top Pattern




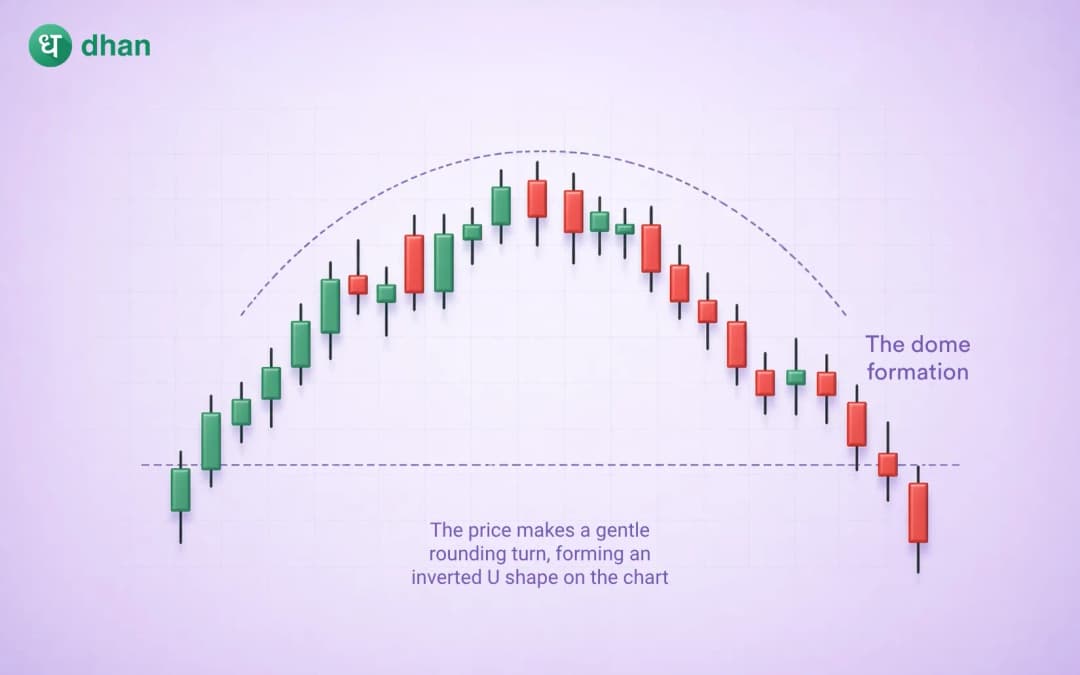




Key takeaways
- The rounding top pattern is a bearish reversal chart pattern that typically forms after an uptrend.
- It develops gradually and reflects a slow shift in control from buyers to sellers.
- The pattern resembles a dome or an inverted bowl shape on a price chart.
- Unlike sharp reversal patterns, a rounding top often takes weeks or months to form.
Most traders are familiar with sharp reversal patterns that signal a possible change in trend within a relatively short period. Patterns such as the Double Top or Head and Shoulders attract attention because they provide visible warning signs that market sentiment may be changing.
However, not all reversals happen suddenly. Many times, trends begin losing momentum gradually. Buying pressure slowly weakens, and sellers become increasingly active over time. It creates a different type of reversal pattern known as the rounding top.
The rounding top pattern is one of the more subtle bearish reversal formations in technical analysis. It reflects a slow transition from bullish to bearish control. This gradual nature makes this pattern particularly interesting because it is developing in front of a large decline.
For traders and investors, understanding how a rounding top forms can provide valuable insight into changing market sentiment. Recognising the pattern early may help identify weakening trends, protect profits, and avoid holding positions during the early stages of a potential downtrend.
What is a Rounding Top Pattern?
A rounding top is a bearish reversal chart pattern that develops after an extended bullish move.
The pattern forms when prices gradually slow their upward movement, begin moving sideways, and then slowly transition into a downward trend. The resulting price structure resembles a dome or upside-down bowl.
Unlike many reversal patterns that rely on specific peaks, troughs, or candlestick formations, the rounding top is characterised by its smooth and curved appearance.
The pattern reflects a gradual change in market sentiment. In the starting, buyers remain in control and continue pushing prices higher. Over time, however, buying enthusiasm starts fading. As demand weakens and selling pressure increases, the market gradually loses momentum and eventually begins moving lower.
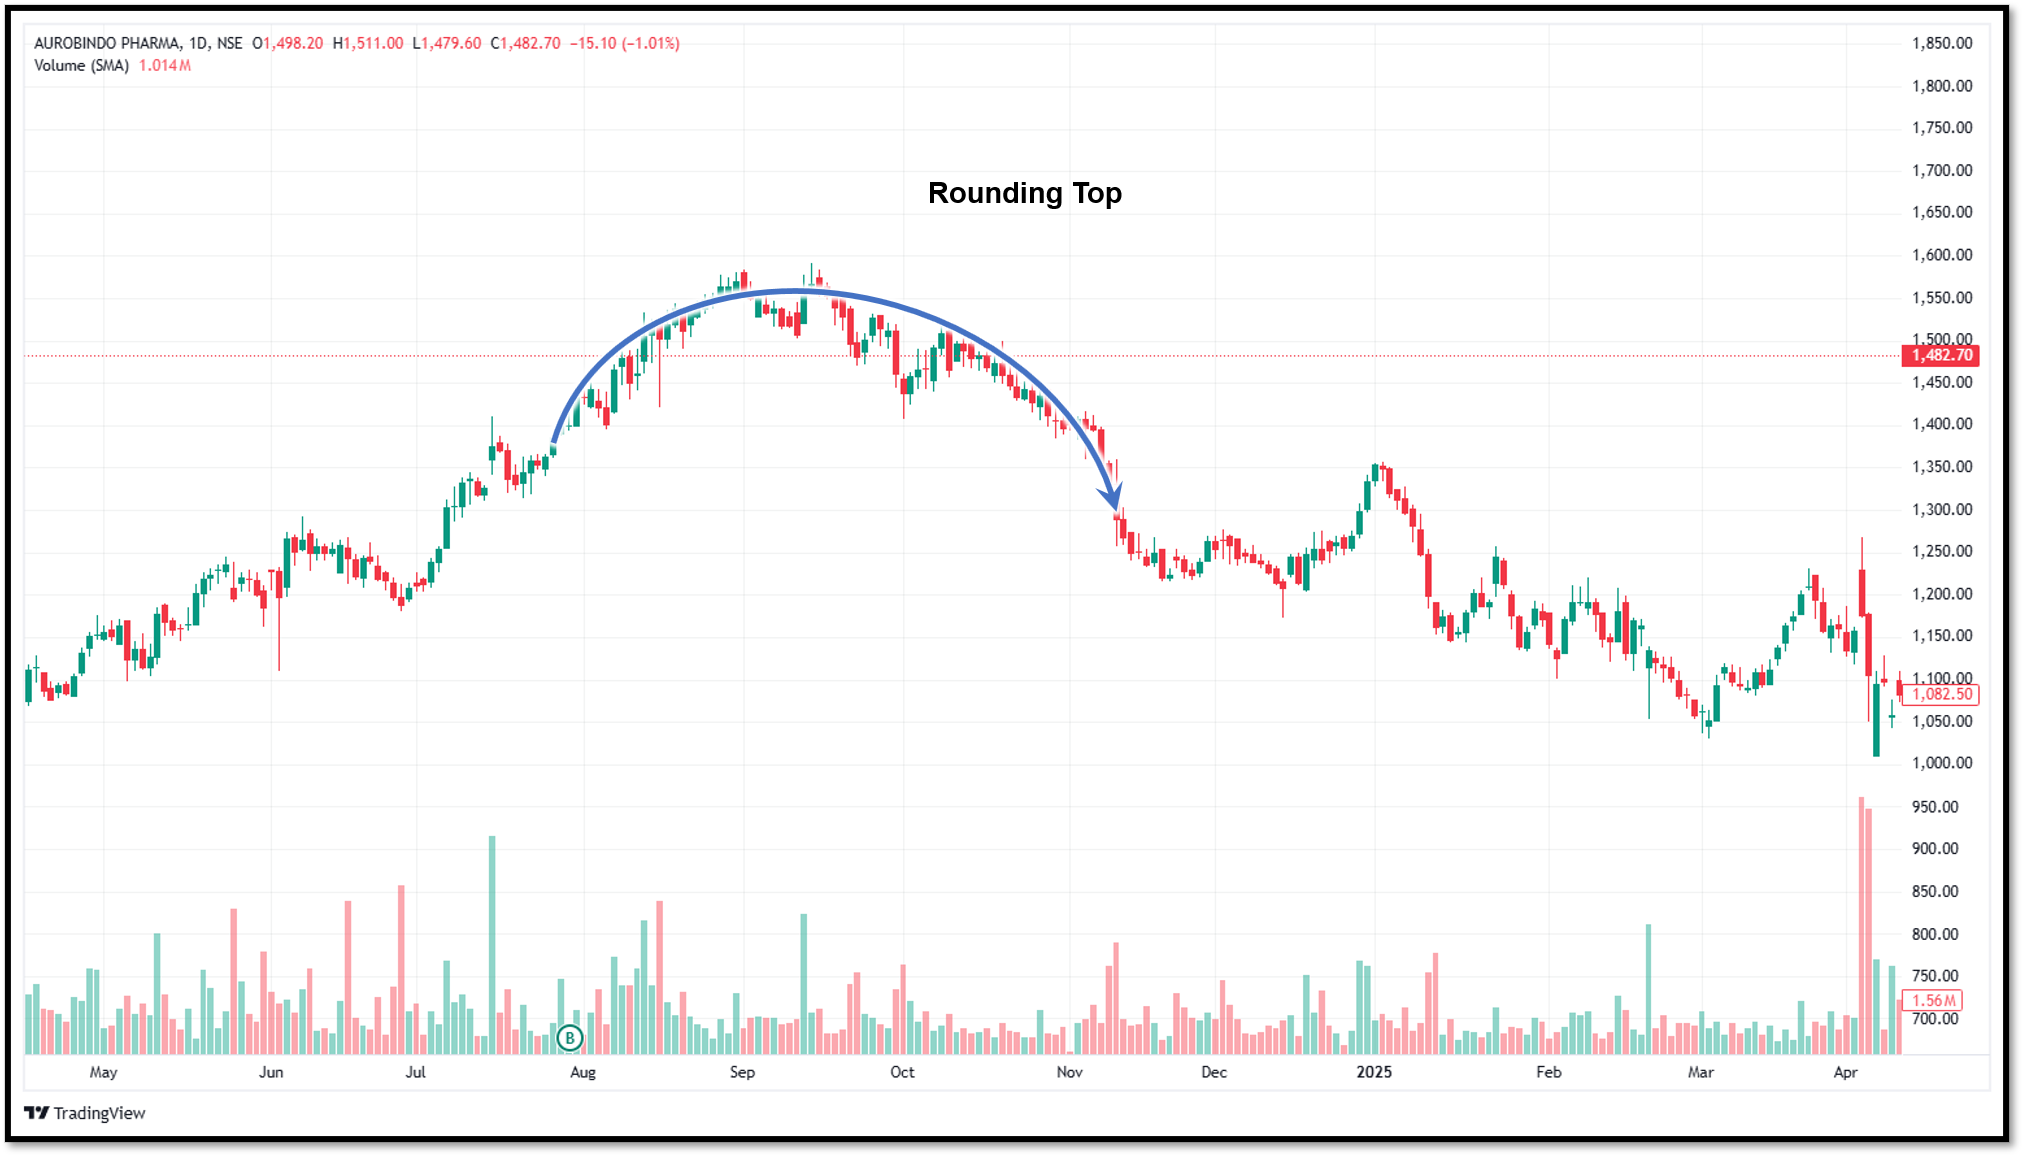
Why the pattern matters
The rounding top attracts attention because it usually develops during the late stages of an uptrend. Strong trends do not continue indefinitely. At some point, early buyers begin taking profits, valuations may appear stretched, or market sentiment may become less optimistic.
These factors can gradually reduce buying pressure. The rounding top helps traders identify this transition phase.
Instead of focusing solely on individual price movements, the pattern highlights a broader shift in the balance between supply and demand. By the time the pattern is fully confirmed, the market may already be entering a new bearish phase.
Understanding the psychology behind the pattern
Chart patterns are useful because they reflect the behaviour of market participants. The rounding top pattern begins with strong bullish sentiment. Buyers remain confident in the initial phase, hence the prices rise gradually. But, as the trend matures, new buying interest starts slowing.
Although prices may still reach new highs, each advance becomes less aggressive than the previous one. Eventually, buyers and sellers reach a temporary balance. At this stage, the market often moves sideways near the top of the formation.
As confidence weakens further, sellers gradually become more active. Profit-taking increases, demand declines, and the market slowly begins moving lower.
Key characteristics of a Rounding Top Pattern
For identifying a valid rounding top pattern, you need to understand the features of the rounding top pattern.
Existing uptrend
The pattern should form after a noticeable bullish trend. Without a prior uptrend, there is no trend available for the pattern to reverse.
Curved structure
The most distinctive characteristic is the smooth, rounded appearance. Price should transition gradually from rising to sideways and eventually to declining.
Gradual loss of momentum
The pattern reflects slowing bullish momentum. Price advances become smaller and less frequent as the formation develops.
Support breakdown
A break below support often serves as confirmation. This breakdown suggests that sellers have gained sufficient control to initiate a new bearish move.
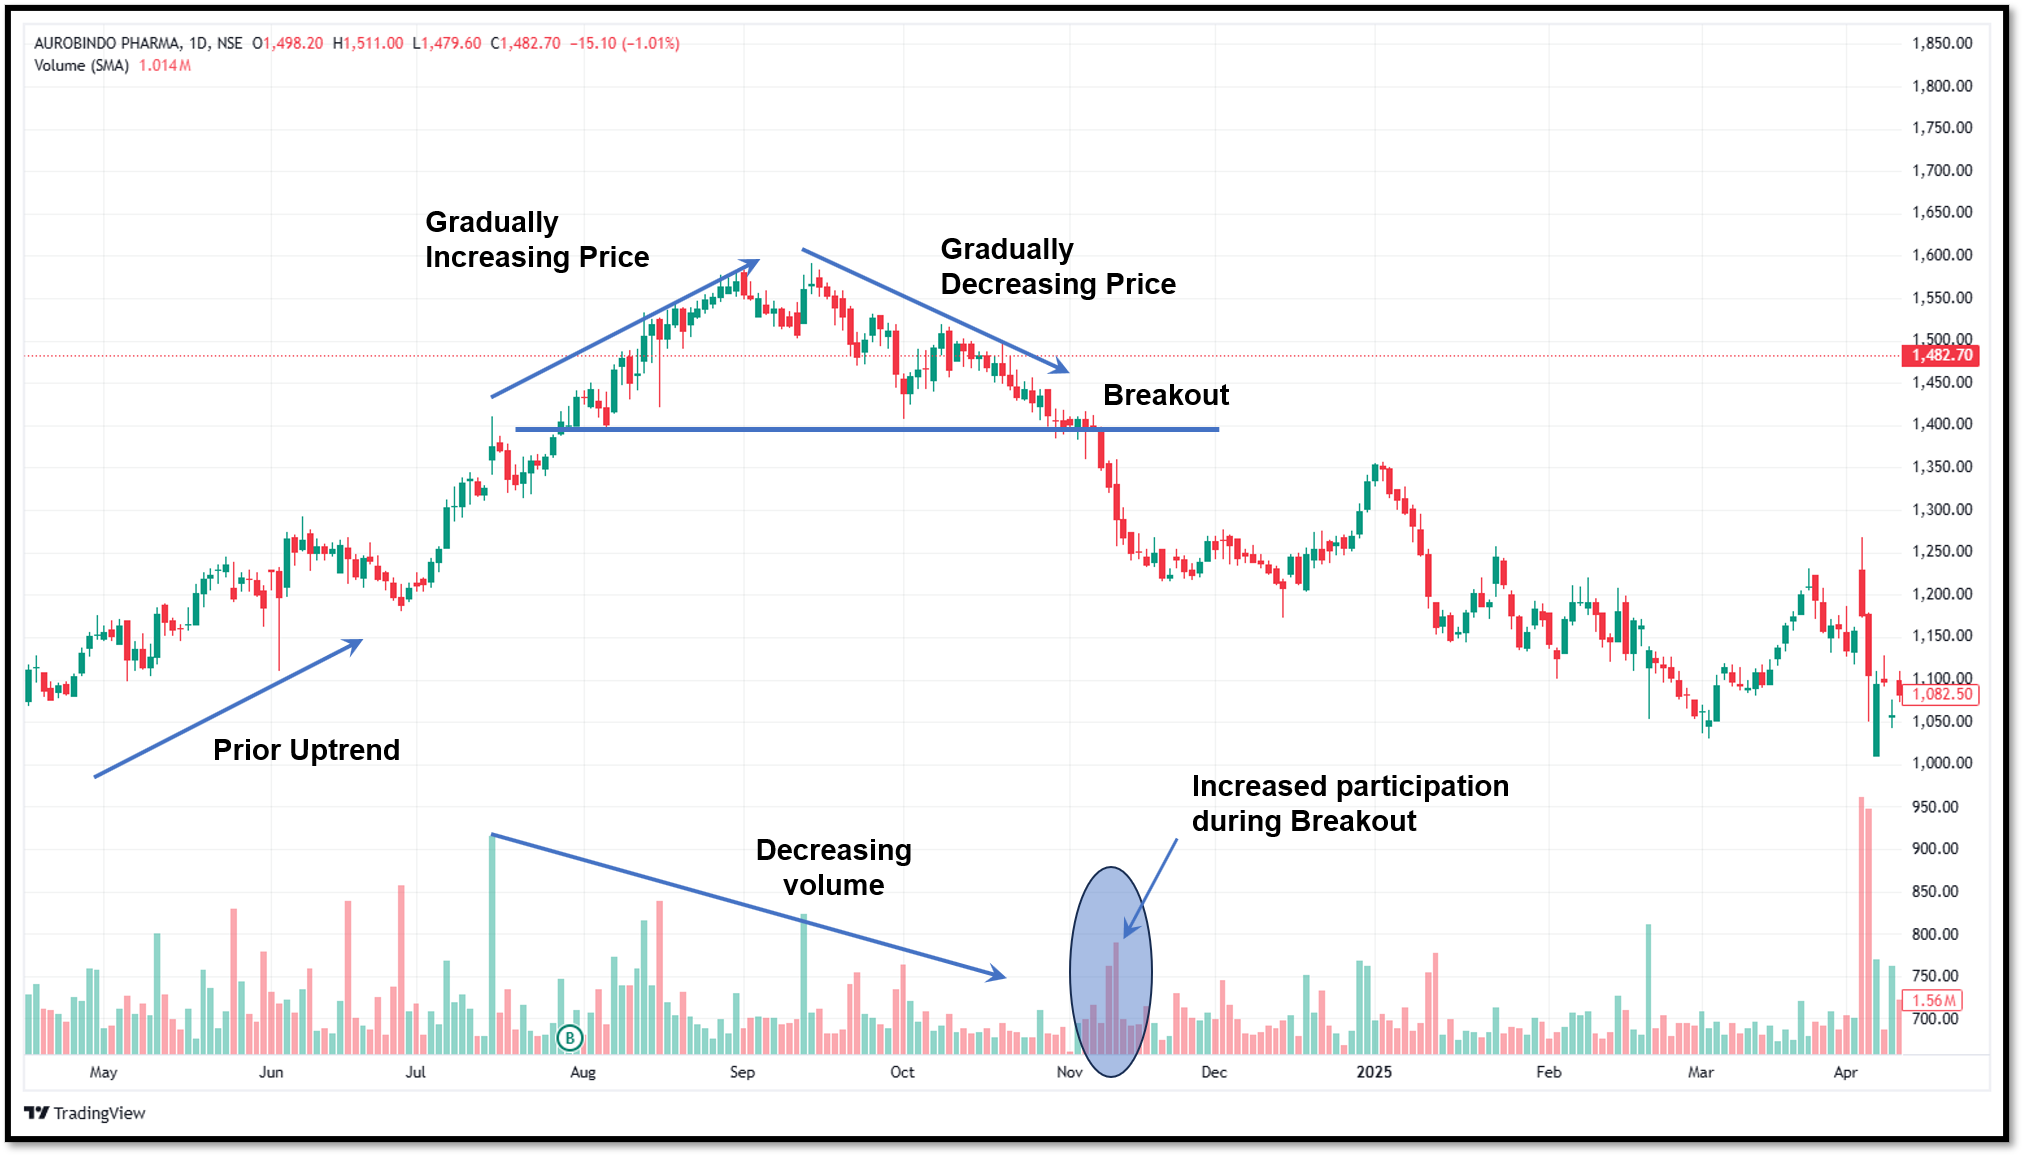
How volume behaves during a rounding top
Volume can provide useful insight into the strength of the pattern. In many cases, volume is relatively high during the early stages of the uptrend. As the pattern develops, trading activity usually begins declining.
This reduction in volume can indicate weakening buyer participation. When the formation approaches the breakout level, volume may increase again as selling pressure emerges.
Although volume behaviour varies across markets, declining participation during the formation and rising activity during the breakdown often strengthens the bearish interpretation.
Trading the Rounding Top Pattern
Different traders approach the pattern in different ways.
Conservative approach
Many traders wait for confirmation before taking action. This often involves waiting for a support break accompanied by increased selling pressure. Confirmation helps reduce the risk of acting on an incomplete pattern.
Aggressive approach
Some traders try to anticipate the reversal before confirmation occurs. They may reduce long exposure or initiate bearish positions when the upper portion of the pattern begins forming.
While this approach offers earlier entries, it also carries greater risk.
Stop-loss placement
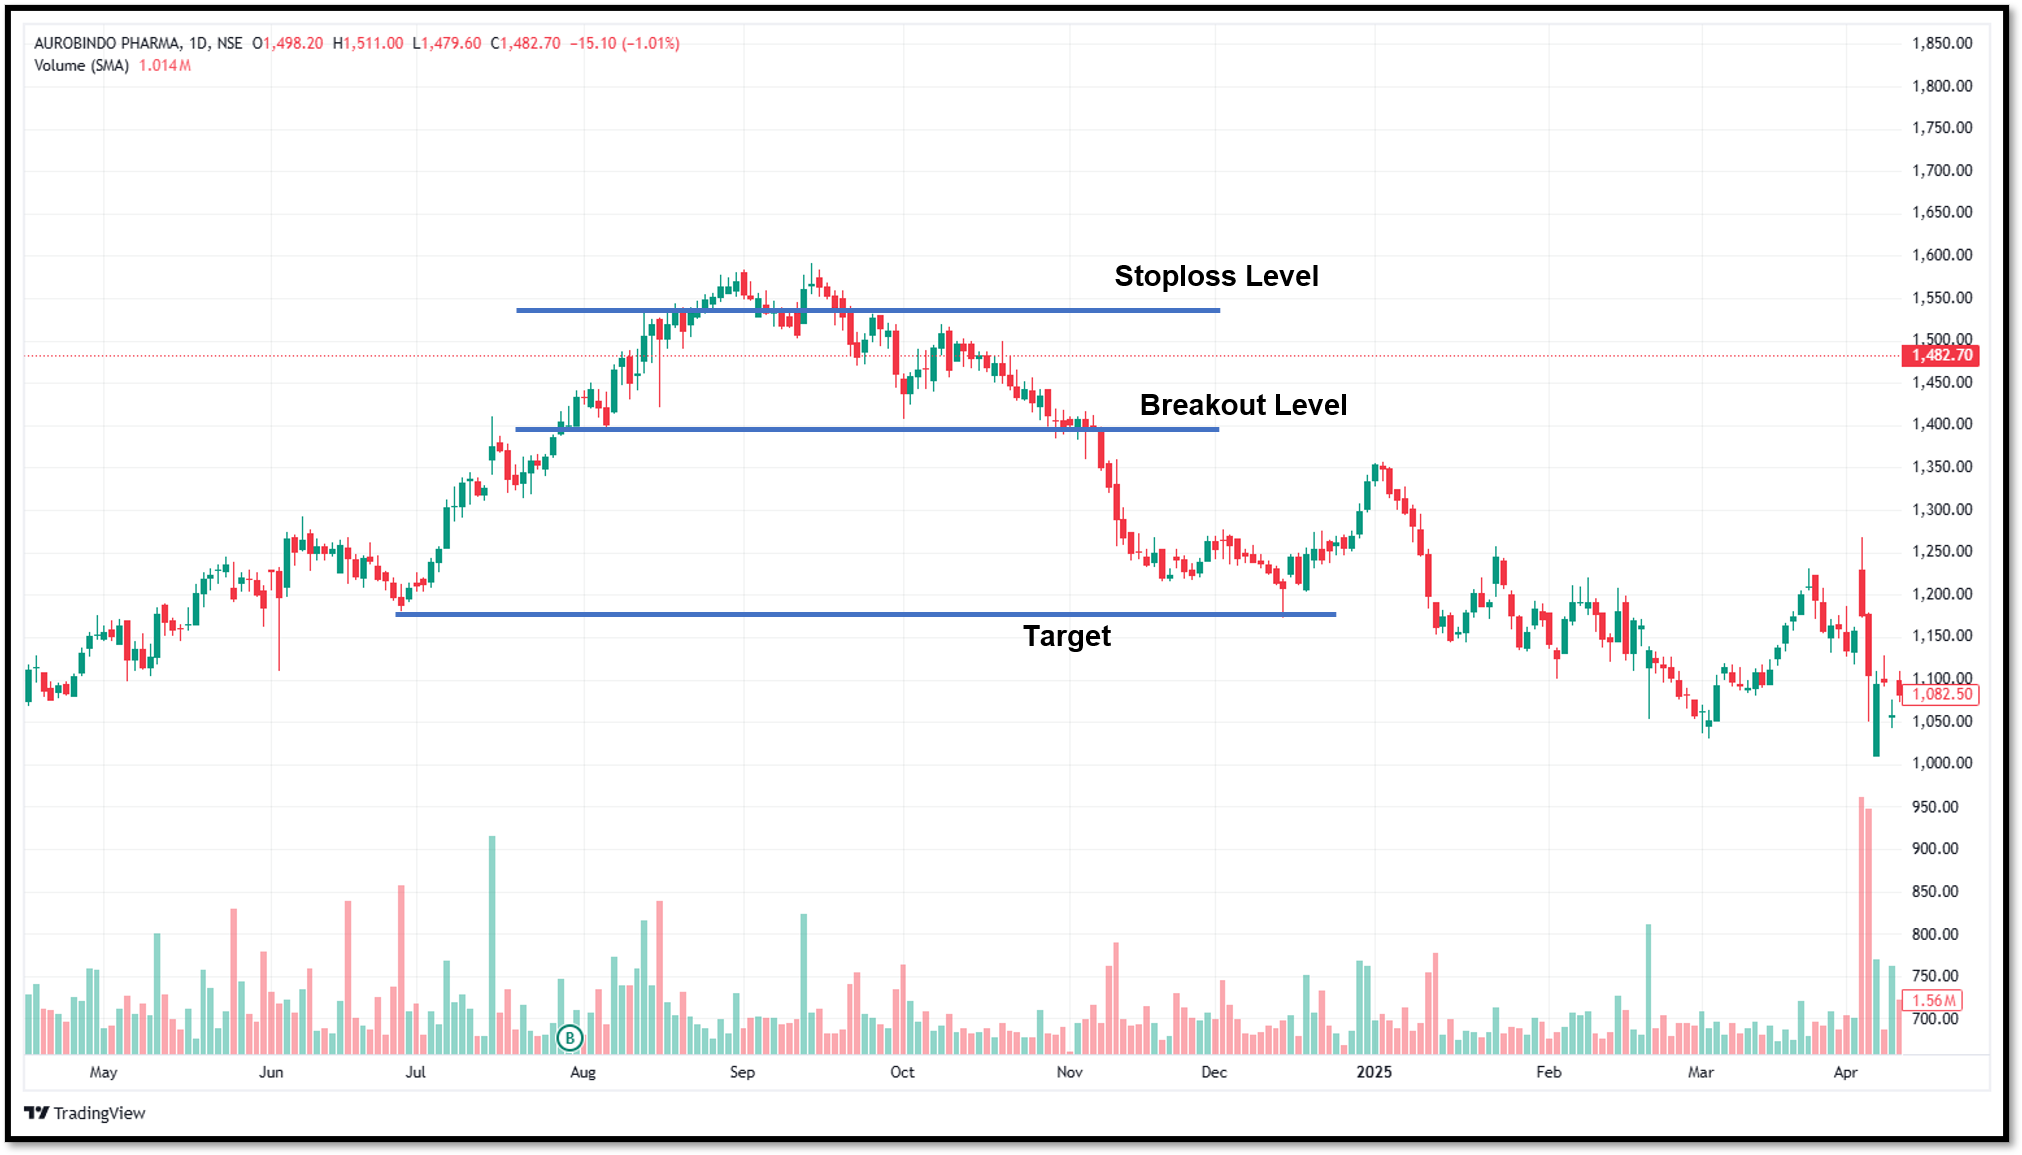
For bearish trades, stop-loss orders are usually placed above recent swing highs within the pattern. If the market resumes its uptrend, the bearish thesis may no longer be valid.
Profit targets
You may decide the target depending upon the following factors:
- Previous support levels
- Historical demand zones
- Risk-reward ratios
- Pattern height projections
Advantages of the Rounding Top Pattern
The advantages of the rounding top pattern are as follows:
- The pattern helps traders identify gradual trend deterioration before a significant decline becomes obvious.
- Unlike abrupt reversal patterns, the rounding top provides more time for analysis and decision-making. Its slow development allows traders to observe changes in momentum, volume, and market sentiment as the pattern evolves.
- The formation reflects a broad shift in supply and demand. This makes it useful for understanding longer-term market psychology and potential trend transitions.
- Rounding tops frequently develop near major market turning points. When confirmed by a support breakdown, they can provide insight into larger bearish trends rather than short-term pullbacks.
Disadvantages of the Rounding Top Pattern
Along with advantages, the rounding top pattern has some limitations as well. These are listed below:
- The pattern can take a long time to develop, sometimes requiring weeks or months to become recognisable. Traders seeking quick opportunities may find it less practical than shorter-term formations.
- Because the structure develops gradually, identifying the exact completion point can be difficult. Traders may interpret the same chart differently, leading to varying conclusions.
- Confirmation often occurs after a portion of the downward move has already begun. While waiting for confirmation improves reliability, it may reduce the potential profit available from the reversal.
- Not every rounded structure results in a bearish trend reversal. Some markets resume their uptrend after a period of consolidation, creating false signals for traders who act too early.
Wrap up
The rounding top pattern is a bearish reversal pattern that shows a gradual shift of market sentiment from bullish to bearish. The rounding top develops over multiple sessions as the buying momentum fades gradually and selling starts slowly. With the rounding top pattern, you can see how the trend weakens gradually and then reverses.
If you have a good understanding of the rounding top pattern, you will be able to spot weakening trends and potential turning points in the market.
FAQs
Is the rounding top pattern bullish or bearish?
The rounding top is a bearish reversal pattern that typically develops after an uptrend and may signal the beginning of a downward trend.
How long does a rounding top pattern take to form?
The pattern develops over several weeks or months. Longer formations are generally considered more significant than those forming over short periods.
How to confirm a rounding top pattern?
When the pattern breaks a key support level or the pattern height projection, the pattern is usually considered confirmed. Also, increased volume during the breakdown can strengthen the signal.
Can the rounding top pattern be used in intraday trading?
Yes, but it is more commonly observed on higher timeframes, such as daily and weekly charts, because of the time required for the formation to develop.
Can a rounding top fail?
Yes. A few of the visible rounding tops could turn into consolidations before the market continues its uptrend.