



What is Supertrend Indicator?




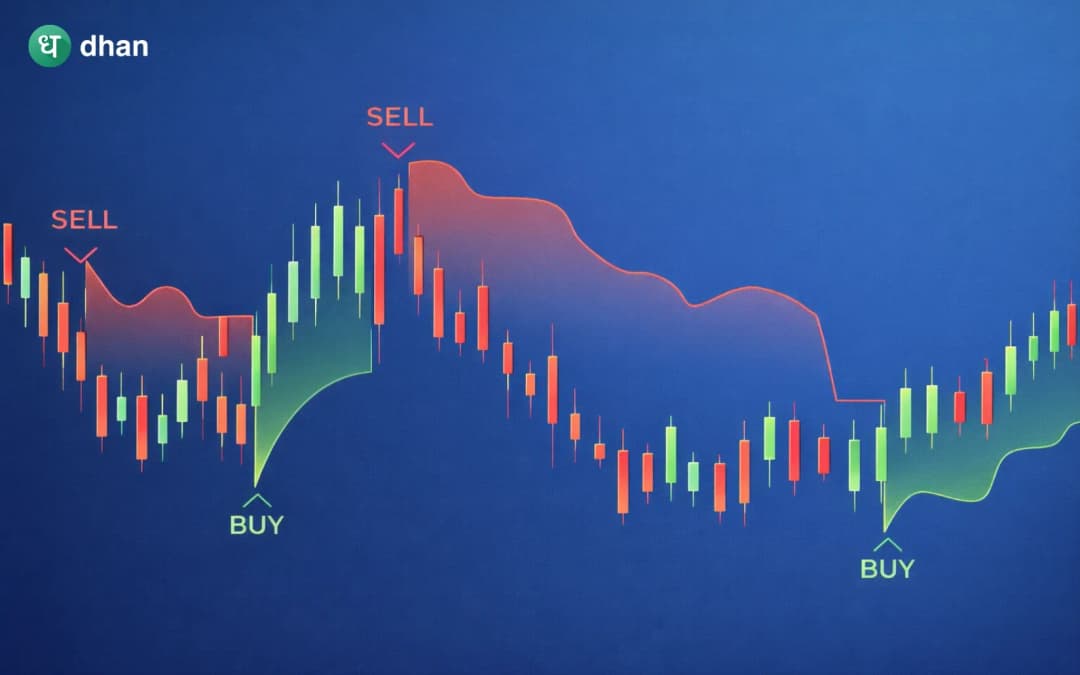




Before entering the market, traders usually identify the overall market direction. Although price action can give raw insights, traders also use technical indicators to simplify analysis and improve consistency. Supertrend is one of the indicators that traders widely use to identify market direction. It has gained popularity due to its simplicity and effectiveness.
Supertrend is easy to interpret; it gives clear signals and potential entry and exit points. Whether you are an intraday trader, swing trader, or even a beginner, understanding how Supertrend works can significantly improve your trading decisions. This article will help you understand how the Supertrend indicator works, how it is calculated, and how you can use it effectively during actual trading.
What is the Supertrend indicator?
The Supertrend indicator is a trend-following technical indicator that is plotted directly on the price chart. It is intended to assist traders in determining the prevailing market trend and producing buy or sell signals. A line that shifts above or below the price is how the indicator is shown.
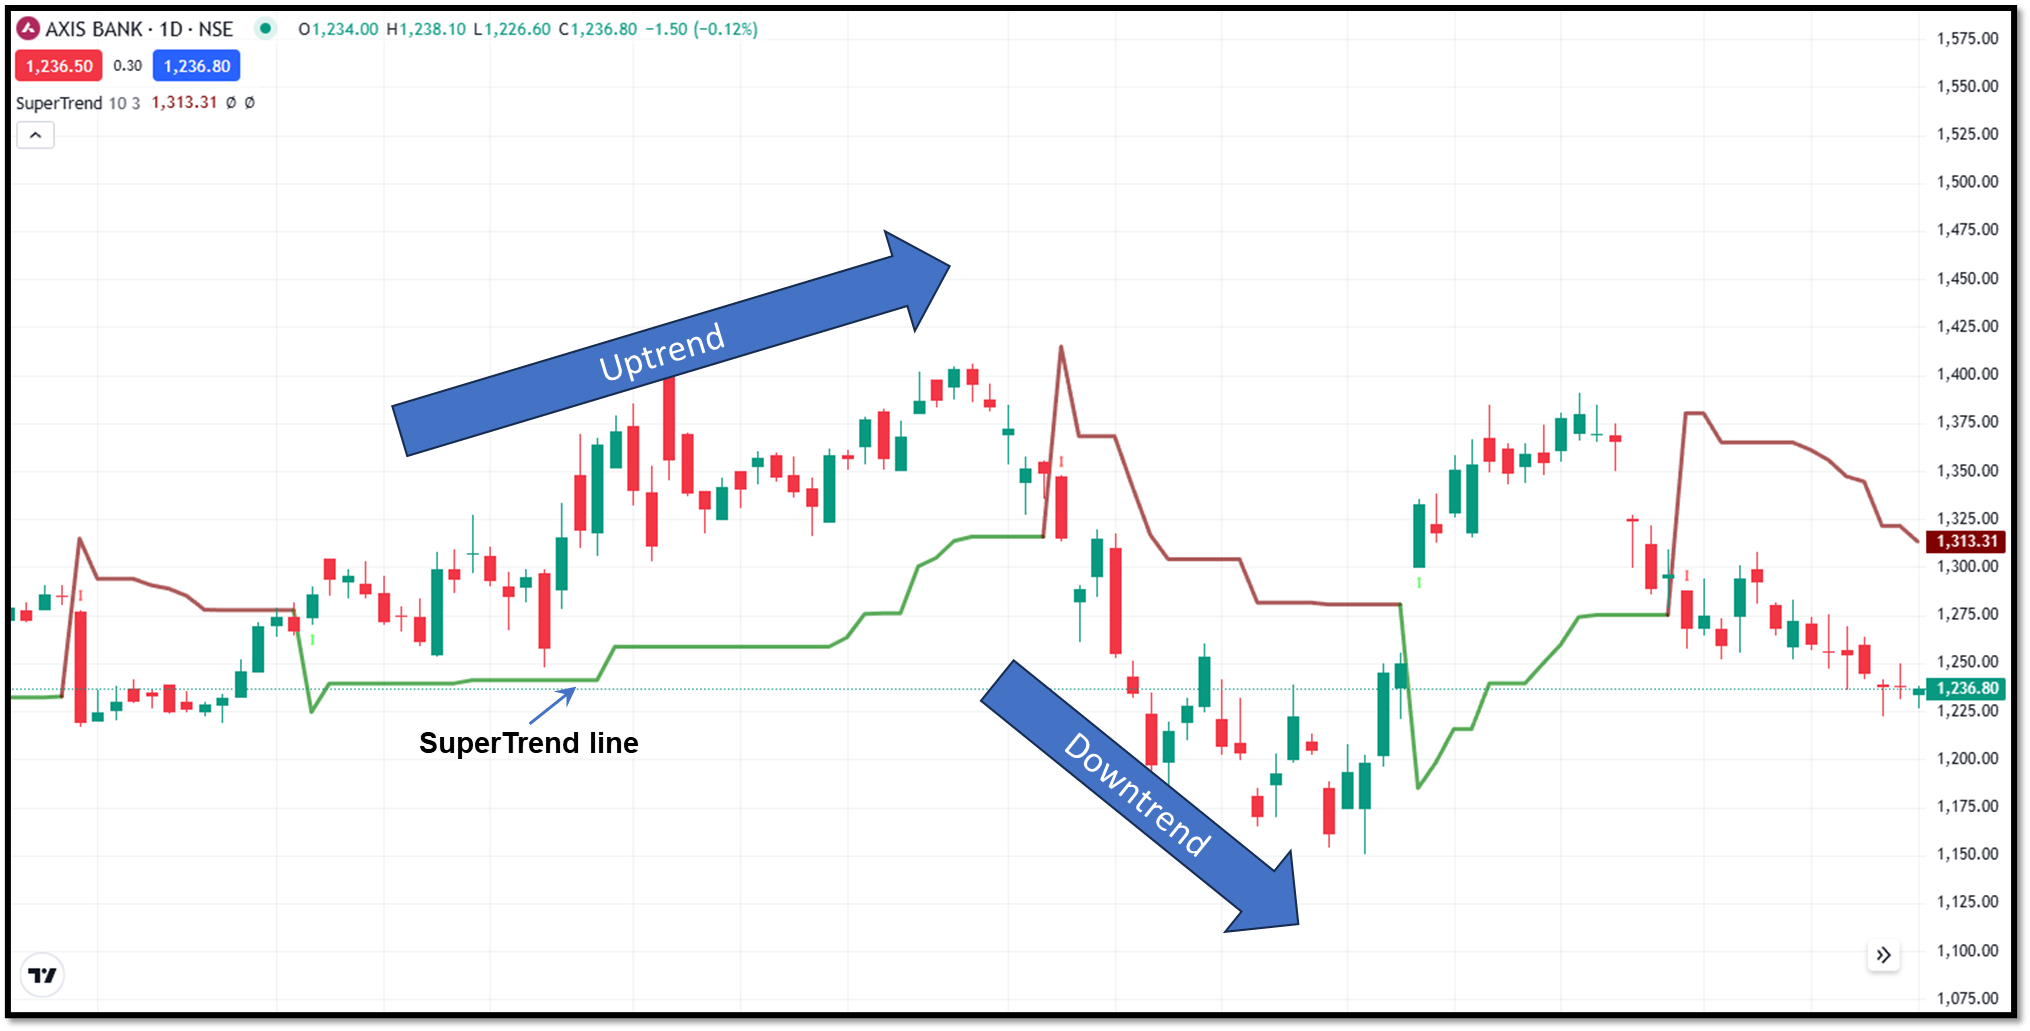
When the Supertrend line is below the price, it indicates a bullish trend, and when it is above the price, it indicates a bearish trend. The supertrend combines price action with market volatility, due to which it quickly adapts to the changing market conditions. To achieve this, it uses Average True Range (ATR), which plays a key role in calculations.
The indicator is widely used across different markets, including stocks, futures and options, commodities, forex, and cryptocurrencies.
Components of Supertrend
You need to understand the key components of Supertrend to know how it works. These components define how the indicator behaves under different market conditions.
Average True Range (ATR)
ATR measure the market volatility. It tells you how much the price is moving over a specific period. High ATR represents a volatile market, while low ATR means the market is stable.
Depending upon the ATR, the Supertrend decides how far the line should be from the price. When volatility increases, the Supertrend line moves further away from the price, reducing false signals. When volatility decreases, it moves closer, allowing quicker signals.
Multiplier
To control the sensitivity of the indicator, a factor is applied to the ATR value. This factor is called a multiplier. A lower multiplier makes the indicator more sensitive, which can generate more signals. Fewer but more dependable signals can be produced with a higher multiplier, such as 3 or 4. You can balance early entry and steer clear of false signals by selecting the appropriate multiplier based on market conditions.
Basic bands
The Supertrend indicator uses two bands: the upper and lower bands. These bands are calculated using price averages and ATR. They act as dynamic support and resistance levels. Depending on price changes, the final Supertrend line switches between these bands.
What is Supertrend formula & calculation
You can understand the behaviour of the Supertrend by understanding the calculations behind it. Supertrend does the calculations in the following steps:
Calculate ATR
ATR is calculated using the True Range, which considers:
- Current high − current low
- Current high − previous close
- Current low − previous close
Typically, traders use a 10-period ATR.
Calculate basic bands
Supertrend uses below formulas for calculating the upper and lower bands. These bands form the foundation of the Supertrend indicator.
- Upper Band = (High + low/2) + (Multiplier x ATR)
- Upper Band = (High + low/2) - (Multiplier x ATR)
Adjust final bands
Supertrend does not use the calculated bands directly. They are adjusted based on previous values to avoid frequent flipping.
- If the current upper band is lower than the previous upper band, it is retained
- If the current lower band is higher than the previous lower band, it is retained
This adjustment smooths the indicator and reduces noise.
Determine Supertrend value
Supertrend line forms by below logic:
- If the price closes above the upper band, the Supertrend switches to the lower band (bullish signal)
- If the price closes below the lower band, the Supertrend switches to the upper band (bearish signal)
This “switching mechanism” is what generates trading signals.
Interpretations of Supertrend
The Supertrend indicator is primarily used for trend identification and signal generation.
Trend Identification
The position of the Supertrend line relative to price defines the ongoing trend. If the price is trading above the Supertrend indicates an uptrend. While the price below the Supertrend indicates a downtrend.
This makes it very easy to visually identify market direction without overcomplicating analysis.
Signal Generation
Supertrend generates signals when it flips from one side of the price to the other.
- Buy Signal: When the line moves from above the price to below it.
- Sell Signal: When the line moves from below the price to above it.
These signals are clear and easy to follow, which is why beginners prefer this indicator.
How to use Supertrend in trading
Understanding the theory behind any indicator is only the first step. The real value comes from applying the indicator correctly. You can use the following strategies by using Suoertrend.
Basic strategy using Supertrend
This is the simple and beginner-friendly strategy.
- Buy when Supertrend turns bullish (line below price)
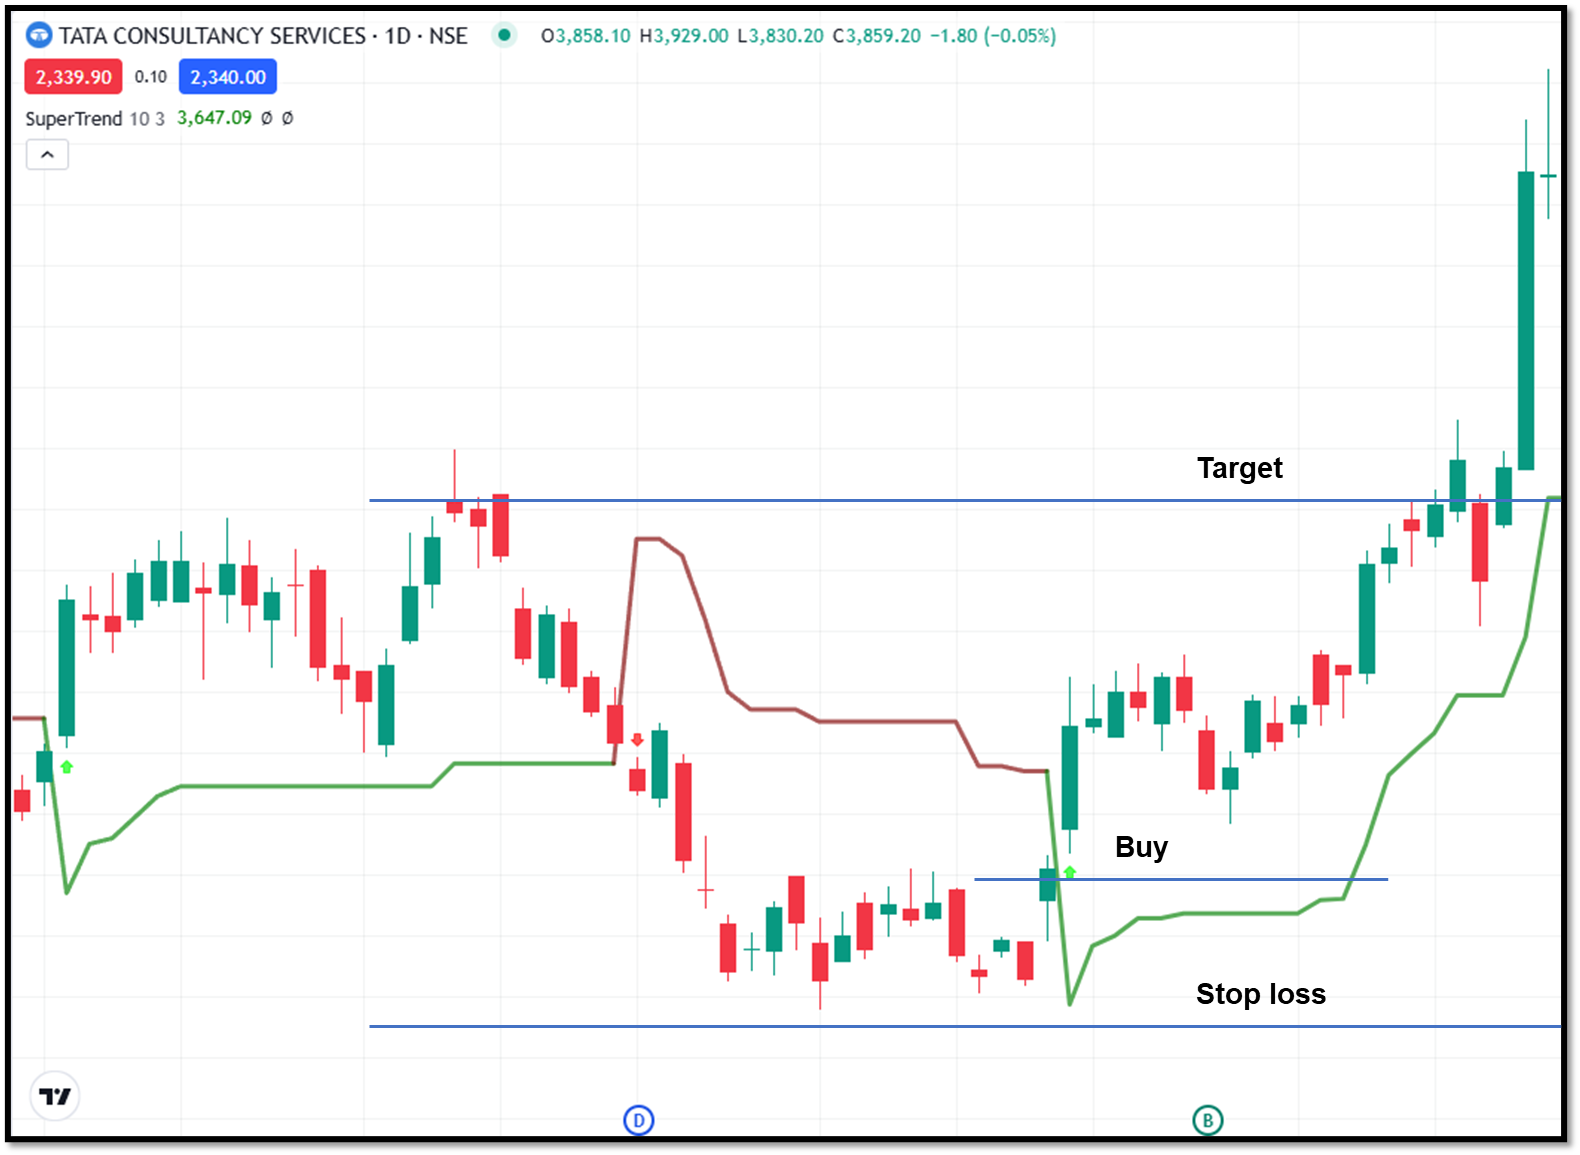
- Sell when Supertrend turns bearish (line above price)
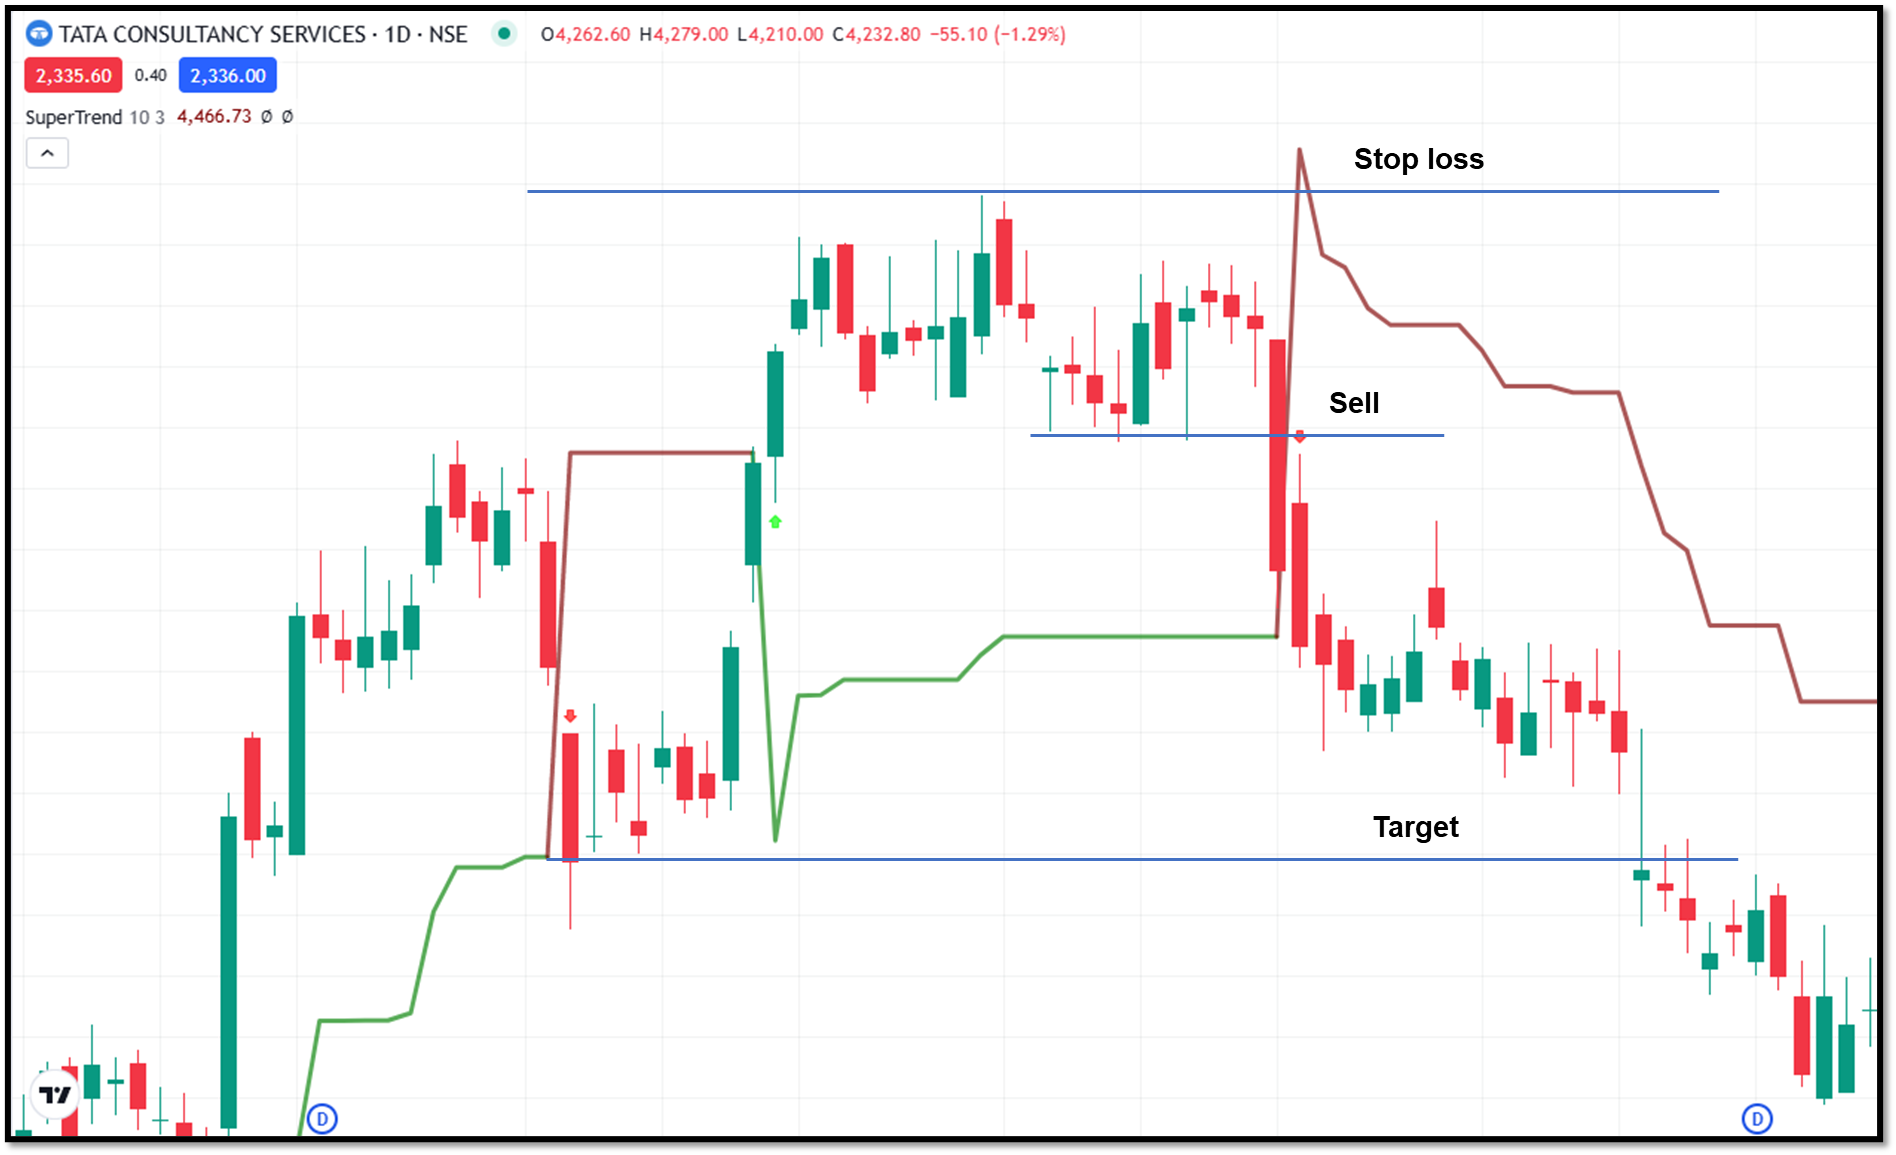
Using Supertrend with price action
Supertrend works best when combined with basic price action concepts:
- If a buy signal appears near support levels, it suggests a strong possibility of reversal.
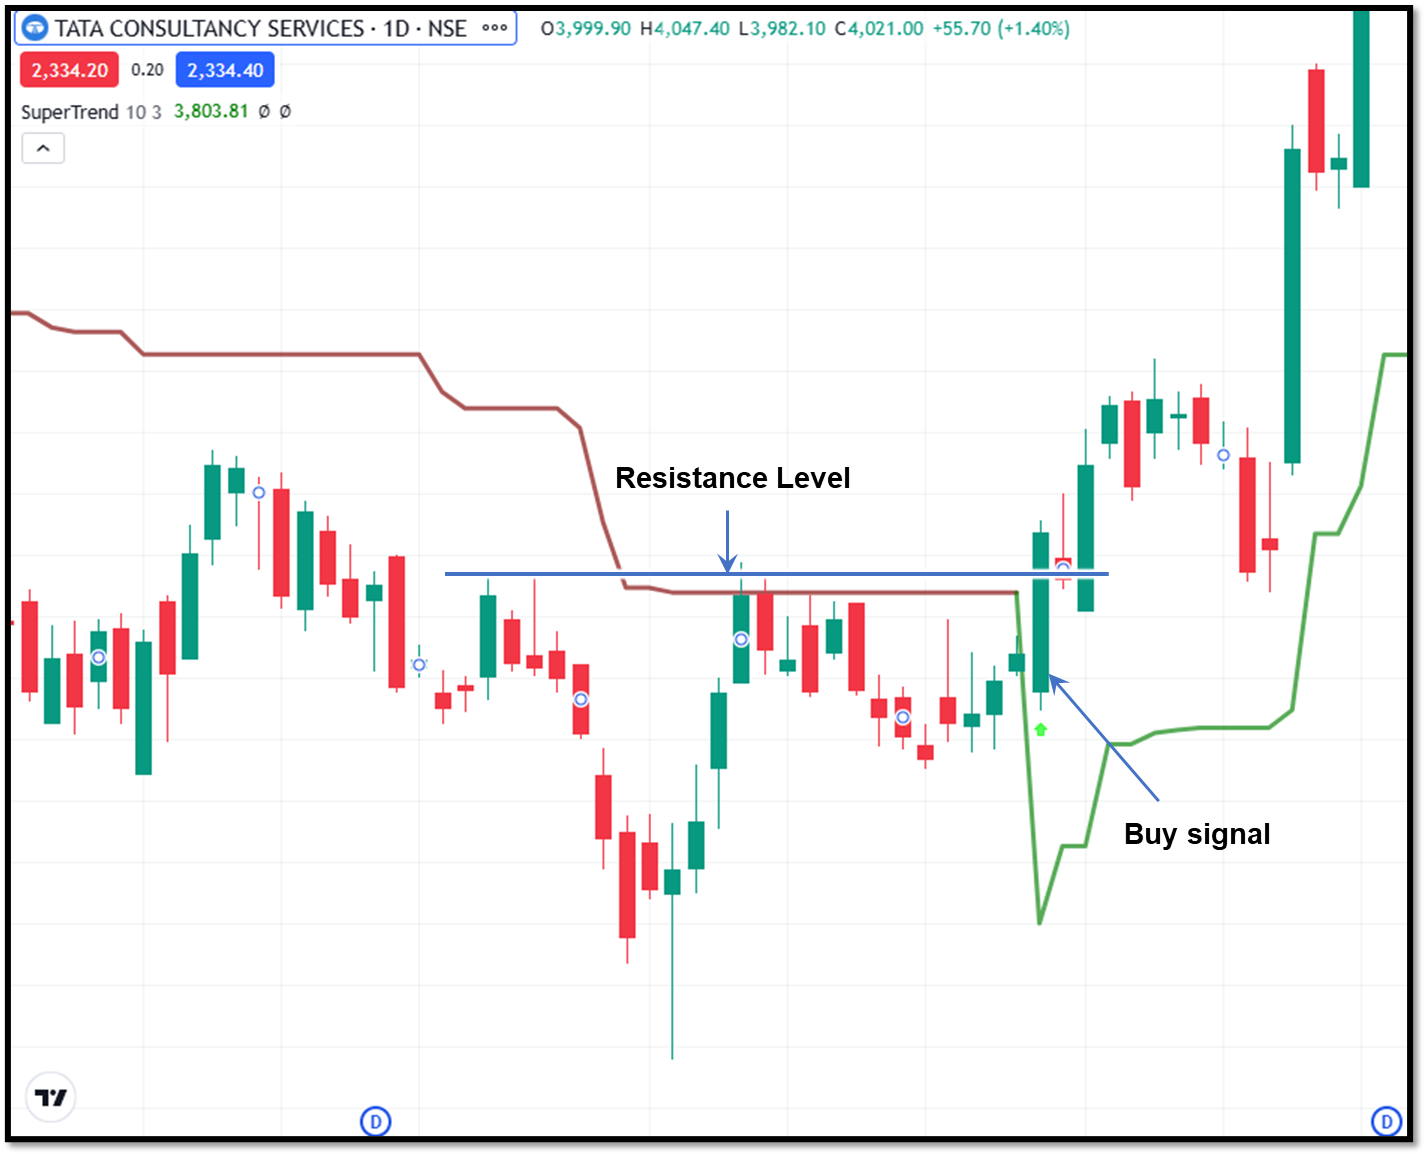
- If a sell signal appears near resistance levels, it also suggests a strong possibility of reversal.
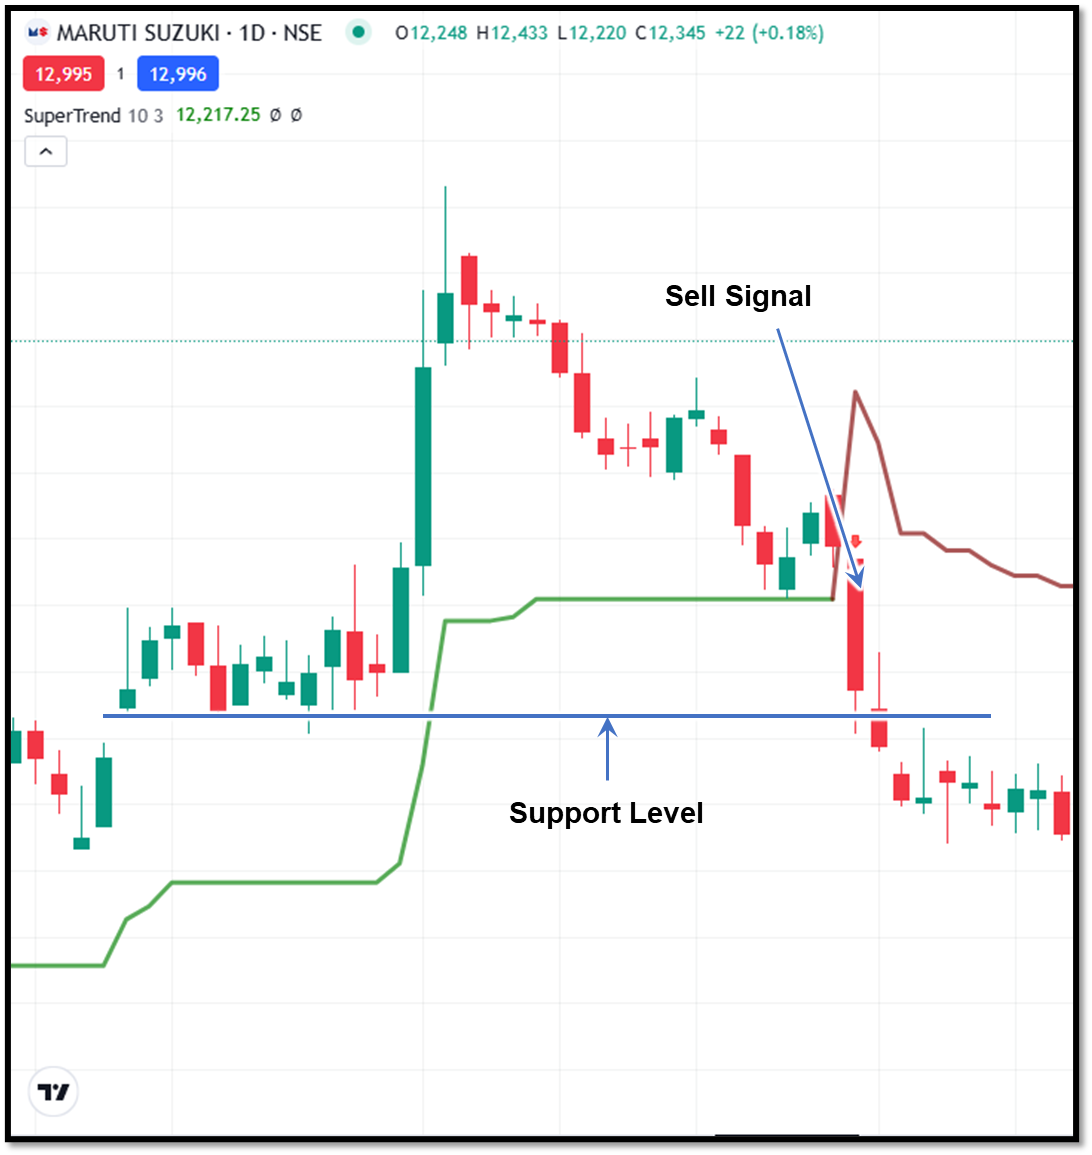
Supertrend can generate false signals during sideways markets, hence avoid trades during such market conditions.
Combining with other indicators
If you use Supertrend along with other indicators, then its efficiency increases. You can use the indicators below to confirm the signal from Supertrend.
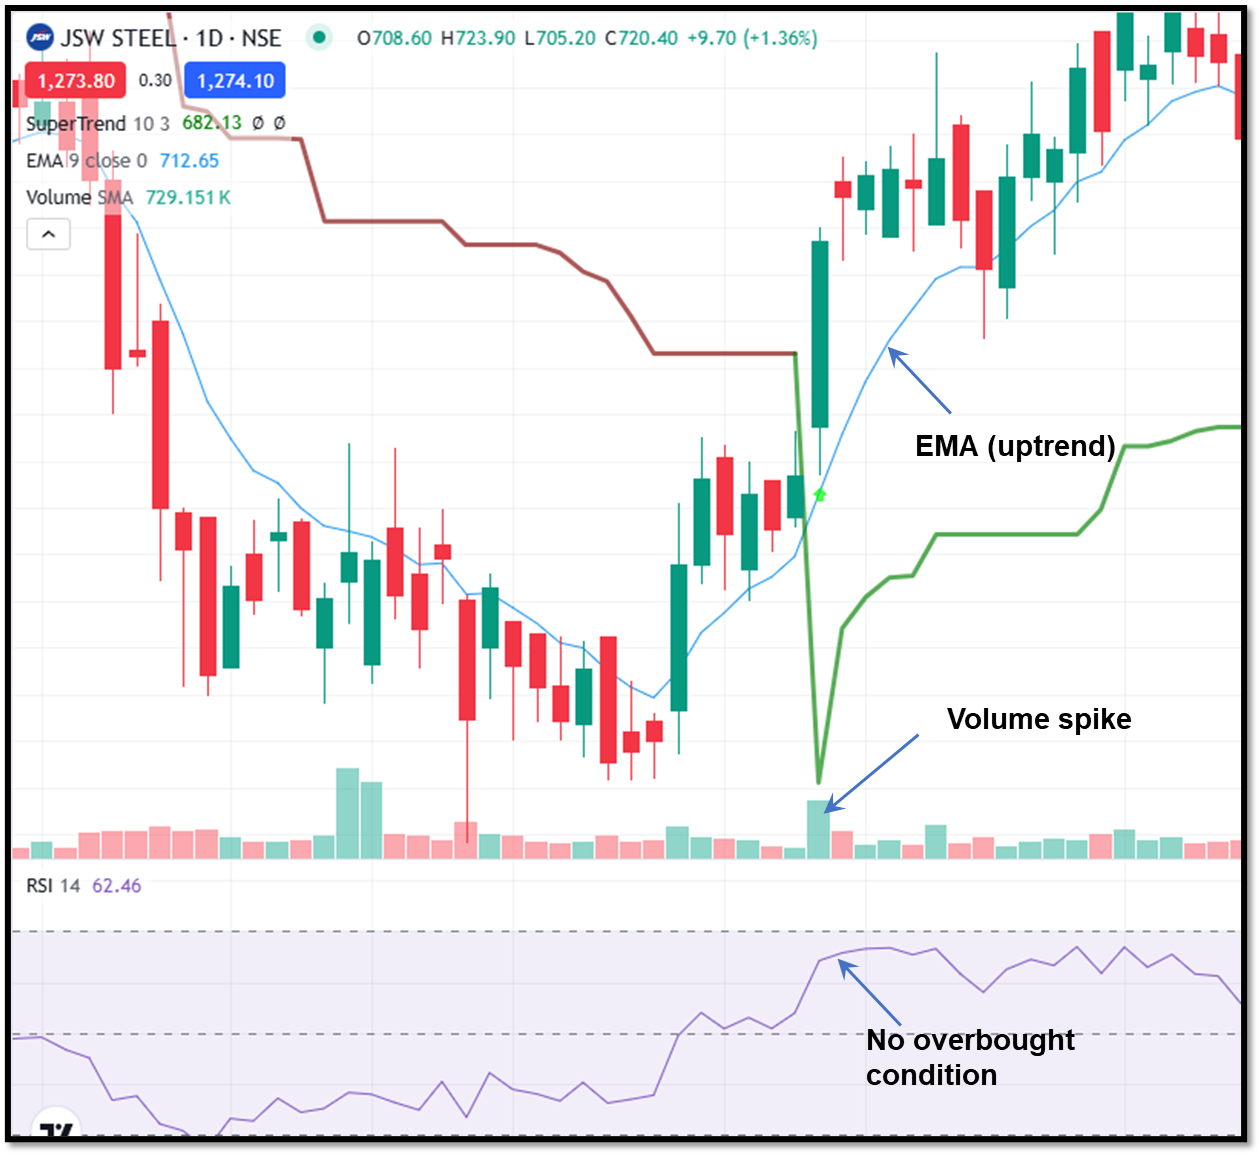
- Moving Averages: Use them to confirm trend direction.
- RSI: It can help you to avoid overbought/oversold entries.
- Volume: An increased volume can validate the strength of moves.
Using Supertrend as a trailing stop loss
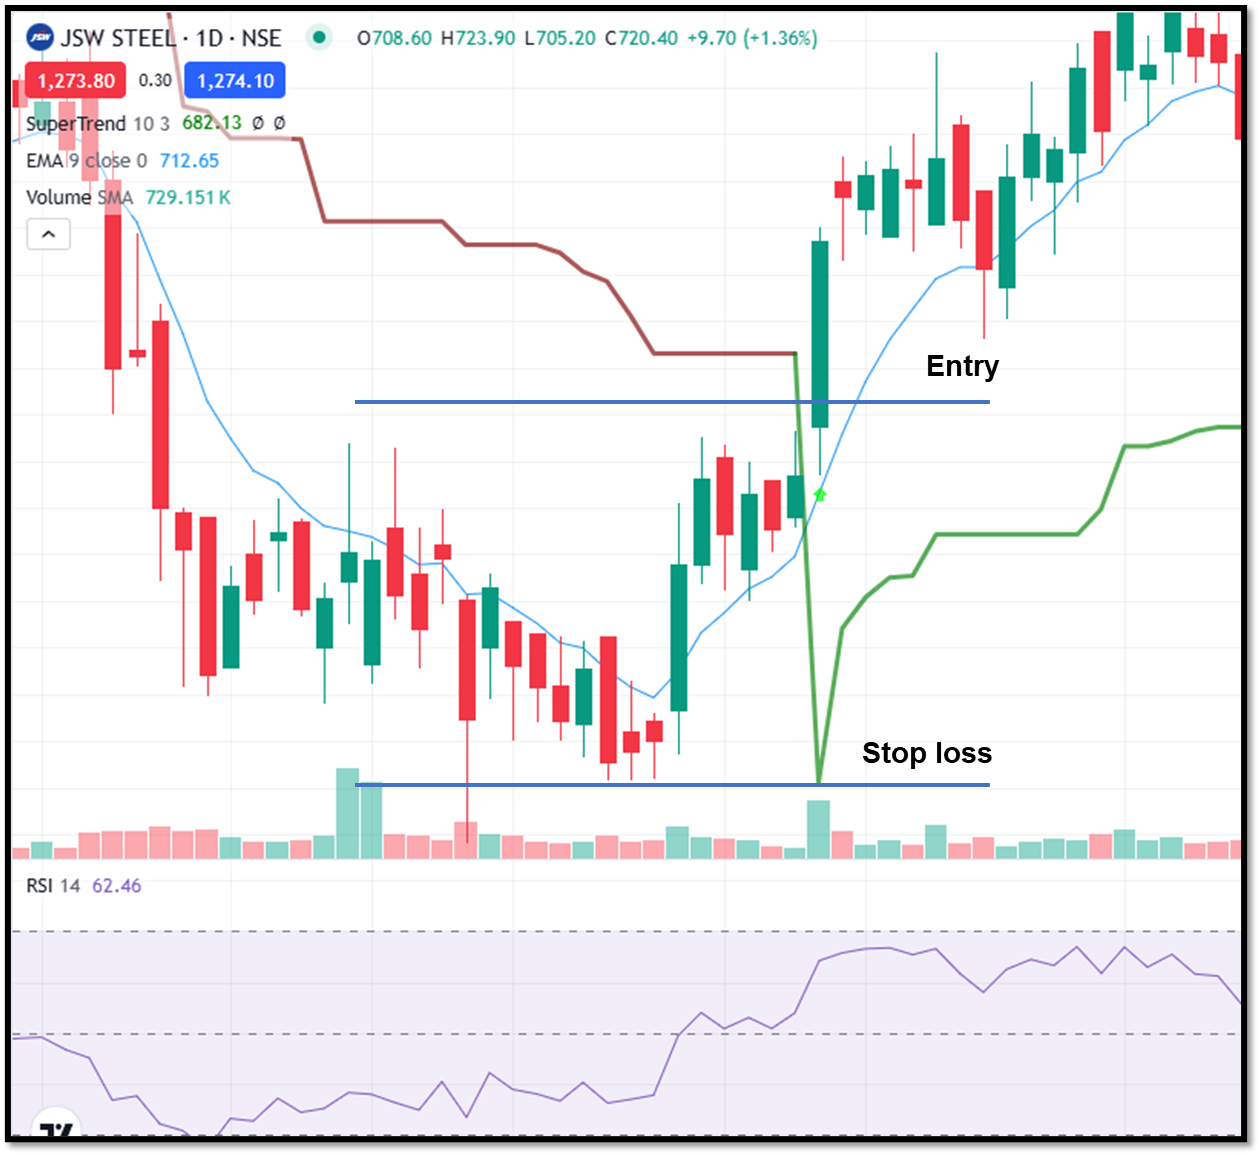
One of the most powerful uses of Supertrend is as a trailing stop. Traders stay in the trade as long as the price stays above/below the line and exit when the indicator flips. This helps capture large trends while managing risk.
Advantages of Supertrend
Here are the advantages of this indicator.
- The Supertrend indicator is beginner-friendly as it provides clear visual signals directly on the price chart. Traders do not need complex interpretation, making it ideal for those just starting with technical analysis.
- It generates straightforward entry and exit signals based on trend reversals. This reduces confusion and helps traders make quicker decisions, especially in fast-moving markets.
- Supertrend is a useful tool for positional, swing, and intraday trading. Because of its adaptability, it can be used with a variety of asset classes and trading styles.
- The indicator can follow the trend and function as a dynamic stop-loss. As long as the trend persists, this enables traders to lock in profits while remaining in a trade.
- Since it is based on ATR, the indicator automatically adjusts to changing market conditions. This helps in filtering out minor price fluctuations and focusing on meaningful trends.
Limitations of Supertrend
Now, let’s also understand its limitations.
- In range-bound conditions, the indicator tends to flip frequently between buy and sell signals. This can lead to multiple small losses and confusion for traders.
- During periods of low clarity or high noise, Supertrend may generate misleading signals. Without confirmation from other tools, these signals can result in poor trade entries.
- Like most trend-following indicators, Supertrend reacts to price movements rather than predicting them. This means entries and exits may occur after a portion of the move has already happened.
- It can be dangerous to rely only on Supertrend, particularly in erratic markets. Reliability is increased, and false trades are decreased when it is combined with other indicators or price action.
Conclusion
Supertrend is one of the most widely used and beginner-friendly indicators in technical analysis.
It has the ability to adapt to the market conditions as it is based on the ATR. It provides a clear signal of trend reversal and the ongoing trend.
But, like every indicator, it should not be used in isolation. Supertrend gives the best results when combined with price action, risk management and disciplined execution.
FAQs
Is Supertrend suitable for intraday trading?
Yes, Supertrend can be used for intraday trading with lower ATR settings and appropriate timeframes.
What is the best timeframe for using Supertrend?
Supertrend can be used on all timeframes, but lower timeframes can generate more false signals, while if you use Supertrend with a higher timeframe, it will give more reliable signals.
Which is better, Supertrend or moving averages?
Supertrend adapts better because it considers volatility with ATR, but it is not necessarily better. Many traders prefer to use both for stronger confirmation.
Which setting is best for the Supertrend indicator?
The most common setting is an ATR period of 10 and a multiplier of 3. This setting strikes a good balance between sensitivity and reliability
Does the Supertrend indicator repaint?
During the live candle, the indicator may change the signal, but after the formation of the candle, it does not repaint. Traders usually wait for the candle formation.







